
Abstract
Introduction: It is challenging to identify health state utilities associated with psoriasis because generic preference-based measures may not capture the impact of dermatological symptoms. The Psoriasis Area Severity Index (PASI) is one of the most commonly used psoriasis rating scales in clinical trials. The purpose of this study was to develop a utility scoring algorithm for the PASI.
Methods: Forty health states were developed based on PASI scores of 40 clinical trial patients. Health states were valued in time trade-off interviews with UK general population participants. Regression models were conducted to crosswalk from PASI scores to utilities (e.g. OLS linear, random effects, mean, robust, spline, quadratic).
Results: A total of 245 participants completed utility interviews (51.4% female; mean age = 45.3 years). Models predicting utility based on the four PASI location scores (head, upper limbs, trunk, lower limbs) had better fit/accuracy (e.g. R2, mean absolute error [MAE]) than models using the PASI total score. Head/upper limb scores were more strongly associated with utility than trunk/lower limb. The recommended model is the OLS linear model based on the four PASI location scores (R2 = 0.13; MAE = 0.03). An alternative is recommended for situations when it is necessary to estimate utility based on the PASI total score.
Conclusions: The derived scoring algorithm may be used to estimate utilities based on PASI scores of any treatment group with psoriasis. Because the PASI is commonly used in psoriasis clinical trials, this scoring algorithm greatly expands options for quantifying treatment outcomes in cost-effectiveness analyses of psoriasis therapies. Results indicate that psoriasis of the head/upper limbs could be more important than trunk/lower limbs, suggesting reconsideration of the standard PASI scoring approach.
Introduction
Decisions regarding allocation of healthcare resources are often informed by cost-effectiveness analyses in which treatments are assessed in terms of cost per quality-adjusted life year (QALY) gainedCitation1. QALYs are calculated using health state utilities, which are scores representing the strength of preference for a given health stateCitation2,Citation3. Although utilities for specific patient populations and treatment groups are often derived from generic preference-based measures such as the EQ-5D, these generic measures are not relevant or sensitive to every medical condition. Therefore, there is growing interest in the development of preference-based scoring algorithms for condition-specific measures to estimate utilities in situations when generic instruments are not appropriateCitation4.
Dermatoses such as psoriasis may present a serious challenge for generic preference-based measures. For example, although the EQ-5D has demonstrated adequate measurement properties in some studies with psoriasis patientsCitation5, this measure may be insensitive to psoriasis severity or treatment-related changeCitation6–8. The five items of the EQ-5D assess level of mobility, self-care, usual activities, pain/discomfort, and anxiety/depression. These concepts appear to have limited overlap with the impact of psoriasisCitation9. To address this limitation of the EQ-5D, researchers have explored the possibility of adding a sixth item focusing specifically on psoriasisCitation7,Citation8. In addition, there is a utility scoring algorithm associated with the Dermatology Life Quality Index (DLQI), a measure of dermatology-related quality-of-life impactCitation10,Citation11. However, the DLQI is not psoriasis-specific, and it is not one of the most broadly used outcome instruments in psoriasis trials. Therefore, it has limited usefulness for deriving utilities specific to psoriasis.
One of the most commonly used psoriasis measures in clinical trials is the clinician-rated Psoriasis Area Severity Index (PASI)Citation12–16. If utilities could be derived from PASI scores, it would be possible to obtain utilities from the wide range of clinical trials in which the PASI was administered. This would greatly expand the available options for estimating utilities that could be used in cost-effectiveness analyses of psoriasis treatments. Therefore, the purpose of this study was to develop an algorithm for deriving utilities from PASI scores.
Methods
Overview of study design
This study design followed three steps similar to other studies that have derived preference-based scoring algorithms for condition-specific measuresCitation17–20. First, health states corresponding to a range of PASI scores were developed. Second, utilities for each health state were obtained in a time trade-off (TTO) valuation study with general population respondents. Third, regression modeling was performed to identify a scoring algorithm for estimating utility based on any PASI score.
PASI
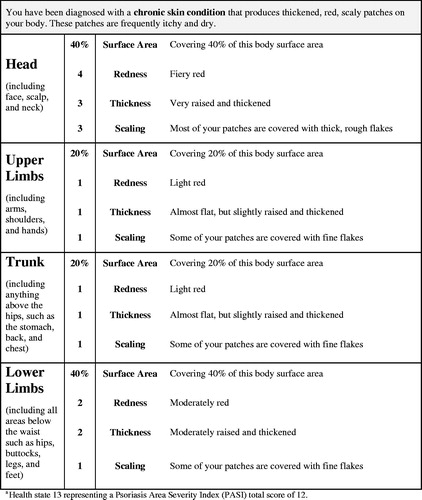
The PASI is a clinician-rated measure of psoriasis severity in four locations: head, upper limbs, trunk, and lower limbsCitation13. For each location, a score is calculated based on psoriasis severity and surface area involvement. The severity score is comprised of three attributes (erythema [redness], induration [thickness], desquamation [scaling]) rated on a scale from 0 (none) to 4 (very severe) and summed for a severity score ranging from 0–12. The surface area score ranges from 0 (0%) to 6 (90–100%). Each of the four body location scores is calculated as the severity sum score multiplied by the surface area score (possible range = 0–72). Each location score is then multiplied by a specific correction score (head = 0.1, upper limbs = 0.2, trunk = 0.3, lower limbs = 0.4), with the adjusted scores summed to produce a total score ranging from 0–72.
Health state development
Studies developing preference-based scoring algorithms for condition-specific measures typically derive health states using psychometric techniques like Rasch analysisCitation4. However, this analytic approach was not appropriate for the PASI because it is not a conventional multi-item questionnaire. Instead, health states were developed for the subsequent utility valuation study based on PASI data from a clinical trial datasetCitation21. The trial data for each patient included the PASI total score as well as the redness, thickness, scaling, and surface area scores for each of the four locations. Then, 40 health states were developed to correspond to the PASI scores of patients from this trial dataset. The 40 patients were selected to represent a wide range of PASI scores (listed in ), while emphasizing the range most commonly observed in a clinical trial (i.e. roughly PASI 10–25). An effort was made to identify some health states with consistent severity across the four locations (e.g. health state 26) and other health states with unbalanced scores (e.g. health state 17, which has a head score that is more severe than the scores of the other three locations). This approach ensured that the 40 health states represented a wide range of psoriasis severity, and each health state corresponded to an actual PASI profile of a patient treated for psoriasis in a clinical trial.
Table 1. Time trade-off utility scores for 40 health states representing PASI severity.
With the input of four dermatologists, health state language was drafted based on the PASI scoring system. Each health state consisted of 16 statements describing the level of redness, thickness, scaling, and surface area coverage within the four locations (see for an example of a health state). An 11 × 17” page with photos (provided by the dermatologists) representing each level of redness, thickness, and scaling was presented along with the health states to ensure that respondents’ TTO decisions were based on a reasonably accurate understanding of psoriasis severity levels.
Figure 1. Example of a health statea.
Participants
Participants in the pilot and valuation studies were required to be at least 18 years old, reside in the UK, and able to understand the interview procedures. Inclusion criteria did not specify clinical characteristics because interviews were intended to lead to a scoring algorithm for estimating utilities for cost-utility analyses in submissions to health technology assessment agencies, which often prefer that utilities represent general population valuesCitation22–24. Participants were recruited via newspaper and online advertisements.
Pilot study
The health states were tested in a pilot study in December 2014 with 19 general population participants in London (29.4% female; mean [SD] age = 36.1 [12.7] years; age range = 19–67). The time horizon used in the TTO method and the number of health states per participant were varied. Participants generally reported that the health states were clear and easy to understand. Some participants suggested minor revisions in formatting, and the health states were edited accordingly. All TTO methods yielded utility scores in a reasonable range with logical discrimination between health states.
Valuation study
The valuation study was conducted in Edinburgh and London in January and February 2015. Participants were required to provide written informed consent before completing study procedures, and all procedures and materials were approved by an independent institutional review board (Ethical & Independent Review Services; Study Number 14145-01).
The 40 health states (listed in ) were categorized into five severity groups ranging from mild (health states 1–8) to severe (health states 33–40). Each participant rated five health states, including one selected randomly from each of the five severity groups. As an introductory task, participants first ranked the health states in order of preference. Then, utilities for each health state were obtained in a TTO task. A 20-year TTO time horizon with 5% trading (1-year) increments was used because it was easy for participants to understand in the pilot study, and this relatively long time horizon is consistent with the chronic nature of psoriasis. Following standard utility assessment methodologyCitation1–3, participants were offered a choice between living 20 years in the health state being rated vs living shorter amounts of time in full health. For each health state, choices were presented in an order that alternated between longer and shorter durations in full health (e.g. 20 years, 0, 19, 1, 18, …). The utility score was calculated based on the choice in which the respondent was indifferent between y years/months in the health state being evaluated and x years/months in full health (followed by dead).
The resulting utility estimate (u) is calculated as u = x/y. Each health state rated as better than dead received a utility score on a scale with the anchors of dead (0) and full health (1). When participants indicated that a health state was worse than dead, respondents were offered a choice between immediate death (alternative 1) and a 20-year life span (alternative 2) beginning with varying amounts of time in the health state being rated, followed by full health for the remainder of the time horizon. For these health states, the current study used a bounded scoring approach (u = −x/t, where x is the time in full health, and t is the total life span of alternative 2), which is commonly used to avoid highly skewed distributions for negative utilitiesCitation25,Citation26.
Regression analyses for modeling health state values
Regression models estimated the relationship between PASI scores and TTO utilities, following an established approachCitation4,Citation18–20,Citation27. First, eight models were run using the PASI total score as the independent variable, followed by a parallel set of models with the four PASI location scores as independent variables.
The eight models began with the (1) ordinary least squares (OLS) linear regression model estimating the best-fitting linear relationship between PASI scores and utility: E(yi) = β0 + β1(xi) where β0 is the intercept, β1 is the coefficient for PASI score xi, and yi is the utility. Subsequent models included: (2) random effects mixed model (accounting for the fact that each respondent provided multiple utilities, which may not be independent of each other); (3) mean model (providing an aggregate level prediction model, equally weighted across the 40 heath states); (4) robust linear regression model (reducing the influence of outliers by down-weighting such data points in the estimation)Citation28; (5) linear spline model (allowing for a bend or “knot” in the data; essentially two connected linear models); (6) robust regression spline model; (7) OLS model with a quadratic term (allowing for a non-linear relationship between PASI and utility); and (8) robust model with a quadratic term. Models were evaluated and compared based on indices of model fit (R2, adjusted R2), accuracy of estimation (mean absolute error [MAE], frequency of large absolute prediction errors), plots of the mean residuals for each model, and line graphs depicting the relationship between PASI and utility.
Results
Valuation survey: respondent characteristics
A total of 285 potential participants (157 London; 128 Edinburgh) were scheduled for interviews, and 257 (139 London; 118 Edinburgh) attended and completed their interviews. Nine of the 257 participants (five London; four Edinburgh) were either unable to complete the utility interview procedures (seven who had difficulty understanding the TTO task and/or the health state content) or were found to be ineligible during the interview process (one with cognitive impairment and one with a psychiatric disorder that interfered with their ability to complete the study procedures). Thus, a total of 248 valid utility interviews were conducted (134 London; 114 Edinburgh). Three participants who provided negative (i.e. worse than dead) utilities for all five health states were excluded from analyses. Therefore, the analysis sample includes 245 respondents (131 London; 114 Edinburgh). The sample was 51.4% female (n = 126), with a mean age of 45.3 years. The most commonly reported ethnic/racial backgrounds were White (74.3%), Black (9.4%), and Asian (9.0%). Self-reported marital status included single (51.0%), married/living with a partner (36.7%), divorced (8.6%), and widowed (2.4%). Most participants reported being employed (35.1% full-time and 30.6% part-time). A little under half of the sample had completed a university degree (33.9%) or a postgraduate degree (13.1%). The most commonly reported health conditions were depression (19.2%), anxiety (14.7%), hypertension (9.0%), arthritis (8.2%), and diabetes (7.8%).
TTO utility values
Each health state received at least 29 valuations. As expected, health states representing higher total PASI scores (i.e. greater psoriasis severity) tended to have lower mean utilities (). Some health state utilities deviated from the expected order based on total PASI score, likely due to the influence of the PASI location (e.g. head vs upper limb) on respondent preferences. For example, the utility score for health state 17 (mean utility = 0.77; total PASI = 14.4; head = 32) was lower than the utility of health state 22 (mean utility = 0.80; total PASI = 18.4; head = 0).
A series of t-tests compared mean utilities across sub-groups, finding minimal differences. There were no significant differences between men and women. Of the 40 health states, there was a statistically significant age difference (median split: older vs younger) for only one health state (health state 13; p = 0.01). Comparisons between the London and Edinburgh sub-groups found significant differences for only three of the 40 health states (health states 3, 17, and 27; p < 0.05). Comparisons between participants who worked full-time or part-time (n = 161) vs those who did not (n = 84) also found significant differences for only three of the 40 health states (health states 6, 16, and 26; p < 0.05). Similarly, comparisons between participants who were married or living with a partner (n = 90) vs the other participants (n = 155) found significant differences for only four of the 40 health states (health states 10, 26, 27, and 39; p < 0.05). Comparisons between participants with a university degree or higher (n = 115) vs those who did not have a university degree (n = 130) found significant differences for four of the 40 health states (health states 3, 7, 23, and 34; p < 0.05). When differences were observed, they were not in a consistent direction (i.e. no group had consistently higher or lower scores than the comparison group). Furthermore, with an adjustment for multiple comparisons (e.g. a Bonferroni correction), none of these differences would be considered statistically significant. Overall, these comparisons suggest that demographic variables did not have a meaningful or consistent impact on utility scores.
Regression modeling based on the PASI total score
Generally, model fit and accuracy are similar across the regression models based on the PASI total score, although some differences emerged (, ). There is minimal difference among the parameter estimates of the first three models (OLS linear model, the random effects model, and the mean model) among all truly comparable statistics. Although R2 for the mean model (0.7847) is substantially higher, this cannot be compared to any other model because this model does not assess the same data points.
Figure 2. Utility curves predicted by regression models estimating utility based on the PASI total score.
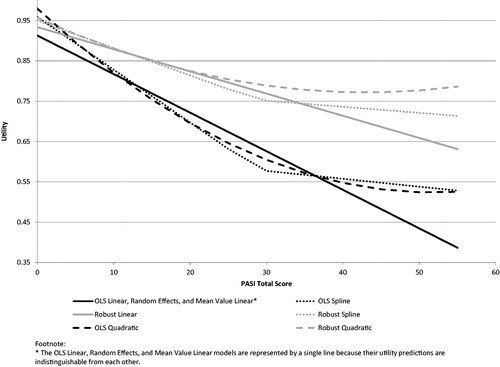
Table 2. Regression models estimating utility based on the PASI total score: model coefficients and performance statistics.
The robust models, which minimize the influence of outliers and high leverage points, yield results that are notably different from their OLS model counterparts. The robust models have higher intercepts and less steep slopes, resulting in higher utility scores, particularly in the more severe part of the PASI score range. Fit/accuracy statistics are not directly comparable between robust and OLS models (e.g. R2 is not assessing the same data variance).
The two types of non-linear models (spline and quadratic) offer some improvement in model fit/accuracy over corresponding linear models. Model differences are highlighted by the predicted plots (). The two non-linear models are similar in terms of utility estimates, fit, and accuracy. The spline model is preferred over the quadratic for two reasons. The spline performed slightly better than the quadratic (e.g. R2, MAE, frequency of absolute errors), and perhaps more importantly, its linear trends are either descending or flat. In contrast, the quadratic curves upward for PASI scores over 51.9 for the OLS quadratic and 43.0 for the robust quadratic (), which could lead to nonsensical utility estimates among patients with severe psoriasis.
Regression modeling based on the four PASI location scores
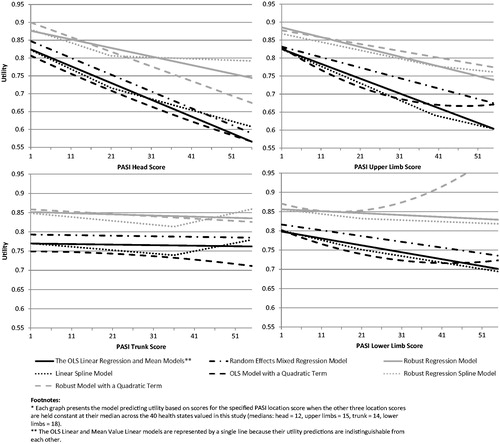
Results of models with the four PASI location scores followed the same general patterns as the models described above using the PASI total score. However, running the models using the four PASI location scores resulted in small but consistent improvements in model fit/accuracy over the PASI total score, including increased R2 as well as reduced MAE and frequency of absolute errors. Parameter estimates indicate that head and upper limb scores were more strongly associated with utility than trunk and lower limb ().
Table 3. Regression models estimating utility based on the four PASI location scores: model coefficients and performance statistics.
For the spline and quadratic model, however, the same problem emerged as described above for the total score quadratic model. These models yielded utilities that begin to increase, rather than continuing to decrease, in the far upper range of PASI scores that represent greatest psoriasis severity. This pattern, which results in illogical utility scores for the most severe health states, occurred with the trunk and lower limb scores in the quadratic, as well as the trunk in the spline model ().
Figure 3. Marginal* utility curves predicted by regression models estimating utility based on the four PASI location scores.
Discussion
Given that the four body locations clearly differed in terms of impact on preference, it is recommended that a model with the four PASI location scores as independent variables be used to estimate utilities based on the PASI. The models predicting utility based on the four PASI location scores generally had better fit/accuracy than models using the PASI total score. Among the models using the four location scores, none offered notable improvement over the simple linear model. Therefore, the OLS linear model based on the four PASI location scores is recommended as the primary algorithm for deriving utilities from PASI scores (see scoring algorithm in ).
Table 4. Recommended models for deriving utilities from PASI scores.
In situations where the four PASI location scores are not available, it would be reasonable to use a scoring algorithm based on the PASI total score. Among the models based on the total score, the spline model with a knot at 29 offers the best model fit and accuracy. Therefore, this model is recommended for use when it is necessary to derive utilities from the PASI total score (see scoring algorithm in ).
It was concluded that the robust models would not be recommended for future use. When evaluating these models, one must determine the extent to which outliers can be disregarded. Utility valuation studies, including the current study, typically elicit a wide range of values for each health state, with substantial heterogeneity and outliers. Because outliers such as negative scores and scores at the ceiling are a common and expected part of the utility valuation process, it is difficult to determine cut points at which these data points should be disregarded. Therefore, the robust models that largely disregard these values were ultimately not considered optimal for this scoring algorithm. Models that could lead to illogical relationships among utilities for individuals with severe psoriasis are also not recommended for future use (i.e. all quadratic models and the spline model using the four PASI location scores).
When deciding whether to derive utilities with a condition-specific preference-based (CSPB) approach, such as the scoring algorithm provided in the current study, advantages and disadvantages should be considered. CSPB measures are generally thought to be more sensitive to disease severity and treatment-related change than generic utility measures such as the EQ-5DCitation4. However, CSPB measures sacrifice some comparability across diseases, studies, and cost-utility models, whereas utilities derived from generic measures have the advantage of maximizing comparabilityCitation4,Citation29. Despite this limitation, there are situations when CSPB measures are the best available option for deriving utilities, such as when generic instruments do not assess content relevant to a particular disease. Psoriasis may present such a situation because the commonly used generic instruments do not assess dermatological symptoms or their impact. Other recent research has addressed this challenge by adding psoriasis-specific dimensions to the EQ-5D to improve sensitivity to skin clarity, particularly at the highest PASI levelsCitation7. Future research could examine the relationship between utilities based on the EQ-5D with added dimensions and utilities from the PASI using the algorithm derived in the current study.
Findings from the models using the four PASI location scores could have important implications for scoring and interpretation of PASI results in clinical trials. In the regression model results, the parameter estimates and statistical significance levels indicate that psoriasis of the head had the strongest impact on health state preference, followed by the upper limbs, while the trunk and lower limbs had a much weaker association with utility. In addition to the statistical results, this difference among the four body locations is apparent from visual inspection of the lines/curves in . The importance of head/upper limb psoriasis was also evident during the interviews. Many respondents explained their preferences by reporting that skin patches of the head and upper limbs would be most troubling because these locations are most visible and least likely to be covered by clothes.
In contrast to current results highlighting the importance of the head and upper limbs, the standard PASI scoring algorithm is more heavily weighted toward psoriasis of the lower limbs and trunk. Therefore, the standard PASI scoring may not optimally represent the impact of psoriasis. This finding should be interpreted with caution because the current preference values were derived from a general population sample. It is not known whether patients would agree that psoriasis of the head and upper limbs is most important. Therefore, it would be useful to replicate this preference task with a patient sample. If results from patients were similarly weighted toward the head and upper limbs, this finding would suggest re-evaluating the standard scoring approach of the PASI so that scores would better represent the impact of psoriasis.
A limitation of the proposed scoring algorithm is that utility is derived only from the four visible aspects of psoriasis assessed by the PASI, rather than the patient’s broader experience of psoriasis. Symptoms such as pain and itching are not represented. While these symptoms likely co-occur with the visible signs captured by the PASI to some extent, it is possible that utilities derived from the PASI may not be entirely consistent with the patients’ experience of psoriasis. To address this potential limitation, future research could examine validity of the proposed utility scoring algorithm by comparing the resulting utility scores to scores in instruments designed to assess patients’ experience of psoriasis. For example, with a dataset that includes both the PASI and DLQI, it would be possible to run correlations between PASI-based utilities and the DLQI scores, which represent the quality-of-life impact associated with dermatological conditions. This analysis would provide an indication of the extent to which the proposed utility scoring algorithm is consistent with the patient’s overall experience of psoriasis and its impact.
In sum, the current study provides a new method for obtaining utilities corresponding to a wide range of psoriasis severity. With the scoring algorithm provided in this study, utilities can be derived from any treatment group or patient sample whose psoriasis was rated with the PASI. Because the PASI is commonly used in clinical trials, the recommended scoring algorithm greatly expands options for quantifying outcomes in cost-effectiveness analyses, facilitating more accurate modeling to inform resource allocation decisions.
Transparency
Declaration of funding
This study and the resulting manuscript were funded by Amgen (Thousand Oaks, CA).
Declaration of financial/other relationships
Three of the authors were employed by Amgen at the time this study was initiated (Mutebi, Pinto, Viswanathan). Five of the authors were employed by Evidera, an independent company that received funding from Amgen for time spent conducting this study (Bender, Jordan, Kim, Matza, Stewart). The other authors received funding for time spent on this research (Brazier, Kircik, Menter). All aspects of the study design, interpretation, and decision to submit for publication were determined by the authors. A peer reviewer on this manuscript has disclosed the receipt of grants/research supports for participation in clinical trials (paid to their institution) from Abbvie, Almirall, Amgen, Boehringer Ingelheim, Janssen, Leo-Pharma, Eli Lilly, Novo Novartis, Pfizer, Regeneron, Roche, Sanofi, and UCB Pharma. The same reviewer discloses receipt of honoraria or consultation fees (paid to themself) from Abbvie, Almirall, Amgen, Baxalta, Biogen, Boehringer Ingelheim, Celgene, Gebro, Janssen, Leo-Pharma, Eli Lilly, Merck-Serono, MSD, Mylan, Novo Novartis, Pfizer, Regeneron, Roche, Sandoz, Samsung-Bioepis, Sanofi, and UCB Pharma. The same reviewer discloses participation in a company sponsored speaker’s bureau for Celgene, Janssen, Eli Lilly, MSD, Novo Novartis, and Pfizer. A separate reviewer on this manuscript has disclosed serving as an investigator for AbbVie, Boehringer Ingelheim, Eli Lilly, Janssen-Cilag, Merck, Novo Novartis, Pfizer, and UCB Pharma; participating in a clinical trial supported by Array Biopharma and MSD; being a member of advisory boards of Eli Lilly, LEO Pharma, MSD, Novo Novartis, Pfizer, and UCB Pharma; obtaining honoraria from ALK-Abello, AbbVie, Biotest, BMS, Janssen-Cilag, MSD, Novo Novartis, Pfizer, Dr. Pfleger GmbH, and Roche; and receiving support for conferences from AbbVie, Actelion, ALK-Abello, Alma Lasers, Almirall, ARC Lasers, Asclepion, BMS, Celgene, Dermapharm, Dermasence, Galderma, GSK, Janssen-Cilag, L’Oreal, La Roche Posay, LEO Pharma, Medac, MSD, Novo Novartis, Pierre Fabre, P&M Cosmetics, Pfizer, and Roche. The peer reviewers on this manuscript have no other relevant financial relationships or otherwise to disclose.
Ethics compliance
All authors followed the ICMJE requirements on privacy and informed consent from study participants. Participants were required to provide written informed consent before completing study procedures, and all procedures and materials were approved by an independent institutional review board (Ethical & Independent Review Services; Study Number 14145-01).
Acknowledgements
The authors would like to thank Zaneta Balantac, Evan Davies, Katie Gries, David Hengerer, Michael Iacobelli, Amanda Landrian, Amara Tiebout, and Erica Zaiser for assistance with data collection; Dennis Revicki for consulting on the study design; Christine Thompson for statistical programming; and Amara Tiebout for editorial assistance.
References
- Brazier JR, Ratcliffe J, Salomon JA, et al. Measuring and valuing health benefits for economic evaluation. New York, NY: Oxford University Press; 2007.
- Feeny D. Preference-based measures: utility and quality-adjusted life years. In: Fayers P, Hays R, editors. Assessing quality of life in clinical trials. 2nd ed. New York, NY: Oxford University Press; 2005. p. 405–431.
- Torrance GW. Measurement of health state utilities for economic appraisal. J Health Econ. 1986;5:1–30.
- Brazier JE, Rowen D, Mavranezouli I, et al. Developing and testing methods for deriving preference-based measures of health from condition-specific measures (and other patient-based measures of outcome). Health Technol Assess. 2012;16:1–114.
- Yang Y, Brazier J, Longworth L. EQ-5D in skin conditions: an assessment of validity and responsiveness. Eur J Health Econ. 2015;16:927–939.
- Pereira FR, Basra MK, Finlay AY, et al. The role of the EQ-5D in the economic evaluation of dermatological conditions and therapies. Dermatology. 2012;225:45–53.
- Pickard AS, Gooderham M, Hartz S, et al. EQ-5D health utilities: exploring ways to improve upon responsiveness in psoriasis. J Med Econ. 2017;20:19–27.
- Swinburn P, Lloyd A, Boye KS, et al. Development of a disease-specific version of the EQ-5D-5L for use in patients suffering from psoriasis: lessons learned from a feasibility study in the UK. Value Health. 2013;16:1156–1162.
- Lebwohl M. Psoriasis. Lancet. 2003;361:1197–1204.
- Blome C, Beikert FC, Rustenbach SJ, et al. Mapping DLQI on EQ-5D in psoriasis: transformation of skin-specific health-related quality of life into utilities. Arch Dermatol Res. 2013;305:197–204.
- Finlay AY, Khan GK. Dermatology Life Quality Index (DLQI)-a simple practical measure for routine clinical use. Clin Exp Dermatol. 1994;19:210–216.
- Feldman SR, Krueger GG. Psoriasis assessment tools in clinical trials. Ann Rheum Dis. 2005;64: ii65–ii68.
- Fredriksson T, Pettersson U. Severe psoriasis-oral therapy with a new retinoid. Dermatologica. 1978;157:238–244.
- Gaspari AA, Tyring SK. Commonly applied clinical trial endpoints for psoriasis and PsA. Clinical and basic immunodermatology. London, UK: Springer; 2008. p. 526.
- Navarini AA, Poulin Y, Menter A, et al. Analysis of body regions and components of PASI scores during adalimumab or methotrexate treatment for patients with moderate-to-severe psoriasis. J Drugs Dermatol. 2014;13:554–562.
- Spuls PI, Lecluse LL, Poulsen ML, et al. How good are clinical severity and outcome measures for psoriasis?: quantitative evaluation in a systematic review. J Invest Dermatol. 2010;130:933–943.
- Mavranezouli I, Brazier JE, Rowen D, et al. Estimating a preference-based index from the Clinical Outcomes in Routine Evaluation-Outcome Measure (CORE-OM): valuation of CORE-6D. Med Decis Making. 2013;33:381–395.
- Rentz AM, Kowalski JW, Walt JG, et al. Development of a preference-based index from the National Eye Institute Visual Function Questionnaire-25. JAMA Ophthalmol. 2014;132:310.
- Yang Y, Brazier J, Tsuchiya A, et al. Estimating a preference-based single index from the Overactive Bladder Questionnaire. Value Health. 2009;12:159–166.
- Yang Y, Brazier JE, Tsuchiya A, et al. Estimating a preference-based index for a 5-dimensional health state classification for asthma derived from the asthma quality of life questionnaire. Med Decis Making. 2011;31:281–291.
- Papp KA, Leonardi C, Menter A, et al. Brodalumab, an anti-interleukin-17-receptor antibody for psoriasis. N Engl J Med. 2012;366:1181–1189.
- CADTH (Canadian Agency for Drugs and Technologies in Health). Guidelines for the economic evaluation of health technologies: Canada. 3rd ed. Ottawa, Canada: Canadian Agency for Drugs and Technologies in Health; 2006.
- NICE (National Institute for Health and Care Excellence). Process and methods guides: Guide to the methods of technology appraisal 2013. London, UK: NICE; 2013.
- PBAC (Pharmaceutical Benefits Advisory Committee). Guidelines for preparing submissions to PBAC, Version 4.4. Canberra, Australia: Australian Government Department of Health, PBAC; 2013. p. 344.
- Matza LS, Sapra SJ, Dillon JF, et al. Health state utilities associated with attributes of treatments for hepatitis C. Eur J Health Econ. 2015;16:1005–1018.
- Rowen D, Brazier J. Health utility measurement. In: Glied S, Smith P, editors. The Oxford Handbook of Health Economics. New York: Oxford University Press; 2011. p. 788–813.
- Brazier J, Czoski-Murray C, Roberts J, et al. Estimation of a preference-based index from a condition-specific measure: the King's Health Questionnaire. Med Decis Making. 2008;28:113–126.
- Ryan TP. Modern regression methods. 2nd ed. Hoboken, NJ: John Wiley & Sons, Inc.; 2009.
- Versteegh MM, Leunis A, Uyl-de Groot CA, et al. Condition-specific preference-based measures: benefit or burden? Value Health. 2012;15:504–513.