
Abstract
Background: The potential impact of disease management to optimize quality of care, health outcomes, and total healthcare costs across a range of cardiac disease states is unknown.
Methods: A trial-based cost-utility analysis was conducted alongside a randomized controlled trial of 335 patients with chronic, non-valvular AF (without heart failure; the SAFETY Trial) discharged to home from three tertiary referral hospitals in Australia. A home-based disease management intervention (the SAFETY intervention) that involved community-based AF care including home visits was compared to routine primary healthcare and hospital outpatient follow-up (standard management). Bootstrapped incremental cost-utility ratios were computed based on quality-adjusted life-years (QALYs) and total healthcare costs. Cost-effectiveness acceptability curves were constructed to explore the probability of the SAFETY intervention being cost-effective. Sub-group analyses were performed based on age and sex to determine differential cost-effectiveness.
Results: During median follow-up of 1.75 years, the SAFETY intervention was associated with a non-statistically significant increase in QALYs (0.02 per person) and lower total healthcare costs (–$4,375 per person). Although each of these findings were not statistically significant, the SAFETY intervention was found to be dominant (more effective and cost saving) in 58.8% of the bootstrapped iterations and cost-effective (more effective and gains in QALYs achieved at or below $50,000 per QALY gained) in 61.5% of the iterations. Males and those aged less than 78 years achieved greater gains in QALYs and savings in healthcare costs. The estimated value of perfect information in Australia (the monetized value of removing uncertainty in the cost-effectiveness results) was A$51 million, thus demonstrating the high potential gain from further research.
Conclusions: Compared with standard management, the SAFETY intervention is potentially a dominant strategy for those with chronic, non-valvular AF. However, there would be substantial value in reducing the uncertainty in these estimates from further research.
Trial registration: Australian New Zealand Clinical Trials Registry identifier: ACTRN12610000221055.
Introduction
As part of a global trend towards more chronic diseaseCitation1–3, cardiovascular disease (CVD) remains the number one reason for death and disability in most developed and developing countriesCitation4. Atrial fibrillation (AF) is the most common arrhythmia observed in clinical practiceCitation5. Its prevalence in the general population in developed countries is documented as between 2% and 3%Citation6. In Europe and North America, the rate of hospitalization for AF has seen a 2–3-fold increase in recent timesCitation7. It is expected that AF would affect up to 12 million Americans by 2050. Similarly, the number of AF-related hospitalizations in Australia had tripled from 1993 to 2007Citation8.
AF causes a wide variety of debilitating symptoms and is also associated with a 5-fold increased risk of thrombo-embolic stroke, a 2–3-fold increased risk of heart failure, and a 2-fold increased risk of all-cause mortalityCitation9. Currently, two major therapeutic approaches are available: restoring and maintaining sinus rhythm and/or control of ventricular rate; and anticoagulation to prevent embolism. It is apparent that these two treatment strategies are equivocal, mainly due to the absence of an efficacious single therapeutic regimenCitation10. Evidence-based management priorities of AF include treating underlying cardiovascular conditions, use of oral anticoagulants, reducing bleeding risk factors, and rate control medicationsCitation11. For AF related symptoms it is recommended to adjust rate control therapy, and perform cardioversion, or catheter/surgical ablation. The new European Society of Cardiology guidelines also caution against permanently discounting oral anticoagulants as it would increase the risk of strokeCitation11. Without definitive strategies to prevent AF and prevent it’s common clinical sequalae and given progressively ageing populations, the cost burden of AF to the health system will continue to increaseCitation12,Citation13.
Disease management programs encompass a range of activities designed to mitigate the progression and impacts of health conditionsCitation14. These are widely popularized for their potential benefits in the face of a significant and growing needCitation15–17. Multi-disciplinary disease management programmes in CVD have been proven cost-effective in improving patient health outcomes. Nurse-led disease management programmes, and especially home-based disease management programmes, have been routinely proven effective and cost-effective strategies to improve health outcomes and costs in heart failure and AFCitation18,Citation19. The clinical efficacy of a nurse-led AF management strategy compared to standard management, the Standard vs atrial fibrillation-specific management strategy (SAFETY) Trial, was publishedCitation20. SAFETY was the first randomized trial to prospectively test the hypothesis that an AF-specific management programme was superior to standard management at prolonging survival and reducing recurrent hospital admission in patients with forms of paroxysmal persistent and permanent AF in the absence of underlying heart failure. The current analysis was conducted to ascertain the cost-effectiveness of the SAFETY AF management strategy.
Methods
Trial design and participants
The SAFETY Trial was a multi-centre, randomized controlled trial with blinded endpoint analysis registered with the Australian New Zealand Clinical Trials Registry (ANZCTRN 12610000221055). SAFETY was CONSORT compliant, and outcomes were reported appropriately for a pragmatic trial comparing the efficacy of two non-pharmacological health interventionsCitation21. Written informed consent was obtained from study participants prior to study procedures being conducted and ethics approval was obtained from the relevant Committees associated with the participating institutions (Central Northern Adelaide Health Service (2010008), Melbourne Health (2010.268), and ACT Government Health (12.014)).
Details of the SAFETY Trial rationale and design have been reported previouslyCitation20,Citation22. Briefly, 335 inpatients (52% male, mean age 72 years, 39% living alone) from three tertiary referral hospitals in Australia (in Adelaide, Melbourne, and Canberra) with a diagnosis of paroxysmal persistent and permanent forms of non-valvular AF were randomly assigned into the study. Participants were randomized to receive either standard post-discharge management or an AF-specific nurse-led, home-based management strategy involving comprehensive health assessment, risk delineation, individualized care, and annual clinic visits. The co-primary outcomes were all-cause death or unplanned re-hospitalization due to any reason.
Data analysis
Analyses were conducted in Stata v.13.0Citation23. Costs and outcomes were both discounted at 5% as per Australian health technology and decision-making bodies, including the Pharmaceutical Benefits Advisory CommitteeCitation24 and Medical Services Advisory CommitteeCitation25 requirements. The analysis was conducted from the perspective of the Australian public healthcare system. As such, patients out of pocket, travel time, or carer costs were not included. This perspective was adopted to reflect the perspective of the investment and decision-maker. The time horizon of analysis was 2 years (from baseline to 24-month follow-up) in line with the trial. The base case analysis used the Intention-to-treat population with the assumption that missing data were missing-at-random.
Resource utilization
The resource use over the trial duration was extracted from the participating hospitals (i.e. hospitalization episodes, length of stay) and records of individuals’ reimbursement histories regarding Medicare Benefits Schedule (MBS) and Pharmaceutical Benefits Scheme were provided by the Department of Human Services, Australia. The Pharmaceutical Benefits Schedule and the Medicare Benefits Schedule are government-subsidized schemes for medications and medical services for all Australian citizens. The Pharmaceutical Benefits Schedule subsidizes more than 9,023 medications, and MBS lists seven broad categories of medical services including outpatient consultations, diagnostic procedures and investigations, therapeutic procedures, diagnostic imaging, etc. All the medications dispensed (i.e. Pharmaceutical Benefits Schedule item code, dosage, and Anatomical Therapeutic Chemical [ATC] classification) and medical services utilized (i.e. Medicare item number, service type, and description of the service), including the correspondent benefit paid, were supplied with consent from each individual patient.
Costs
Costs included in this analysis were costs for health service use, including: hospitalization episodes, outpatient specialist and general practitioner (primary care physician) attendances, and prescription medications reimbursed by the government. The cost of hospitalizations was estimated based on the National Efficient PriceCitation26; the cost of health services and attendances were sourced from the Medicare Benefits ScheduleCitation27, and prescription medications were sourced from the Pharmaceutical Benefits Schedule data directlyCitation28. The National Efficient Price reports the national price the government will pay (prospectively) for admissions and procedures in public hospitals, with adjustment factors for length of stay (including excessively long or short stays) and days in intensive care. Regression analysis of the total (discounted) cost per patient as the dependent variable was conducted using a generalized linear model with trial group allocation (SAFETY intervention or standard management) as the predictive variable and controlling for exposure (i.e. the individual’s follow-up period). A gamma family, log-link model was assumed given the typically skewed nature of healthcost data. The gamma family and log link specification of the regression model were tested using the modified Parks test and link test, respectively. Age and sex were included as covariates along with their respective interaction with treatment group to identify potential demographic sub-population differences. Costs are reported in Australian dollars (A$) and were adjusted to 2015 dollar values using the health price indexCitation29 (in June 2015: A$1 ≈ £0.49 ≈ US$0.77). Only cost data up until the 24-month follow-up (or date of censoring due to death) was included in this analysis to be consistent with the period for which health outcomes were assessed.
The costs per person of the intervention and standard management groups were estimated based on the number of clinic visits, home visits, and telephone contacts. Clinic visits (independent of usual outpatient specialist visits) were costed based on 1 h of nurse time. Home contacts were costed based on nurse time during the visit (1.5 h for the first visit and 1 h for each subsequent visit) and time spent travelling (based on distance from clinic to patient’s home, assuming an average traveling speed of 60 km/h). Travel costs for home visits were estimated based on the distance from the clinic to the patient’s home multiplied by the Australian Taxation Office estimate of the vehicle running costs per kilometre. Phone contacts were costed based on the duration of each telephone contact with a nurse.
Outcomes
Quality Adjusted Life Years (QALYs) were estimated based on completion of EuroQol–Five Dimension Three Level (EQ-5D-3L) QuestionnairesCitation30 sequentially at baseline, 12-month, and 24-month follow-up. The EQ-5D-3L is a widely used generic health-related quality-of-life instrument with five dimensions (mobility, self-care, usual activities, pain/discomfort, and anxiety/depression), and three self-rated response levels of severity (e.g. no problem, some problem, major problem) for each dimension. Australian EQ-5D-3L weights (i.e. preference-based valuations derived from a general population) were applied to estimate utility values at each of these time pointsCitation31. Those who died were allocated a utility value of 0 from the time of death, and those with missing data were excluded from the base case analysis. Within-trial QALYs were calculated using area under the curve estimated by integral calculation for each of the two follow-up periods. Linear regression analysis of individual (discounted) QALYs was used to estimate the effect of receiving the intervention compared with standard management. Participants’ age and sex were included as covariates along with their respective interactions with treatment group to identify potential sub-population differences.
Incremental cost utility ratio, incremental net monetary benefit, and value of perfect information
The incremental cost-utility ratio (ICUR) was estimated as the costs for the intervention group minus the costs for the standard management group divided by the QALYs of the intervention group minus the QALYs of the standard management group. The ICUR was compared to a willingness-to-pay (WTP) per QALY gained of $50,000, a commonly accepted value for health technology assessment in AustraliaCitation19. Where the cost per QALY (i.e. the ICUR) is below the WTP threshold (here, A$50,000), the intervention can be considered cost-effective, or “acceptable value for money”. The incremental net monetary benefit (INMB) is the incremental QALYs multiplied by the WTP minus the incremental costs of the intervention group compared to the standard management group. Regression analysis was used to estimate the INMB with bootstrap estimates of the standard errors. Participants’ age and sex were included as covariates along with their respective interactions with treatment group to identify potential sub-population differences.
The quasi 95% confidence interval (CI) for the ICUR and INMB was estimated using bootstrapping (i.e. the 95% credible interval) with the ICUR presented graphically on the cost-effectiveness plane. Further, the following deterministic sensitivity analyses were conducted: removing discounting of costs and benefits and using Diagnostic-related Group (DRG) cost weightsCitation32 (and inflated using health inflatorCitation29) as opposed to the National Efficient Price estimates for hospitalization costs. DRG costs are the actual costs and calculated retrospectively, opposed to the National Efficient Price, which is calculated prospectively for pricing and contracting hospital services.
The uncertainty in the results is further explored using value of information techniques to estimate the expected value of perfect information (EVPI). The EVPI represents a theoretical maximum value from future research that would eliminate all measured uncertainty included in this analysis. The EVPI (per person) is estimated as the difference between adopting the intervention with the greatest mean net monetary benefit (QALYs multiplied by the willingness-to-pay per QALY threshold less costs) and the net monetary benefit of the proposed intervention over all iterations (in this case each bootstrapped estimate). The total EVPI is then estimated by multiplying the per person EVPI by the estimated number of incident AF hospital admissions (35,000 in Australia per annumCitation33,Citation34) and the useful life of the new technology (in this case the assumed number of years the AF disease management programme was likely to be standard practice, 4 years) with the value that accrues in future years discounted at 5%. Analysis of missing data (i.e. missing data imputation) was undertaken to examine the robustness of base case analysis (Supplementary Appendix 2).
Results
Resource utilization
Over a median of 1.75 years of follow-up, there were 676 and 735 hospitalization episodes, represented by 141 and 150 patients in the SAFETY intervention and standard management groups, respectively. Only 26 (16.1%) and 17 (10.2%) from the two groups did not have any hospitalization during the follow-up, while the majority (61.9 vs 60.5%) of participants experienced up to five hospitalizations over the same period (Supplementary Appendix 1). There were similar numbers of outpatient consultations (39 vs 38 for primary care physician visit and 9 vs 11 for specialist visit), electrocardiograph (ECG) examinations (5 in both groups), prothrombin tests (29 vs 26), and ablation (4 vs 3) between the SAFETY intervention and standard management groups. In terms of medication use, drugs that acted on the cardiac system (determined by ATC code) constituted 45% (SAFETY intervention) or 44% (standard management) of all the prescriptions. Cardio-active therapy (i.e. cardiac glycosides, antiarrhythmics, cardiac stimulants, vasodilators, etc.), angiotensin II receptor blocker/ACE inhibitors (ARB/ACEI), and lipid lowering agents were among the three mostly dispensed medications ().
Table 1. Details of resource utilization and cost components.
The cost per patient for the SAFETY intervention was $738, compared to $150 for standard management (). The predicted mean healthcare costs per person was $4,375 less for the SAFETY intervention compared to standard management (), although this difference was not statistically significant (95% CI = –$19,585 to $10,835). The reduction in healthcare costs was greater for males (–$6,425; 95% CI = –$29,042 to $18,769) and for those aged less than 78 years (≤66 years = –$6,622; 95% CI = –$26,163 to $12,919; 67–77 years = –$21,865; 95% CI = –$48,172 to $4,442).
Table 2. Intervention costs.
Table 3. Incremental costs, QALYs, cost-effectiveness ratio.
The SAFETY intervention was associated with an increase in predicted mean QALYs of 0.017 compared to standard management (), although this difference was not statistically significant (95% CI = –0.100 to 0.134). The increase in QALYs was greater for males (0.069; 95% CI = −0.095 to 0.234) and for those aged less than 78 years (≤66 years = 0.108; 95% CI = –0.103 to 0.318; 67–77 years = 0.08; 95% CI = –0.123 to 0.282).
When the incremental costs and QALYs are combined in the ICUR, the SAFETY intervention is described as dominant compared to standard management. That is, it is more effective and less costly. This is the same for males and those aged less than 78 years. Conversely, for females and those aged 78 years or above, the SAFETY intervention reduced QALYs and increased cost compared with standard management. The incremental net monetary benefit of the SAFETY intervention is $9,036 per person for the overall trial population; $9,851 and $8,513 for males and females, respectively; and $17,252, $22,927, –$12,170 for those aged ≤66, 67–77, and ≥78, respectively.
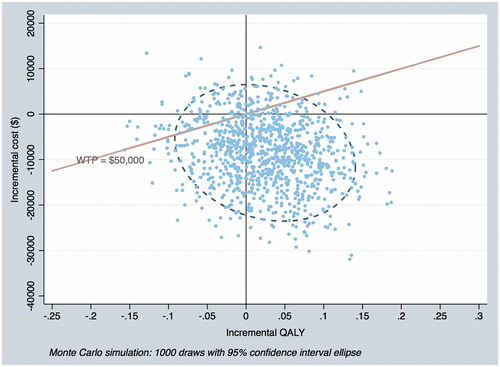
Based on the bootstrap results for the overall population (), the SAFETY intervention led to an increase in QALYs in 65.5% of the iterations, with the intervention being dominant (greater QALYs and cost saving – bottom right quadrant) in 58.8% of the iterations and cost-effective (top right quadrant and below WTP threshold of $50,000 plus bottom right quadrant) in 61.5% of the iterations. In 4% of iterations, the SAFETY intervention was considered not cost-effective (top right quadrant and above WTP threshold). Finally, in 5.6% of iterations the SAFETY intervention was dominated by standard management (i.e. standard management was associated with increased QALYs and lower costs compared to the SAFETY intervention – top left quadrant).
Figure 1. Incremental cost-effectiveness plane.
Based on the one-way sensitivity analyses, the application of discounting only had a marginal impact on the cost-effectiveness results. Whilst using DRG costs as opposed to national efficient prices dramatically reduced the absolute estimate of healthcare costs, the incremental cost difference between the two groups remained relatively consistent ().
Table 4. Deterministic sensitivity analyses.
The uncertainty of the results was valued in monetary terms using value of perfect information techniques. The total value of perfect information regarding the SAFETY intervention is estimated as $50,639,794. The missing data imputation around EQ-5D-3L utility at three time points (baseline, 12, and 24 months) supported a non-significant between-group difference in QALYs (Supplementary Appendix 2).
Discussion
The results of this analysis show that, over the trial period, an AF-specific, home-based disease management programme compared to standard management was associated with non-statistically significantly reduced healthcare costs and better health outcomes measured as QALYs. The SAFETY intervention was found to be dominant (more effective and cost saving) in 58.8% of the bootstrapped iterations and cost-effective (more effective and gains in QALYs achieved at or below $50,000 per gain in QALY) in 61.5% of the iterations. The incremental net monetary benefit achieved from adopting the intervention was $9,036 per person (∼US$6,958). If implemented across Australia this would result in a net gain of $316 million dollars a year or $1.1 billion over 4 years (discounted at 5%). The estimated value of perfect information is $51 million, which demonstrates the high potential gain from further research to reduce the uncertainty in the calculated results. Whilst this is likely to be greater than the cost of undertaking further research, and therefore more research could be justified; delaying the implementation of the SAFETY intervention will also delay the potential benefits this intervention could produce. Consequently, whilst the uncertainty of the estimates is significant and warrants further research, the opportunity cost of not implementing could justify immediate implementation.
In our sub-group analyses, the benefit of the SAFETY intervention (both improved QALYs and reduced healthcare costs) was greater among males and those who are less than 78 years of age. The study population included both those diagnosed with AF at index hospitalization as well as those who had been previously diagnosed with AF (mean 7.6 years prior to index hospitalization). As such, we explored this further in additional analyses, however we found that prior diagnosis or time since diagnosis had no statistically significant effect on either QALYs or healthcare costs.
The results of this analysis are consistent with a similar cost-effectiveness analysis of a nurse-led disease management programme for patients with atrial fibrillationCitation35. Although the prior study was for a younger population, both interventions are considered dominant strategies to standard management, although the present analysis reports slightly less incremental QALY gains and slightly greater cost savings from the intervention compared to standard management. Moreover, the results are broadly consistent with a systematic review of trial based economic evaluations of heart failure disease management programmes that found 51% were dominant when compared to standard managementCitation18. Importantly, and similar to the conclusions of that meta-analysis, the results of this disease management programme to achieve long-term outcomes warrants further consideration. For example, a generic disease management programme for patients with AF was associated with a statistically significant reduction of 27% in unplanned hospital re-admissionsCitation36. However, this was achieved over a median follow-up period of 5-years compared to the present analysis, with a median follow-up period of 1.75 years.
The biggest strength of the study is that the costs related to the healthcare resource utilization were derived from administrative databases that are not subject to recall bias and represent the utmost accuracy and completeness. However, there are some limitations of this study. The cost of hospital admissions was assigned based on the national efficient price (and DRG cost weights in a sensitivity analysis). However, these reflect national average prices for a hospital episode by DRG classification. The actual cost of any given hospitalization observed within the trial is unknown and may differ from the national average if a micro-costing (bottom-up) approach was used. Although the National Efficient Price method does take into account and make adjustment for hospitalizations that are either below or above the bound of an average length of stay, this remains only a crude approximation of the actual hospital cost for the patients in the trial. From the primary trial results, the median number of days in hospital was lower in the SAFETY intervention arm compared to standard management armCitation20, suggesting that the hospital costs may be over-estimated for the intervention group in this analysis. The proportion of missing values on the EQ-5D-3L outcome posed another concern on the base case results, while the imputed data showed the consistent results with base case, both indicating a non-significant between-group difference. Perhaps more importantly, the SAFETY Trial was underpowered to determine statistical significance in all-cause hospital re-admissions or overall survival which has contributed to the uncertainty in the cost-effectiveness results presented here. Furthermore, due to the non-blinded nature of the RCT, the setting in the hospital might have raised awareness in patients and carers allocated to usual care with regards to the SAFETY DM components (e.g. more visits). This may have resulted in improved outcomes for the usual care arm observed in the trial and, therefore, under-estimate the value of the SAFETY intervention. The extent of this bias is not considered substantial given the small number of patients per day per facility enrolled into the trial and the nature of the intervention, specifically the additional home and telephone consultations. Overall, this research has identified that the SAFETY intervention is potentially a dominant strategy compared to standard management and that the benefit from undertaking future research is substantive.
Conclusion
The AF-specific management strategy assessed in the SAFETY Trial is a potentially dominant strategy to improve health outcomes and reduce healthcare costs for an increasing number of individuals presenting with chronic AF in whom recurrent hospital admissions and premature mortality is common. The value of further research to reduce the uncertainty in the estimated cost-effectiveness results is substantive.
Transparency
Declaration of funding
This research was supported by funding provided by the National Health and Medical Research Council (Program of Research Grant #105214). SS and PS were supported by NHMRC Principal and Senior Research Fellowships (#1041796, and #1136923, respectively).
Declaration of financial/other interests
The authors have no relevant affiliations or financial involvement with any organization or entity with a financial interest in or financial conflict with the subject matter or materials discussed in the manuscript. This includes employment, consultancies, honoraria, stock ownership or options, expert testimony, grants or patents received or pending, or royalties. The peer reviewers on this manuscript have no relevant financial relationships or otherwise to disclose.
Supplemental Material
Download MS Word (13.6 KB)Acknowledgements
None reported.
Data availability statement
The data set associated with the paper may be requested from the corresponding author depending on the nature of the request.
Related Research Data
References
- Abegunde DO, Mathers CD, Adam T, et al. Chronic diseases 1 – The burden and costs of chronic diseases in low-income and middle-income countries. Lancet. 2007;370:1929–1938.
- Lynch J, Smith GD. A life course approach to chronic disease epidemiology. Annu Rev Public Health. 2005;26:1–35.
- Yach D, Hawkes C, Gould CL, et al. The global burden of chronic diseases: overcoming impediments to prevention and control. JAMA. 2004;291:2616–2622.
- World Health Organisation. Global status report on noncommunicable diseases. Geneva, Switzerland: WHO; 2014.
- Ball J, Thompson DR, Ski CF, et al. Estimating the current and future prevalence of atrial fibrillation in the Australian adult population. Med J Aust. 2015;202:32–35.
- Ball J, Carrington MJ, McMurray JJV, et al. Atrial fibrillation: Profile and burden of an evolving epidemic in the 21st century. Int J Cardiol. 2013;167:1807–1824.
- Chugh SS, Roth GA, Gillum RF, et al. Global burden of atrial fibrillation in developed and developing nations. Global Heart. 2014;9:113–119.
- Wong CX, Brooks AG, Leong DP, et al. The increasing burden of atrial fibrillation compared with heart failure and myocardial infarction: a 15-year study of all hospitalizations in Australia. Arch Intern Med. 2012;172:739–741.
- Camm AJ, Savelieva I, Potpara T, et al. The changing circumstance of atrial fibrillation – progress towards precision medicine. J Intern Med. 2016;279:412–427.
- Camm AJ, Lip GY, De Caterina R, et al. 2012 focused update of the ESC guidelines for the management of atrial fibrillation: an update of the 2010 ESC guidelines for the management of atrial fibrillation. Developed with the special contribution of the European Heart Rhythm Association. Eur Heart J. 2012;33:2719–2747.
- Kirchhof P, Benussi S, Kotecha D, et al. 2016 ESC guidelines for the management of atrial fibrillation developed in collaboration with EACTS. Eur Heart J. 2016;37:2893–2962.
- Reynolds MR, Essebag V. Economic burden of atrial fibrillation: implications for intervention. Am J Pharm Benefits. 2012;4:58–65.
- Johnsen SP, Dalby LW, Tackstrom T, et al. Cost of illness of atrial fibrillation: a nationwide study of societal impact. BMC Health Serv Res. 2017;17:714.
- Mays GP, Au M, Claxton G. MARKETWATCH: convergence and dissonance: evolution in private-sector approaches to disease management and care coordination. Health Affair. 2007;26:1683–1691.
- Bodenheime T. Disease management in the American market. BMJ. 2000;320:563–566.
- Ellrodt G, Cook DJ, Lee J, et al. Evidence-based disease management. JAMA. 1997;278:1687–1692.
- Todd W, Nash D, editors. Disease Management: A Systems Approach to Improving Patient Outcomes. San Francisco, CA: Jossey Bass; 2001.
- Maru S, Byrnes J, Whitty JA, et al. Systematic review of model-based analyses reporting the cost-effectiveness and cost-utility of cardiovascular disease management programs. Eur J Cardiovasc Nur. 2015;14:26–33.
- Maru S, Byrnes J, Carrington MJ, et al. Cost-effectiveness of home versus clinic-based management of chronic heart failure: Extended follow-up of a pragmatic, multicentre randomized trial cohort — The WHICH? study (which heart failure intervention is most cost-effective & consumer friendly in reducing hospital care). Int J Cardiol. 2015;201:368–375.
- Stewart S, Ball J, Horowitz JD, et al. Standard versus atrial fibrillation-specific management strategy (SAFETY) to reduce recurrent admission and prolong survival: pragmatic, multicentre, randomised controlled trial. Lancet. 2015;385:775–784.
- Zwarenstein M, Treweek S, Gagnier JJ, et al. Improving the reporting of pragmatic trials: an extension of the CONSORT statement. BMJ. 2008;337:1223–1226.
- Carrington MJ, Ball J, Horowitz JD, et al. Navigating the fine line between benefit and risk in chronic atrial fibrillation: rationale and design of the standard versus atrial fibrillation specific management study (SAFETY). Int J Cardiol. 2013;166:359–365.
- StataCorp. Stata Statistical Software: Release 14. College Station, TX: StataCorp LP; 2015.
- Pharmaceutical Benefits Advisory Committee. Guidelines for preparing submissions to the Pharmaceutical Benefits Advisory Committee, version 4.5. Canberra, Australia: Commonwealth of Australia; 2015.
- Medical Services Advisory Committee. Technical guidelines for preparing assessment reports for the Medical Services Advisory Committee Version 2.0. Canberra, Australia: Commonwealth of Australia; 2016.
- Independent Hospital Pricing Authority. National Efficient Price Determination 2016–17. Canberra, Australia: Commonwealth of Australia; 2016.
- Department of Health. Medicare Benefits Schedule Book. Canberra, Australia: Commonwealth of Australia; 2016.
- Department of Health. Schedule of Pharmaceutical Benefits. Canberra, Australia: Commonwealth of Australia; 2016.
- Australian Bureau of Statistics. Consumer Price Index, Australia. 2016. Available from: http://www.abs.gov.au/AUSSTATS/[email protected]/DetailsPage/6401.0Jun%202016?OpenDocument [Accessed 29 March 2018].
- Kularatna S, Whitty JA, Johnson NW, et al. A comparison of health state utility values associated with oral potentially malignant disorders and oral cancer in Sri Lanka assessed using the EQ-5D-3 L and the EORTC-8D. Health Qual Life Outcomes. 2016;14:101.
- Viney R, Norman R, King MT, et al. Time trade-off derived EQ-5D weights for Australia. Value Health. 2011;14:928–936.
- Independent Hospital Pricing Authority. National Hospital Cost Data Collection Australian Public Hospitals Cost Report 2012–2013, Round 17. Canberra, Australia: Commonwealth of Australia; 2015.
- Katzenellenbogen JM, Teng THK, Lopez D, et al. Initial hospitalisation for atrial fibrillation in Aboriginal and non-Aboriginal populations in Western Australia. HEART. 2015;101:712–719.
- Price Water House Coopers. The economic costs of atrial fibrillation in Australia. Canberra, Australia; 2010.
- Heniks J, Tomini F, van Asselt T, et al. Cost-effectiveness of a specialized atrial fibrillation clinic vs. usual care in patients with atrial fibrillation. Europace. 2013;15:1128–1135.
- Inglis S, McLennan S, Dawson A, et al. A new solution for an old problem? Effects of a nurse-led, multidisciplinary, home-based intervention on readmission and mortality in patients with chronic atrial fibrillation. J Cardiovasc Nurs. 2004;19:118–127.