
Abstract
Purpose: This study aimed to evaluate the healthcare resource utilization (HCRU) and costs for patients with severe aplastic anemia (SAA) using US claims data.
Methods: This retrospective, observational database study analyzed claims data from the Truven MarketScan databases. SAA patients aged ≥2 years identified between 2014 and 2017 who were continuously enrolled for 6 months before their first SAA treatment or blood transfusion, with a ≥6-month follow-up, were included. Baseline demographics and comorbidities were evaluated. Monthly all-cause and SAA-related HCRU and direct costs in the follow-up period were analyzed and differences were presented for all patients and across age groups.
Results: With an average follow-up period of 21.5 months, 939 patients were included in the study. Monthly all-cause and SAA-related HCRU [mean (SD)] were 1.65 days (2.61 days) and 0.18 days (0.70 days) for length of stay, 0.18 (0.23) and 0.01 (0.04) for hospital admissions, 0.25 (0.30) and 0.02 (0.07) for ER visits, 2.24 (1.40) and 0.46 (0.99) for office visits, and 2.90 (2.64) and 0.55 (1.31) for outpatient visits, respectively. On average, SAA patients received 0.15 (0.57) blood transfusions per month. Mean monthly all-cause direct costs were $28,280 USD ($36,127) [US dollars, mean (SD)]. Direct costs related to admissions were $11,433 USD (SD $25,040), followed by $624 USD ($1,703) for ER visits, $528 USD ($694) for office visits, $7,615 USD ($13,273) for outpatient visits, and $5,998 USD ($11,461) for pharmacy expenses. Monthly SAA-related direct costs averaged $7,884 USD (SD $16,254); of these costs, $1,608 USD ($7,774) were from admissions, $47 USD ($257) from ER visits, $127 USD ($374) from office visits, $1,462 USD ($4,994) from outpatient visits, and $4,451 USD ($10,552) from pharmacy expenses.
Conclusion: SAA is associated with high economic burden, with costs comparable to blood malignancies, implying that US health plans should consider appropriately managing SAA while constraining the total healthcare costs when making formulary decisions.
Introduction
Severe aplastic anemia (SAA) is a rare, but serious blood disorder in which the bone marrow does not make enough new red blood cells, white blood cells, and platelets to sustain healthCitation1,Citation2. Historically, SAA was associated with a nearly uniformly fatal diagnosis due to infection or hemorrhage, resulting from prolonged pancytopenia. If left untreated, SAA can result in 80–90% mortality in 1–2 yearsCitation3,Citation4. The exact incidence rates for the US are unknown, although the National Organization for Rare Disorders notes that ∼500–1,000 new cases of aplastic anemia are diagnosed each yearCitation5.
The healthcare resource utilization (HCRU) and economic burden of this rare and debilitating condition are poorly understood, especially for refractory cases. de Latour et al.Citation6 showed that, prior to hematopoietic stem cell transplantation (HSCT), patients with SAA had a mean 0.9 hospitalizations per patient per year (PPPY), 0.4 ER visits PPPY, and 12.8 office visits PPPY. The incidence rates of SAA-related HCRU PPPY were lower after initiation of eltrombopag (EPAG), a thrombopoietin receptor agonistCitation6. Though only published in abstract form, Joshi et al.Citation7 conducted the first evaluation of inpatient resource utilization (hospitalizations), mortality, and costs in children treated for SAA in the US. This study identified 446 patients first admitted between 2010 and 2014 with a diagnosis of SAA and analyzed 1,631 admissions over the course of the study period follow-up (not reported in the abstract). The majority of the patients (282, 63%) received immunosuppressive therapy (IST) alone, while 98 (22.3%) patients underwent HSCT without IST, and 66 (14.7%) patients received both forms of therapy. The median length of stay (LOS) was 36 days, but significantly lower for patients who underwent IST only (p < 0.0001)Citation7. Cumulative adjusted charges were significantly different across the groups with a median of $244,513 USD ($867/patient) for patients receiving IST, $793,009 USD ($8,092/patient) for those who underwent SCT alone, and $1,365,051 USD ($20,683/patient) for those that had both forms of therapy (p < 0.0001)Citation7.
Published data on HCRU and direct costs for patients on SAA therapy are extremely limitedCitation6,Citation7. The current study aims to address this knowledge gap by examining the burden of SAA disease associated with the total and SAA-related HCRU and direct costs in a real-world setting in the US.
Methods
Data source
This retrospective non-interventional, real-world claims database analysis evaluated data from the Truven Health MarketScan1 Commercial Claims and Encounter and the Medicare Supplemental and Coordination of Benefits databasesCitation8–10. These databases track information from nearly 30 million people who are enrolled in commercial health insurance plans sponsored by more than 300 employers in the US. Available data include insurance enrollment status, prescription eligibility information, hospitalization, outpatient visit, physician office visit, prescription drug claims, and related costs. These databases provide detailed diagnosis, treatment, cost (payment), and healthcare utilization information for healthcare services performed in inpatient and outpatient settings, in addition to standard demographic variables (i.e. age, sex, employment status, and geographic location)Citation8–10. All study data were accessed using methods compliant with the Health Insurance Portability and Accountability Act of 1996. Additionally, no identifiable protected health information was used in the conduct of this study; therefore, informed consent or institutional review board approval was not required.
Sample selection and patient population
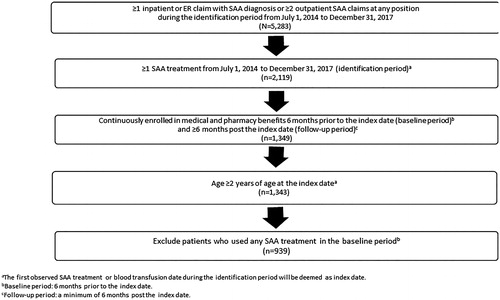
A diagnosis of SAA was determined using the International Classification of Diseases, 9th and 10th edition, Clinical Modification (ICD-9-CM and ICD-10-CM) codes, which reflect acquired bone marrow failure (Supplementary Appendix A). Patients who were initiated on an SAA therapy (Supplementary Appendix B) between 1 July 2014 and 31 December 2017 were selected. The index date was defined as the date of the first SAA treatment or the first blood transfusion, whichever was earlier. Patients were included if they were 2 years or older, had at least one primary or secondary diagnosis claim with SAA and at least one SAA treatment during the identification period which spanned from 1 July 2014 to 31 December 2017, and were continuously enrolled in medical and pharmacy benefits during the 6 months prior to the index date and at least 6 months post the index date. Patients who used any SAA treatment during the baseline period (6 months prior to the index date) were excluded from the study. These patients were followed from index date to the end of enrollment or end of study period, whichever comes earlier (). On average, these patients were followed up for 21.5 months. describes the patient selection in detail.
Figure 1. Study schematic.
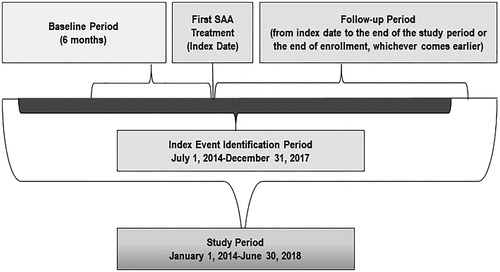
Figure 2. Patient selection.
Patient demographics and clinical characteristics
Patients were classified as having SAA if they had either an ICD-9-CM code of 284.09, 284.8, 284.89, 284.9, or an ICD-10-CM code of D610, D6101, D6109, D613, D6189, D619 any time between July 1, 2014 and December 31, 2017 (Supplementary Appendix A). Patient demographic data were captured from enrollment data; categorical variables included sex, geographic region (Northeast, Midwest, South, West), and insurance type (Health Management Organization [HMO], Point of Service [POS] capitation, and Fee for Service [FFS]). Age was assessed as both a continuous and categorical variable using the following age groups: 2–17, 18–44, 45–64, and ≥65 years.
Baseline clinical characteristics included baseline comorbidities and the Deyo claims-based adaptation of the Charlson Comorbidity Index (CCI) scoreCitation11. Comorbidities captured metastatic solid tumors, type 2 diabetes with and without chronic complications, chronic pulmonary disease, mild liver disease, moderate-to-severe liver disease, renal disease, congestive heart failure, peripheral vascular disease, cerebral vascular disease, myocardial infarction, peptic ulcer disease, hemiplegia or paraplegia, rheumatic disease, Acquired Immune Deficiency Syndrome/Human Immunodeficiency Virus Infection, and dementia. CCI was assessed as a continuous variable and calculated as the sum of weights related to each comorbid condition in the pre-index period. Due to limited research in this disease area, there are no established algorithms or consensus around definitions for lines of therapy in a real-world setting. In order to capture first-line treatment agents in this study (Supplementary Appendix B), we used a literature review of clinical trials and inputs from clinical experts and determined the first 6 months to be an important threshold to define the first-line treatments. Therefore, we considered SAA therapies (either monotherapy or combination therapies) as the first-line SAA treatments if they were used during the first 6 months after the index date.
Outcome measures
The study outcome measures were monthly all-cause and SAA-related HCRU and direct costs reported during the follow-up period. All-cause and SAA-related HCRU included LOS for hospitalization, hospital admissions, ER visits, office visits, and other outpatient visits, and were computed as per patient per month (PPPM). In addition, SAA-related HCRU included blood transfusions PPPM. All-cause and SAA-related direct costs reflected plan-paid medical expenditures. These costs were presented as an overall total cost and for each mutually exclusive cost category based on the following service settings: (a) inpatient, (b) ER visits, (c) office visits, (d) other outpatient visits (i.e. hospital setting or ambulatory surgical center, a skilled nursing facility, a residential substance abuse center, a comprehensive outpatient rehabilitation center, an end-stage-renal disease center or an outpatient NEC center), (e) prescription costs, and (f) other services. SAA-related prescription costs were derived from regimens that could include combinations of the following: HSCT agents, bone marrow stimulants (i.e. darbepoetin, epoetin, filgrastim, pegfilgrastim, or sargramostim), EPAG, anti-thymocyte globulin (ATG) (i.e. lymphocyte IG, anti-thymocyte/thimerosal, or lymphocyte immune globulin [rabbit, antithymocyte-equine]), calcineurin inhibitor (i.e. cyclosporine or tacrolimus), androgens (i.e. danazol, fluoxymesterone, methyltestosterone, nandrolone, oxandrolone, oxymetholone, stanozolol, testolactone, or testosterone), alemtuzumab, romiplostim, cyclophosphamide, or blood transfusion (i.e. any type) (Supplementary Appendix B). Capitated costs for managed care payers were estimated from FFS patients who had the same medical services. All costs were inflation adjusted to 2018 US dollars using the Consumer Price IndexCitation12.
Statistical analysis
Descriptive analyses were conducted for each of the study outcome variables. Frequency and percentage were calculated for categorical variables. Mean and standard deviation (SD) were analyzed for continuous variables. Univariate analyses were conducted for patients with SAA; the Chi-square test was applied for categorical end points and Wilcoxon's rank sum test was used for end points with continuous measures. Since follow-up time differed by patient due to changes in enrollment status, monthly HCRU and costs were assessed.
Results
Baseline demographics
In total, 939 SAA patients met the inclusion/exclusion criteria () and the average follow-up period was 21.5 months. Overall, the mean age (SD) of the study population was 54.0 years (23.3), with a balanced gender distribution of 49.3% males and 50.7% females (). The mean CCI score (SD) for all patients at baseline was 3.57 (3.32). The most common comorbid conditions overall were type 2 diabetes without chronic complications (205, 21.8%), chronic pulmonary disease (180, 19.2%), renal disease (158, 16.8%), metastatic solid tumor (149, 15.9%), and mild liver disease (126, 13.4%). The South had the highest proportion of patients (349/939, 37.2%). Most of the patients in the study (819, 87.2%) had FFS insurance. Utilization of first-line agents are presented in . The most commonly used first-line treatments were bone marrow stimulants (BMS, 20.0%), BMS plus steroid/prednisone (18.2%), calcineurin plus steroid/prednisone (8.1%), calcineurin (8.0%), BMS plus cyclophosphamide and steroid/prednisone (7.0%), and blood transfusions (5.5%). Immunosuppressant and stem cell transplant agents also accounted for considerable proportions among first-line treatments.
Table 1. Demographic characteristics.
Table 2. First-line treatments.
All-cause healthcare resource utilization in the follow-up period
All-cause HCRU for patients with SAA in the follow-up period is summarized in . The monthly mean LOS (SD) for all patients was 1.65 days (2.61 days). For all patients, the monthly number of hospital admissions was 0.18 (0.23), the monthly number of ER visits was 0.25 (0.30) days, the monthly number of office visits was 2.2 (1.40) days, and the monthly number of outpatient visits was 2.90 (2.64). Outpatient visits were the most commonly used HCRU for all age groups and all patients. Patients with SAA aged 2–17 years had the longest LOS [SD] (2.4 [2.78] days). This LOS was ∼2.4-fold greater than the group with the shortest LOS (≥65+ years, 1.03 [1.64] days). Similarly, the highest HCRU [SD] was observed in the 2–17-year-old patient group for the number of hospital admissions (0.31 [0.39]), the number of office visits (2.62 [1.61]), and the number of outpatient visits (3.53 [2.02]; all three parameters, p < 0.05). The mean number of ER visits was similar across all age groups (range = 0.19–0.30).
Table 3. Monthly all-cause and SAA-related HCRU in the follow-up period.
SAA-related healthcare resource utilization in the follow-up period
SAA-related HCRU for patients with SAA in the follow-up period is summarized in . The monthly SAA-related mean LOS for all patients (SD) was 0.18 days (0.70 days). The mean (SD) number of outpatient visits was 0.55 (1.31), followed by 0.46 (0.99) office visits, 0.02 days (0.07 days) ER visits, and 0.01 days (0.04 days) hospital admissions. Patients received a mean of 0.15 (0.57) blood transfusions. Similarly, to the trend we observed in total all-cause HCRU, patients with SAA aged 2–17 years had the longest mean LOS [SD] (0.56 [1.30] days) and the highest monthly SAA-related HCRU for hospital admissions (0.03 [0.05]), ER visits (0.06 [0.16]), office visits (1.16 [1.63]), outpatient visits (1.28 [0.86]), and blood transfusions (0.20 [0.40]; all six parameters, p < 0.0001).
All-cause direct costs in the follow-up period
The all-cause direct costs in US dollars for patients with SAA during the follow-up are summarized in . Across all patient groups, the mean (SD) all-cause total direct cost (USD) was $28,280 USD ($36,127). The highest contributors to this cost [SD] were hospitalizations ($11,433 USD [$25,040], 40.43% of total), outpatient ($7,615 USD [$13,273], 26.93%), and prescription costs ($5,998 USD [$11,461], 21.21%). Higher mean costs [SD] were seen in the youngest patient group, aged 2–17 years. The total cost in this age group was ($41,755 USD [$41,765]), with $21,914 USD ($28,665) for hospitalizations, ($823 USD [$785]) for office visits, and ($8,804 USD [$7,765]) for outpatient visits. These costs appeared to decrease with increasing age. Mean prescription costs [SD] were lowest in the oldest age group, 65+ years ($3,195 USD [$3,950], p = 0.0004).
Table 4. Monthly all-cause and SAA-related direct costs in the follow-up period.
Monthly SAA-related direct costs in the follow-up period
The monthly SAA-related direct costs in US dollars for patients with SAA during the follow-up are summarized in . Across all age groups, ∼$7,884 of the cost (27.88%) was directly related to SAA. The factor that contributed the most to this monthly cost was prescription medications [mean (SD)] USD ($4,451 USD [$10,552], 56.46% of total SAA-related costs). Similar trends with respect to age groups were observed for SAA-related monthly costs [mean (SD)], with the highest in the 2–17 years of age group and somewhat lower with advancing age. For the youngest age group (2–17 years), total monthly SAA-related costs were ($16,709 USD [$23,922]), with an average monthly SAA-related cost for hospitalizations ($5,941 USD [$15,778]), office visits ($423 USD [$771]), outpatient visits ($3,444 USD [$5,529]), and prescriptions ($6,226 USD [$14,382]). Total monthly costs [mean (SD)] for the 2–17-year-old group were ∼5-fold greater than those for the group with the lowest total direct costs (65+ year-old group, $3,321 USD [$6,905]). Prescription costs were ∼3.1-fold higher in the 2–17-year-old group compared with the 65+ year-old group ($6,226 USD vs $1,985 USD, respectively).
Discussion
To our knowledge, this is the first study to describe the HCRU and direct costs incurred by patients with SAA, demonstrating the substantial burden of SAA. The youngest age groups incurred the highest HCRU and costs, with the longest LOS and highest number of hospital admissions, office visits, and outpatient visits. Several factors may have influenced these outcomes. Younger patients with SAA may be most likely to receive stem cell transplant than older patients, such that they incurred most costs; they could also have needed treatments for other comorbid conditions. Another factor may be the lack of standardized healthcare delivery to young adults with SAACitation13, where known issues exist in terms of transition from pediatric to adult care. At times, young adults with SAA do have difficulties identifying physicians to continue their care. In addition, the group most likely to be uninsured in the US includes individuals of 19–29 years of age, suggesting a coverage gap after childhood. The trend of younger patients who incurred the highest costs is also similarly identified in other blood cancer researchCitation14.
Patients with SAA often have comorbid conditions; in our study, nearly a third of patients had metastatic solid tumors while type 2 diabetes, chronic pulmonary disease, liver disease, and renal disease were also common. The presence of these comorbid conditions could have contributed to the mean all-cause related and SAA-related costs overall being so high.
Another factor which contributed to both the costs and ultimately the HCRU for these patients was the type of therapy they were using to manage their disease. The two most commonly used first-line treatments were bone marrow stimulants (BMS, 20.0%) and BMS plus steroid/prednisone (18.2%). Substantial proportions of patients also took other forms of treatment including: calcineurin plus steroid/prednisone (8.1%), calcineurin (8.0%), BMS plus cyclophosphamide and steroid/prednisone (7.0%), and blood transfusions, (5.5%). These treatments made up a substantial proportion of SAA-related prescription costs, which accounted for the highest proportion of the total SAA-related costs (56.5%).
Few studies have examined the HCRU and economic burden of SAACitation6. de Latour et al.Citation6 showed that patients with SAA had a mean 0.9 SAA-related hospitalizations PPPY, 0.4 ER visits PPPY, 12.8 office visits PPPY, and 2.3 outpatient procedures PPPY. These values were generally comparable to those seen in the current study.
Joshi et al.Citation7 conducted the first evaluation of inpatient resource utilization, mortality, and costs in patients <21 years of age treated for SAA in the US. Their study reported a median LOS of 36 days, with a LOS that was significantly lower for patients who underwent IST only compared with those on cyclosporine (CSA; p < 0.0001)Citation7. The highest costs in each group correlated with pharmacy (37%), nursing and room/operating room (32%) charge codes. While the overall cost of care for these patients was high, it was >3-fold higher for patients undergoing HSCT and over 6-times higher if HSCT was utilized upon failure of IST. While not directly comparable to the results of the current study, these results provide valuable information on the relative costs of SAA-related therapy.
Another recent study used a responder model for newly-diagnosed SAA patients in a one million member health plan to assess the economic impact of including EPAG in addition to IST (ATG and cyclosporine A) as a first-line treatment for patients with SAACitation15. This simulated cohort of patients underwent 6 months of treatment with either EPAG in addition to IST or with IST alone and were followed for 3 years. First-line drug costs accounted for an increase of $109,147 (USD) over 3 years, while improvements in response rates led to offsets in costs for second-line drugs, resulting in $29,663 (USD) of savings. While these results highlight the significant cost burden of SAA therapy, these results cannot be directly compared to those from the current study, since the analysis was conducted in a simulated population.
In the current study, the economic burden for patients with SAA is relatively high compared with other malignant hematologic diseases (). Total yearly costs per diseases have been estimated at $463,414 (USD) for patients with acute leukemia.Citation14
Table 5. Examples of yearly economic burden of chronic hematologic diseases.
By comparison, if the mean overall total costs from the current study were extrapolated to 1 year, they would be $339,360 USD. This figure is comparable to that estimated for the most expensive blood malignancy, acute leukemia, and highlights the significant financial burden of SAA in terms of healthcare utilization and treatment costs.
There are several limitations in the current study that should be noted. Because SAA is a rare disease, the sample size for this study was relatively small. Secondary databases document paid claims for medications, but do not accurately capture medication adherence and compliance. Insurance claims in this database represent a convenience sampleCitation16. These claims data are not fully representative of all patients with SAA in the US. Patients with SAA were identified in this study using ICD codes, but validation via chart review or clinician survey was not possible. A further limitation of claims data is its inability to ascertain whether a case is truly incident or represents a patient who simply did not present for care over a prolonged period. Although we see these treatment patterns and costs in US patients, these may not be reflective of treatment patterns and costs in other countriesCitation17,Citation18.
Conclusions
In this study, patients with SAA had high economic burdens in terms of HCRU and direct costs. Hospitalizations, outpatient, and prescription costs comprised the highest proportions of both all-cause and SAA-related total costs. Emergency room utilization and direct costs were similar across all age groups. Overall, younger patients, aged 2–17 years, had the longest LOS, and the highest HCRU and all-cause and SAA-related direct costs for most of the parameters examined. Total all-cause direct costs for SAA patients were comparable to those for the costliest blood malignancies such as multiple myeloma, bone marrow disorders, lymphoma, and chronic leukemiaCitation14. These findings imply US health plans should consider appropriately managing patients with SAA while constraining the total healthcare costs when making formulary decisions.
Transparency
Declaration of funding
Funding for this study was provided by Novartis Pharmaceuticals Corporation.
Declaration of financial/other relationships
BC was a full-time employee of Novartis Pharmaceuticals Corporation when this study was conducted. QS was a full-time employee of Novartis Pharmaceuticals Corporation when this study was conducted. XL was an employee of KMK Consulting Service and worked at Novartis Pharmaceuticals Corporation as a contracted consultant when this study was conducted. FYL was a full-time employee of Novartis Pharmaceuticals Corporation when this study was conducted. SA was a full-time employee of Novartis Pharmaceuticals Corporation when this study was conducted. JME peer reviewers on this manuscript have no relevant financial or other relationships to disclose.
Cai_Appendix_B_Final_27May2019.docx
Download MS Word (15.1 KB)Cai_Appendix_A_Final_27May2019.docx
Download MS Word (14.4 KB)Acknowledgements
The authors would like to thank Write All, Inc, the company that provided editorial and written services on behalf of Novartis Pharmaceuticals Corporation.
Notes
1 IBM Watson Health Business is a registered trade mark of Truven MarketScan, MI, USA.
Related Research Data
References
- National Heart, Lung, and Blood Institute (NHLBI). What is aplastic anemia. 2018 [cited 2018 Aug 31]. Available from: https://www.nhlbi.nih.gov/node/80148.
- Young NS, Calado RT, Scheinberg P. Current concepts in the pathophysiology and treatment of aplastic anemia. Blood. 2006;108:2509–2519.
- Camitta BM, Thomas ED, Nathan DG, et al. A prospective study of androgens and bone marrow transplantation for treatment of severe aplastic anemia. Blood. 1979;53:504–514.
- Rosenfeld S, Follmann D, Nunez O, et al. Antithymocyte globulin and cyclosporine for severe aplastic anemia: association between hematologic response and long-term outcome. JAMA. 2003;289:1130–1135.
- Dunkirk SG, Gregg SL, Duran LW, et al. Photochemical coatings for the prevention of bacterial colonization. J Biomater Appl. 1991;6:131–156.
- de Latour RP, Huynh L, Ivanova JI, et al. A retrospective chart review to assess burden of illness among patients with severe aplastic anemia with insufficient response to immunosuppressive therapy. Blood. 2017;130:678
- Joshi S, Rose MJ, Stanek JR, et al. A comparison of resource utilization, cost and mortality in children treated for severe aplastic anemia. Blood. 2016;128.2333.
- Desmond R, Townsley DM, Dumitriu B, et al. Eltrombopag restores trilineage hematopoiesis in refractory severe aplastic anemia that can be sustained on discontinuation of drug. Blood. 2014;123:1818–1825.
- Olnes MJ, Scheinberg P, Calvo KR, et al. Eltrombopag and improved hematopoiesis in refractory aplastic anemia. N Engl J Med. 2012;367:11–19.
- Townsley DM, Scheinberg P, Winkler T, et al. Eltrombopag added to standard immunosuppression for aplastic anemia. N Engl J Med. 2017;376:1540–1550.
- Deyo RA, Cherkin DC, Ciol MA. Adapting a clinical comorbidity index for use with ICD-9-CM administrative databases. J Clin Epidemiol. 1992;45:613–619.
- Lee CH, Lee JH, Kim HM. Flexible integration of laser myringotomy and ventilation tube for bilateral Otitis media with effusion: analysis of laser tympanostomy versus ventilation tube. PLoS One. 2014;9:e84966.
- DeZern AE, Guinan EC. Aplastic anemia in adolescents and young adults. Acta Haematol. 2014;132:331–339.
- Dieguez G, Ferro C, Rotter D. Milliman Research Report. The cost burden of blood cancer care. Commissioned by the Leukemia & Lymphoma Society; 2018.
- Tremblay G, Said Q, Cai B, et al. Comparing costs and consequences of Eltrombopag plus IST versus IST alone for first-line treatment in severe aplastic anemia: results from a responder analysis. Blood. 2018;132:1041.
- Broder MS, Cai B, Chang E, et al. Incidence and prevalence of neuroendocrine tumors of the lung: analysis of a US commercial insurance claims database. BMC Pulm Med. 2018;18:135.
- Dufour C, Pillon M, Passweg J, et al. Outcome of aplastic anemia in adolescence: a survey of the Severe Aplastic Anemia Working Party of the European Group for Blood and Marrow Transplantation. Haematologica. 2014;99:1574–1581.
- Killick SB, Bown N, Cavenagh J, et al. Guidelines for the diagnosis and management of adult aplastic anaemia. Br J Haematol. 2016;172:187–207.