
Abstract
Background and aims: Effective glycemic control is the cornerstone of successful type 2 diabetes management. However, many patients fail to reach glycemic control targets, and therapeutic inertia (failure to intensify therapy to address poor glycemic control in a timely manner) has been widely reported. The aim of the present study was to evaluate the economic burden associated with diabetes-related complications due to poor glycemic control for patients with type 2 diabetes in the UK.
Methods: A validated long-term model of type 2 diabetes (IQVIA CORE Diabetes Model) was used to project cost outcomes for a UK population with type 2 diabetes, based on data from The Health Improvement Network primary care database, at different levels of glycemic control. Costs associated with diabetes-related complications were accounted in 2017 Pounds Sterling (GBP). Complication costs were estimated for populations achieving different glycated hemoglobin (HbA1c) targets, in a number of delayed treatment intensification scenarios, and across a range of time horizons.
Results: For patients with an HbA1c level of 8.2% (66 mmol/mol), 7 years in poor control could increase mean costs associated with diabetes-related complications by over GBP 690 per patient and lead to costs of over GBP 1,500 in lost workplace productivity compared with achieving good glycemic control (HbA1c 7.0%, 53 mmol/mol) over a 10-year time horizon. Based on published estimates of the proportion of type 2 diabetes patients failing to meet glycemic targets in the UK, this corresponds to an additional economic burden of ∼GBP 2,600 million (complication costs plus lost productivity costs).
Conclusions: The economic burden of poor glycemic control in type 2 diabetes in the UK is substantial. Efforts to avoid therapeutic inertia could substantially reduce diabetes-related complication costs even in the short-term.
Introduction
With ∼422 million people around the world living with the disease and incidence rates continuing to rise, diabetes mellitus represents one of the most serious challenges facing healthcare systems around the worldCitation 1 . Type 2 diabetes in particular, which contributes 90% of all cases of diabetes mellitus, is the main driver of increasing prevalence with estimates suggesting that the number of people living with diabetes has doubled since 1980Citation 1 , Citation 2 . Diabetes mellitus is a chronic, metabolic disease associated with significant morbidity and mortality, and characterized by elevated levels of blood glucose, which eventually leads to serious damage to the heart, blood vessels, eyes, kidneys, and nervesCitation 1 . Diabetes UK has estimated that ∼4.7 million people in the UK have been diagnosed with diabetes mellitus, leading to the National Health Service (NHS) spending GBP 10 billion per year on the disease; around 10% of its overall budgetCitation 2 , Citation 3 . Moreover, evidence has indicated that ∼80% of the total cost of diabetes mellitus is associated with the management of complicationsCitation 3 . However, several landmark studies have shown that maintaining good glycemic control can reduce the incidence of diabetes-related complications in the long-term, creating the potential to improve patient outcomes and reduce the burden of diseaseCitation 4–8 . Based on these data, the National Institute for Health and Clinical Excellence (NICE) recommends glycemic control targets for patients with type 2 diabetesCitation 9 . For those managed with lifestyle modifications and a single drug not associated with hypoglycemia, a glycated hemoglobin (HbA1c) target of 6.5% (48 mmol/mol) or below is recommended, and for those with diabetes not adequately controlled with monotherapy, a target of 7.0% (53 mmol/mol) or below is suggested. The guidelines further recommend that therapy should be intensified if HbA1c is greater than 7.5% (58 mmol/mol).
In 2017, Khunti and Millar-JonesCitation 10 published a literature review focused on therapeutic inertia in type 2 diabetes, or failure to intensify therapy despite poor glycemic control, in the UK. The authors reported evidence that clinicians tend to have a reactive approach to therapy intensification, waiting for the worsening of hyperglycemia or complications to arise before intensifying treatment, and as a result patients will reach glycemic targets for only short periods, if at all. Median times to intensification with insulin therapy were ∼6–7 years for patients on multiple oral antidiabetic drugs (OADs) and one study reported a median of 3.7 years [95% confidence interval = 3.4–4.0] for the intensification of insulin therapy from the time that high HbA1c levels (≥7.5% [58 mmol/mol]) were recordedCitation 11–13 .
Recent evidence indicates that many patients with diabetes mellitus in the UK are not achieving the glycemic targets recommended by NICECitation 14 , Citation 15 . Data from the National Diabetes Audit has shown that one-third of people with type 2 diabetes in England and Wales had an HbA1c above 7.5% (58 mmol/mol) in 2016–2017Citation 14 . Similarly, estimates from Scotland have suggested that around 40% of people with type 2 diabetes have an HbA1c above 7.5% (58 mmol/mol)Citation 16 . These figures suggest that there is an opportunity to bring a greater proportion of people with type 2 diabetes into good glycemic control and, in combination with addressing other modifiable risk factors through optimized therapy, reduce the costs associated with diabetes-related complications for healthcare payers and UK society as a whole.
The aim of the present study was to evaluate the economic burden associated with diabetes-related complications due to poor glycemic control for patients with type 2 diabetes in the UK.
Methods
Modeling approach
Long-term projections of clinical and cost outcomes were made using the IQVIA CORE Diabetes Model (version 9.0), a non-product specific diabetes policy analysis tool that has been validated against real-life data on original publication in 2004 and more recently in 2014Citation 17 , Citation 18 . The architecture, assumptions, features, and capabilities of the model have been previously publishedCitation 19 . The model was used to evaluate complication rates, costs associated with diabetes-related complications, and costs arising from lost workplace productivity, including losses due to premature mortality. UK-specific life tables for 2015 from the World Health Organization were used for all analyses to capture background mortality, with remaining mortality due to diabetes-related complications also capturedCitation 20 . The risk of cardiovascular complications was predicted using the UKPDS 68 equationsCitation 21 . All simulations were performed using a first-order Monte Carlo approach.
Outcomes were projected over 3, 5, 10, 15, and 20 years, as well as patients’ lifetimes (). Scenarios evaluated outcomes with baseline HbA1c at 8.2% (66 mmol/mol), in line with the baseline value in the THIN population initiating therapy, and 9.0% (75 mmol/mol), with target levels set to 6.5% (48 mmol/mol, in line with NICE guidance), 7.0% (53 mmol/mol), and 7.5% (58 mmol/mol) in separate analyses (). In line with published evidence from the UK, additional scenarios modeled intensifying patients immediately (within year 1) compared with a delay in intensification of 1, 3, 5, or 7 years (in line with Khunti and Millar JonesCitation 10 ). In the modeling analysis, simulated patients were assumed to maintain good glycemic control (at a target HbA1c level), or to be in poor glycemic control (at the baseline HbA1c level) for a defined time period before HbA1c was lowered to the target level for the remainder of the time horizon (or the patient died in the simulation).
Table 1. Overview of scenarios modeled.
Cohort characteristics
Baseline patient characteristics were derived primarily from the population initiating therapy in the THIN primary care database in the UK, used by NICE in the health economic analysis supporting the development of guideline NG28 (published in December 2015)Citation 22 . People with type 2 diabetes were selected from the THIN dataset using a combination of read codes for type 2 diabetes, and initial therapy baseline data were selected from people receiving their first single non-insulin anti-diabetes medication. Data were selected for the point at which people were first prescribed anti-diabetes medication other than insulin, with measurements recorded closest to the prescription date (± 6 months). Patients were modeled with a baseline mean (standard deviation) age of 59.8 (12.6) years, mean duration of diabetes of 2.0 years, proportion male of 57.1%, proportion smokers of 19.1%, mean HbA1c of 8.2 (2.0)% (66 mmol/mol), mean systolic blood pressure of 139.6 (17.1) mmHg, mean total cholesterol of 4.96 (1.15) mmol/L, and mean body mass index (BMI) of 31.9 (3.2) kg/m2 (see Supplementary Material for details). Missing values were supplemented with those from the trial population described by Pratley et al.Citation 23 , as these values were not available from the THIN dataset and the trial population was comparable in terms of baseline demographics to the population initiating therapy in THIN, while mean number of cigarettes per day and alcohol consumption were based on UK-specific data for the general populationCitation 24 , Citation 25 . Where data could not be sourced from either THIN or Pratley et al. cohorts, characteristics were set to IQVIA CORE Diabetes Model default values. This cohort was assumed to be representative of patients in the UK early in the type 2 diabetes treatment continuum. Use of IQVIA CORE Diabetes Model default values in the modeling analysis was anticipated to have a modest impact on projected outcomes as these were derived from the UK Prospective Diabetes Study population, which was a newly-diagnosed UK type 2 diabetes cohort initiating therapy (in line with THIN population described above), and given that data for all key risk factors were taken from the THIN population (see Supplementary Table S1 for further details). Baseline HbA1c varied between 9.0% (75 mmol/mol) and 7.5% (58 mmol/mol) in scenario analyses.
Costs and other model settings
Costs associated with diabetes-related complications were derived from published sources and expressed in 2017 Pounds Sterling (GBP) (see Supplementary Material for details). No costs of glucose-lowering therapy were included in the analysis. Costs associated with lost workplace productivity were evaluated based on days off work estimates published by Sørensen and PlougCitation 26 and country-specific estimates of mean salaries in simulated patients of working age (see Supplementary Material for details). Physiological parameter progression was assumed to remain constant over the duration of the analyses, to enable the comparison of different HbA1c targets and baseline levels. Future cost outcomes were discounted at 3.5% annually in line with published guidance, and undiscounted results are provided in the Supplementary Material.
Estimation of burden
A prevalence-based approach was used to estimate the country-level burden associated with poor glycemic control. Per patient differences in direct and indirect costs were multiplied by estimates of the number of patients in poor glycemic control based on the literature: 2,887,213 of the 3,208,014 patients with diabetes in the UK have type 2 diabetesCitation 27 ; 1,163,547 patients are in poor glycemic control (based on data from de Pablos-Velasco et al.Citation 15 ) stating that 40.3% of these patients are in poor controlCitation 11 . An incidence-based calculation to estimate burden was also performed. Published incidence data provides an estimate of the number of these patients in the healthcare system in each year, and therefore allows calculation of the burden of therapeutic inertia over a 40-year period. This can be thought of as the burden associated with therapeutic inertia in the 2018 incident cohort, plus the 2019 incident cohort, plus the 2020 incident cohort, and so on (through to the end of 2057), based on the incidence data published by Zghebi et al.Citation 28 . Full details of this approach are provided in the Supplementary Material.
Results
Cost savings per patient
Long-term projections showed that 7 years in poor control could have a substantial impact on costs and clinical outcomes in patients with type 2 diabetes in the UK. For patients with an HbA1c level of 8.2% (66 mmol/mol), in line with data from the THIN primary care database, 7 years in poor control could increase mean direct costs by over GBP 690 and lead to mean costs of over GBP 1,500 in lost workplace productivity over a 10-year time horizon compared with achieving good glycemic control (HbA1c 7.0%, 53 mmol/mol) (). Over patients’ lifetimes, the economic burden was projected to be even higher, with 7 years in poor control adding over GBP 1,250 on average to direct medical costs and over GBP 1,600 in lost workplace productivity for each patient not achieving good glycemic control (HbA1c 7.0%, 53 mmol/mol). Estimation of the patient-level economic burden of just 1 year in poor glycemic control (HbA1c 8.2% [66 mmol/mol] vs 7.0% [53 mmol/mol]) showed that even with a short duration of poor glycemic control the economic impact was substantial (). Total costs (mean complication and lost productivity costs) were over GBP 835 higher with 1 year in poor glycemic control over patients’ lifetimes, and notable increases in costs were already evident after only 3 years. A similar pattern of results was observed when poor control was defined as a mean HbA1c of 9.0% (75 mmol/mol) in the modeling analysis, with an even greater economic burden associated with poor glycemic control ( and ).
Table 2. Cost savings associated with diabetes-related complications avoided for patients reaching glycemic targets (HbA1c 7.0% [53 mmol/mol]) vs having poor glycemic control HbA1c 8.2% [66 mmol/mol] for 7 years.
Table 3. Cost savings associated with diabetes-related complications avoided for patients reaching glycemic targets (HbA1c 7.0% [53 mmol/mol]) vs having poor glycemic control HbA1c 8.2% [66 mmol/mol] for 1 year.
Table 4. Cost savings associated with diabetes-related complications avoided for patients reaching glycemic targets (HbA1c 7.0% [53 mmol/mol]) vs having poor glycemic control (HbA1c 9.0% [75 mmol/mol], for 7 years.
Table 5. Cost savings associated with diabetes-related complications avoided for patients reaching glycemic targets (HbA1c 7.0% [53 mmol/mol]) vs having poor glycemic control (HbA1c 9.0% [75 mmol/mol]) for 1 year.
Population level burden
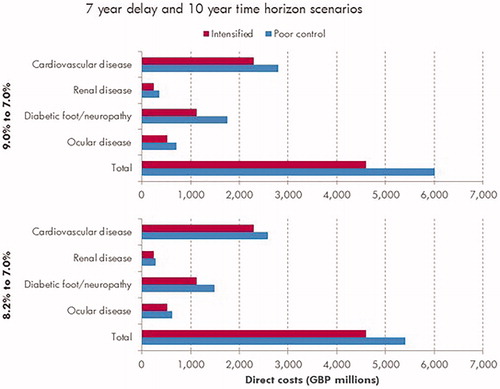
Estimation of the economic burden at a population level, based on published estimates of patients with type 2 diabetes failing to meet glycemic control targets, indicated that 7 years in poor glycemic control (HbA1c 8.2%, 66 mmol/mol) increased the direct costs associated with diabetes-related complications by ∼GBP 805 million over a 10-year time horizon compared with good glycemic control (HbA1c 7.0%, 53 mmol/mol) (). Costs associated with lost productivity in this scenario were projected to be GBP 1,795 million, giving a total economic burden estimate of ∼GBP 2,600 million for 7 years of poor glycemic control at a population level over a 10-year time horizon. Cardiovascular complications were the biggest driver of direct costs, accounting for half of all direct medical costs in the modeled scenarios (). Over patients’ lifetimes, the total economic burden of 7 years in poor glycemic control was estimated to be GBP 3,331 million in this scenario.
Figure 1. Mean cost of diabetes-related complications associated with 7 years in poor control (HbA1c 9.0% or 8.2%) vs effective glycemic control (HbA1c 7.0%) over a 10-year time horizon. Cardiovascular complications include myocardial infarction, angina, stroke, heart failure, and peripheral vascular disease. Renal complications include microalbuminuria, gross proteinuria, end-stage renal disease (dialysis), and renal transplant. Diabetic foot/neuropathy complications include foot ulcers, peripheral neuropathy, and amputation. Ocular complications refer to all eye disease (retinopathy, macular edema, cataract, and severe vision loss).
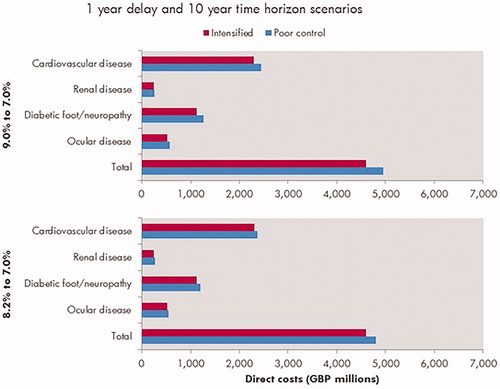
A substantial economic burden was evident even at much shorter time horizons. Assuming poor glycemic control for 1 year (HbA1c 8.2%, 66 mmol/mol), the modeling analysis indicated the total additional costs (direct plus indirect costs) were ∼GBP 571 million after only 3 years vs maintaining good glycemic control throughout (HbA1c 7.0%, 53 mmol/mol) (). This pattern of results was reflected when modeling poor glycemic control at an HbA1c level of 9.0% (75 mmol/mol), with more pronounced savings ( and , ).
Figure 2. Mean cost of diabetes-related complications associated with 1 year in poor control (HbA1c 9.0% or 8.2%) vs effective glycemic control (HbA1c 7.0%) over a 10-year time horizon. Cardiovascular complications include myocardial infarction, angina, stroke, heart failure, and peripheral vascular disease. Renal complications include microalbuminuria, gross proteinuria, end-stage renal disease (dialysis), and renal transplant. Diabetic foot/neuropathy complications include foot ulcers, peripheral neuropathy, and amputation. Ocular complications refer to all eye disease (retinopathy, macular edema, cataract, and severe vision loss).
Discussion
Delays in achieving good glycemic control in patients with type 2 diabetes are likely to represent a huge economic burden in the UK. The modeling analysis presented in this paper was designed to evaluate the potential burden of time spent in poor glycemic control, as reported in publications describing therapeutic inertia. The analysis showed that even a short time (1 year) in poor glycemic control (HbA1c 8.2%, 66 mmol/mol) could cost an additional GBP 197 million for the management of diabetes-related complications over the next 10 years. Factoring in lost workplace productivity, the total cost of 1 year in poor glycemic control could be as high as GBP 975 million over the next 10 years.
Whilst the present study is hypothetical in nature, much of the data modeled was aligned with evidence from the type 2 diabetes population in the UK. For example, cohort characteristics were taken primarily from THIN primary care database analysis used by NICE for the health economic analysis supporting the development of guideline NG28 and HbA1c targets were aligned with those recommended by NICECitation 9 , Citation 22 . It is noteworthy that the NICE HbA1c targets are different dependent on patient characteristics and therapies, and an individualized approach is recommended; therefore, we included multiple HbA1c targets in the present analysis. Assumptions around time in poor control were aligned with the data published by Khunti and Millar-JonesCitation 10 in 2017, indicating median times to intensification of 2.9 years from OAD monotherapy to OAD dual therapy (see Supplementary Material for 3-year delay results), 7.2 years from OAD dual to triple therapy, and 6.7 years from OAD triple therapy to insulin initiation. Complication costs were taken from published UK-specific sources (see Supplementary Material) and lost productivity costs were based on UK estimates of average salaries, working days, and retirement age, albeit with days-off-work estimates from a Danish study (as no UK-specific estimates were identified in literature review). The accumulation of lost workplace productivity costs in the modeling simulations was observed to be primarily in the first few years of the simulations, when the majority of patients were below retirement age and therefore incurring lost workplace productivity when complications occurred. With data suggesting the diagnosis of type 2 diabetes is becoming increasingly common in younger people, for example the National Diabetes Audit 2016–2017 report 6,836 aged under 25 years with the disease, the potential burden of lost workplace productivity associated with the condition is vastCitation 10 , Citation 29 .
The estimates presented here are consistent with previous analyses in the UK setting. For example, Baxter et al.Citation 30 reported that modest improvements in glycemic control could generate significant reductions in the incidence and, therefore, in the cost of complications in people with type 1 or type 2 diabetes based on a modeling analysisCitation 30 . By projecting outcomes for populations stratified by HbA1c, cost reductions in the UK adult type 2 diabetes population associated with treating patients to NICE HbA1c targets were estimated at GBP 299 million over 5 years, rising to GBP 4,506 million over 25 years. Hex et al. Citation 3 had previously reported annual direct costs of diabetes-related complications of GBP 7,000 million in the type 2 diabetes population in 2010/2011, and projected it could rise to GBP 12,224 million in 2035/2036. Both of these studies provide evidence that improving glycemic control in the type 2 diabetes population could drive substantial reductions in the economic burden associated with the disease.
As with any modeling analysis, it is important to acknowledge the limitations of the present study to appropriately contextualize the findings. Modeling analyses that make long-term projections of outcomes are, by definition, associated with a degree of uncertainty. In the present analysis, a widely used, published, and validated health economic model of type 2 diabetes (IQVIA CORE Diabetes Model) was used to minimize this uncertaintyCitation 17–19 . The analysis used assumptions on HbA1c progression (constant linear progression) to facilitate the comparison between different levels of glycemic control. Whilst this is almost certainly a simplification of reality (where HbA1c may vary considerably across the population), it was an important part of the analysis to allow clear interpretation of findings. Whilst the focus of the present analysis was on quantifying the burden associated with poor glycemic control, it is noteworthy that effective management of patients with type 2 diabetes involves addressing multiple risk factors, including reduction of excess body weight, smoking cessation, and improving blood pressure and serum lipid levels, amongst othersCitation 31 . Therapeutic choices with the goal of achieving good glycemic control can also impact these additional risk factors, along with lifestyle factors and other medications. Targeting multiple risk factors, not just glycemic control, in the management of patients with type 2 diabetes has the potential to further reduce the economic burden associated with diabetes-related complications than the estimates reported in the present analysis. Another potential limitation of the analysis was in the estimation of lost workplace productivity. Limited data availability meant that separate estimates of mean salary could not be used for males and females or stratified by patient age. Given that the risk of several end stage complications is generally higher in males, this may lead to an under-estimation of the economic burden of diabetes-related complications. In addition, the impact of diabetes-related complications leading to enforced retirement from the workforce or of their avoidance leading to delayed retirement were not captured in the present analysis.
Hypoglycemia was not included in the study as the analysis was focused on evaluating the costs associated with diabetes-related complications and not the costs of interventions or their side-effects. That acknowledged, inclusion of hypoglycemia in the present study would have had little or no impact on the estimates of economic burden as the risk of severe hypoglycemia would be unlikely to change significantly over the HbA1c levels in the present analysis. Lipska et al.Citation 32 reported comparable risk of severe hypoglycemia in patients with HbA1c between 6.0 and 6.9% (42 and 52 mmol/mol), 7.0 and 7.9% (53 and 63 mmol/mol), 8.0 and 8.9% (64 and 74 mmol/mol) in an analysis of over 9,000 type 2 diabetes patients in the US. Hypoglycemia risk was only elevated in patients with low HbA1c levels (<6%, 42 mmol/mol) and high HbA1c levels (≥9%, 75 mmol/mol). Moreover, the risk of hypoglycemia can be mitigated by careful selection of medications that are associated with a lower risk of hypoglycemia than traditional agents such as sulfonylurea and human insulinCitation 33 . Estimates of population level burden were made using published prevalence data in line with previous studiesCitation 30 . It is worth noting, however, that this is likely to under-estimate the true burden of disease and it only quantifies clinical and cost outcomes for the prevalent cohort. Incident patients, for example those who are diagnosed with type 2 diabetes next year or the year after that, are not included in the prevalence-based estimates of burden, but incidence-based estimates of burden are provided as additional information in the Supplementary Material.
The present analysis did not include the costs of diabetes therapy, as the aim was to evaluate the cost of complications associated with poor glycemic control and providing an accurate estimate of treatment costs was not possible within the context of the analysis. It is noteworthy that additional healthcare spending on glucose-lowering therapy would be required for intensification and is, potentially, justified by the findings of this study. Providing an accurate estimate of therapy costs is challenging, given the wide array of therapeutic options currently available to manage patients with type 2 diabetes and the individual variation in optimizing patients’ therapy to make the HbA1c improvements described in the present analysis. Evaluating these costs, perhaps using a real-life cohort stratified by HbA1c level to compare the use of different therapies and associated costs, could represent an interesting future avenue of research. Similarly, the routine costs of management of diabetes patients were not included in the present study. Whilst these costs would be expected to be the same in patients in good glycemic control and those in poor control, the survival paradox (whereby patients who live longer cost more and are at risk of complications for a longer period) may mean that patients in good glycemic control accrue slightly higher routine management costs than their counterparts in poor glycemic control, although this would be expected to only have a very modest impact on the outcomes of the analysis.
Conclusions
It is well established that the clinical and economic burden of poor glycemic control in type 2 diabetes in the UK is substantial. The present modeling analysis indicates that efforts to avoid delaying treatment intensification could reduce the economic burden associated with diabetes-related complications. With published estimates suggesting that over 40% of patients with type 2 diabetes in the UK have an HbA1c level ≥7% (53 mmol/mol), there is a clear need to encourage earlier intensification and address issues around therapeutic inertiaCitation 11 , Citation 13 . Model projections indicate that the benefits of intensification would already be substantial at a population level after only 3 years, and would continue to accumulate over patients’ lifetimes.
Correction Statement
This article has been republished with minor changes. These changes do not impact the academic content of the article.
Transparency
Declaration of funding
This work was funded by Novo Nordisk A/S.
Declaration of financial/other interests
SCB has received research grants (including principal investigator, collaborator or consultant) from Healthcare and Research Wales (Welsh Government) and Novo Nordisk; has received other research support and honoraria from Boehringer Ingelheim, Eli Lilly, Merck, Novo Nordisk and Sanofi; and has ownership interest in Glycosmedia (diabetes on-line news service). BBH and BC are employees and shareholders of Novo Nordisk. JME peer reviewers on this manuscript have no relevant financial or other relationships to disclose.
Author contributions
WJV and BH were involved in the design of the study, modeling work and data analysis. WJV drafted the paper and BH reviewed critically for intellectual content. SB was involved in interpretation, reviewing and revising the paper critically for intellectual content. BBH and BC were involved in design of the study, interpretation and reviewed critically for intellectual content. BC, WJV, BH, BBH and BC all agree to be accountable for all aspects of the work.
Supplemental Material
Download MS Word (225.2 KB)Acknowledgements
None reported.
Related Research Data
References
- World Health Organization [Internet]. Global Report on Diabetes; 2016 [cited 2019 May 14]. Available from: https://www.who.int/diabetes/global-report/en/
- Diabetes UK News [Internet] . Number of people with diabetes reaches 4.7 million; 2019 Feb 27 [cited 2019 May 14]. Available from: https://www.diabetes.org.uk/about_us/news/new-stats-people-living-with-diabetes.
- Hex N , Bartlett C , Wright D , et al. Estimating the current and future costs of Type 1 and Type 2 diabetes in the UK, including direct health costs and indirect societal and productivity costs. Diabet Med. 2012;29:855–862.
- Ismail-Beigi F , Craven T , Banerji MA , et al. Effect of intensive treatment of hyperglycaemia on microvascular outcomes in type 2 diabetes: an analysis of the ACCORD randomised trial. Lancet. 2010;376:419–430.
- ADVANCE Collaborative Group, Patel A , MacMahon S , et al. Intensive blood glucose control and vascular outcomes in patients with type 2 diabetes. N Engl J Med. 2008;358:2560–2572.
- Intensive blood-glucose control with sulphonylureas or insulin compared with conventional treatment and risk of complications in patients with type 2 diabetes (UKPDS 33). UK Prospective Diabetes Study (UKPDS) Group. Lancet. 1998;352:837–853.
- Holman RR , Paul SK , Bethel MA , et al. 10-year follow-up of intensive glucose control in type 2 diabetes. N Engl J Med. 2008;359:1577–1589.
- Stettler C , Allemann S , Jüni P , et al. Glycemic control and macrovascular disease in types 1 and 2 diabetes mellitus: Meta-analysis of randomized trials. Am Heart J. 2006;152:27–38.
- NICE [Internet]. Type 2 diabetes in adults: management (NG28); 2015 [cited 2019 May 14]. Available from: https://www.nice.org.uk/guidance/ng28/resources/type-2-diabetes-in-adults-management-pdf-1837338615493.
- Khunti K , Millar-Jones D . Clinical inertia to insulin initiation and intensification in the UK: a focused literature review. Prim Care Diabetes. 2017;11:3–12.
- Khunti K , Gomes MB , Pocock S , et al. Therapeutic inertia in the treatment of hyperglycaemia in patients with type 2 diabetes: a systematic review. Diabetes Obes Metab. 2018;20:427–437.
- Khunti K , Nikolajsen A , Thorsted BL , et al. Clinical inertia with regard to intensifying therapy in people with type 2 diabetes treated with basal insulin. Diabetes Obes Metab. 2016;18:401–409.
- Khunti K , Wolden ML , Thorsted BL , et al. Clinical inertia in people with type 2 diabetes: a retrospective cohort study of more than 80,000 people. Diabetes Care. 2013;36:3411–3417.
- NHS Digital [Internet] . National Diabetes Audit, 2016-17. Report 1: care processes and treatment targets. England and Wales; 2018 Mar 14 [cited 2019 May 14]. Available from: https://files.digital.nhs.uk/pdf/s/k/national_diabetes_audit_2016-17_report_1__care_processes_and_treatment_targets.pdf.
- de Pablos-Velasco P , Parhofer KG , Bradley C , et al. Current level of glycaemic control and its associated factors in patients with type 2 diabetes across Europe: data from the PANORAMA study. Clin Endocrinol (Oxf). 2014;80:47–56.
- NHS Scotland [Internet] . Scottish Diabetes Survey Monitoring Group. Scottish Diabetes Survey 2016; [cited 2019 May 14]. Available from: https://www.diabetes.org.uk/resources-s3/2017-09/Scottish%20Diabetes%20Survey%202016.pdf?_ga=2.231129370.468428599.1505127410-1295258485.1505127410.
- Palmer AJ , Roze S , Valentine WJ , et al. Validation of the CORE Diabetes Model against epidemiological and clinical studies. Curr Med Res Opin. 2004;20: S27–S40.
- McEwan P , Foos V , Palmer JL , et al. Validation of the IMS CORE Diabetes Model. Value Health. 2014;17:714–724.
- Palmer AJ , Roze S , Valentine WJ , et al. The CORE Diabetes Model: projecting long-term clinical outcomes, costs and cost-effectiveness of interventions in diabetes mellitus (types 1 and 2) to support clinical and reimbursement decision-making. Curr Med Res Opin. 2004;20: S5–S26.
- World Health Organisation [Internet] . Global Health Observatory data repository: life tables by country (United Kingdom); 2019 [cited 2019 May 14]. Available from: http://apps.who.int/gho/data/view.main.LT62260?lang=en.
- Clarke PM , Gray AM , Briggs A , et al. A model to estimate the lifetime health outcomes of patients with type 2 diabetes: the United Kingdom Prospective Diabetes Study (UKPDS) Outcomes Model (UKPDS no. 68). Diabetologia. 2004;47:1747–1759.
- NICE [Internet]. NICE guideline [NG28]. Type 2 diabetes in adults: management. Appendix F, Table 20, pages 45/46; 2017 May [cited 2019 May 14]. Available from: https://www.nice.org.uk/guidance/NG28/documents/type-2-diabetes-appendix-f
- Pratley RE , Nauck M , Bailey T , et al. Liraglutide versus sitagliptin for patients with type 2 diabetes who did not have adequate glycaemic control with metformin: a 26-week, randomised, parallel-group, open-label trial. Lancet. 2010;375:1447–1456.
- Office for National Statistics [Internet]. Adult smoking habits in the UK; 2016 [cited 2019 May 14]. Available from: https://www.ons.gov.uk/peoplepopulationandcommunity/healthandsocialcare/healthandlifeexpectancies/bulletins/adultsmokinghabitsingreatbritain/2016#smoking-habits-in-the-uk-its-constituent-countries-and-local-areas-using-data-from-the-annual-population-survey-2010-to-2016-adults-aged-18-and-over
- World Health Organisation [Internet] . Global alcohol report; 2014 [cited 2019 May 14]. Available from: http://www.who.int/substance_abuse/publications/global_alcohol_report/profiles/gbr.pdf
- Sørensen J , Ploug UJ . The cost of diabetes-related complications: registry-based analysis of days absent from work. Econ Res Int. 2013;2013:1–8.
- Diabetes UK [Internet] . Diabetes: facts and stats; 2014 Mar [cited 2019 May 14]. Available from: https://www.diabetes.org.uk/resources-s3/2017-11/diabetes-key-stats-guidelines-april2014.pdf
- Zghebi SS , Steinke DT , Carr MJ , et al. Examining trends in type 2 diabetes incidence, prevalence and mortality in the UK between 2004 and 2014. Diabetes Obes Metab. 2017;19:1537–1545.
- Diabetes UK [Internet] . Nearly 7,000 children and young adults with Type 2 Diabetes [cited 2019 May 14]. Available from: https://www.diabetes.org.uk/about-us/news/children-young-adults-type-2-rise
- Baxter M , Hudson R , Mahon J , et al. Estimating the impact of better management of glycaemic control in adults with Type 1 and Type 2 diabetes on the number of clinical complications and the associated financial benefit. Diabet Med. 2016;33:1575–1581.
- Gaede P , Oellgaard J , Carstensen B , et al. Years of life gained by multifactorial intervention in patients with type 2 diabetes mellitus and microalbuminuria: 21 years follow-up on the Steno-2 randomised trial. Diabetologia. 2016;59:2298–2307.
- Lipska KJ , Warton EM , Huang ES , et al. HbA1c and risk of severe hypoglycemia in type 2 diabetes. The diabetes and aging study. Diabetes Care. 2013;36:3535–3542.
- Mohan V , Cooper ME , Matthews DR , et al. The standard of care in type 2 diabetes: re-evaluating the treatment paradigm. Diabetes Ther. 2019;10:1–13.