
Abstract
Aims: To evaluate the risk-of-hospitalization (ROH) models developed at Blue Cross Blue Shield of Louisiana (BCBSLA) and compare this approach to the DxCG risk-score algorithms utilized by many health plans.
Materials and Methods: Time zero for this study was December 31, 2016. BCBSLA members were eligible for study inclusion if they were fully insured; aged 80 years or younger; and had continuous enrollment starting on or before June 1, 2016, through time zero. Up to 2 years of historical claims data from time zero per patient was included for model development. Members were excluded if they had cancer, renal failure, or were admitted for hospice. The Blue Cross ROH models were developed using (1) regularized logistic regression and (2) random decision forests (a tree ensemble learning classification method). All models were generated using Scikit-learn: Machine Learning in Python. Prognostic capabilities of DxCG risk-score algorithms were compared to those of the Blue Cross models.
Results: When stratifying by the top 0.1% of members with the highest ROH, the Blue Cross logistic regression model had the highest area under the receiving operator characteristics curve (0.862) based on the result of 10-fold cross-validation. The Blue Cross random decision forests model had the highest positive predictive value (49.0%) and positive likelihood ratio (61.4), but sensitivity, specificity, negative predictive values, and negative likelihood ratios were similar across all four models.
Limitations: The Blue Cross ROH models were developed and evaluated using BCBSLA data, and predictive power may fluctuate if applied to other databases.
Conclusions: The predictability of the Blue Cross models show how member-specific, regional data can be used to accurately identify patients with a high ROH, which may allow healthcare workers to intervene earlier and subsequently reduce the healthcare burden for patients and providers.
Introduction
Potentially avoidable hospitalizations for chronic and acute conditions have been on the decline in the United States; however, avoidable hospitalizations are still very common and carry a significant clinical and economic burdenCitation1,Citation2. Except for chronic obstructive pulmonary disease (COPD), the rate of potentially avoidable hospitalizations for all other conditions decreased from about 1,600 Americans per 100,000 in 2005 to over 1,200 per 100,000 in 2013Citation1. Early intervention and effective primary care are paramount in preventing otherwise unnecessary hospitalizationsCitation1 and for lowering subsequent healthcare costsCitation2.
Interventions designed to prevent expensive, downstream healthcare utilization exhibit differing degrees of effectiveness, i.e. some patients benefit from given interventions more than others. For example, hospitalizations are difficult to avoid for patients who are very sick, while for other, healthier patients, hospitalizations are rare. Interventions can reduce the likelihood of hospitalization and the accompanying use of claims resources in patients who are ‘in-between’ very sick and fairly healthy; however, to reduce avoidable care, at-risk patients must be accurately identified. Predictive analytic models that leverage member-level data, which include recent medical-history and socioeconomic indicators, are commonly used to classify patients into high-, medium-, and low-risk groups based on their risk of hospitalization (ROH) over a given period.
Current commercially available models
Health plans currently use several commercially-available, predictive models, examples of which include the Cost of Care ModelCitation3 (Truven Health Analytics, an IBM Company) and DxCG IntelligenceCitation4 (Cotiviti, formerly Verisk Health). These ‘off-the-shelf’ risk models are similar in that they use healthcare data to assign individual risk-scores to patients for both concurrent and prospective diagnoses. The Truven model predicts the potential healthcare utilization for a specific patient population and estimates both retrospective and future-expected healthcare payments for a commercially-insured population. The DxCG models (140 different models) include models for the likelihood of hospitalization and the likelihood of emergency department (ED) visits. These models can be specified for commercial, Medicare, and Medicaid populations and are grouped into three functions: (1) budgeting and underwriting, (2) medical management, and (3) performance assessment.
The Adjusted Clinical Group (ACG) SystemCitation5 from Johns Hopkins University also produces concurrent and prospective models, much like the Truven and DxCG models; however, the ACG models emphasize collective morbidities rather than individual disease categories. These models measure the burden of morbidity that is associated with patient populations based on disease patterns, which are derived from diagnostic or pharmaceutical codes from insurance claims or electronic medical records. Similar models are also put out by 3 M Health Information Systems and OptumCitation6. Another model, the Department of Health and Human Services – Hierarchical Condition Categories (HHS-HCC) modelCitation7, was developed for the commercial payer population in the post-Affordable Care Act commercial marketplace. This model provides HCC groupings of health conditions by payments; then, primary diagnosis codes are mapped into different HCCs for chronic conditions like diabetes and heart failure.
While the aforementioned commercial models are all effective in their intended application, many seek broad applications across different health plans with different standards of data collection. Consequently, they often rely on a narrow set of widely-collected and consistently-measured data, ignoring potentially valuable structured and unstructured data. We aim to incorporate some of this relatively-untapped data from a single-payer database to develop a predictive ROH model.
Study objectives
In this paper, we study the predictability of an ROH model developed by Blue Cross Blue Shield of Louisiana (BCBSLA) that relies heavily on natural language processing and machine learning techniques in addition to commonly used predictors to calculate whether a patient is likely to have a hospitalization in the next 6 months. We begin by describing the modeling approach developed by BCBSLA and evaluating its predictive power in comparison to the highly popular ‘off-the-shelf’ DxCG models.
Methods
Inclusion criteria
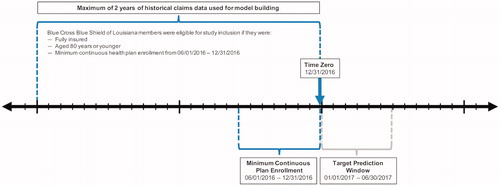
Time zero for this study was December 31, 2016 (). BCBSLA members were eligible for study inclusion if they were fully insured; aged 80 years or younger; and had continuous enrollment starting on or before June 1, 2016, through time zero (i.e. members who did not have continuous enrollment from June 1, 2016, through December 31, 2016, were excluded). If available, a maximum of 2 years of historical claims data from time zero (with a ‘buffer zone’ of 2 weeks) was included from each patient for model development (i.e. all available claims data per patient between January 1, 2015, and time zero). Members were excluded from model development if they had a diagnosis of cancer, were admitted for hospice, or had renal failure to help ensure that only members with potentially preventable hospitalizations were analyzed. All member data used for model development and evaluation were anonymized.
Figure 1. Schematic of Patient Selection. This diagram offers a visual depiction of the patient selection criteria for inclusion in model development. Time zero was December 31, 2016. Fully-insured members aged 80 years or younger who, at a minimum, had continuous enrollment from June 1, 2016, through December 31, 2016, were included. All available claims data per patient between January 1, 2015, and time zero were incorporated into the model.
Blue Cross ROH model
The Blue Cross ROH model defined hospitalizations as all inpatient admissions except maternity, elective surgery, trauma, and rehabilitation visits. Investigators used a 6-month window (January 1, 2017, through June 30, 2017) as a target for predicting hospitalizations. The ROH model developed by BCBSLA produced a value between 0 (lowest predicted ROH) and 1 (highest predicted ROH) for each member. BCBSLA member data were then used to validate the predictive power of their ROH model by assigning members into 1,000 buckets (tiles) where ‘Tile = 1’ is equivalent to the top 0.1%, and ‘Tile ≤ 10’ is equivalent to the top 1%. ‘Tile = 1’ contained the members with the highest risk. The models were evaluated using tiles because only a small portion of the population is hospitalized; therefore, the focus is not on overall model performance, but the performance of the model around a narrowly-identified segment of the population.
The Blue Cross ROH model pulled codes from the database in the form of raw claims. Raw claims data were then grouped at a patient-level using Python. Codes used within the 2-year claim history included the following: diagnosis codes (1–25 placement), drug base-name codes, diagnosis-related groups (DRGs), servicing provider codes, and specialty codes. Model inputs included member demographics (e.g. sex, age, marital status, primary subscriber or dependent, and geographic locations [at the zip-code level]); patient comorbidities; basic health metrics (e.g. weight, height, body mass index [BMI]); previous healthcare utilization (e.g. past ED visits and hospital readmissions); and healthcare market characteristics.
The benefit details for each member – whether or not BCBSLA is the primary payer, if Medicare is the primary payer, if the member is from an exchange, as well as information about the type of group plan and line of business – also served as model inputs. Additionally, the model accounted for membership details, such as the number of persons covered under the primary member and what additional coverage exists (e.g. did the member also have vision and dental); and, healthcare utilization over a 2-year period, which included all diagnosis codes, servicing providers, admitting DRGs, and pharmacy drug claims. Members were categorized into the following clinical episodes of care if they had claims for any of the following diseases: asthma, burns, congestive heart failure (CHF), chronic kidney disease (CKD), COPD, cancer, Crohn’s Disease, cystic fibrosis, diabetes, glaucoma, HIV, other heart conditions, hepatitis c, hypertension, blood disorders, low back pain, spine pain, metabolic disorders, multiple sclerosis, and renal failure. Clinical episodes were created for distinct time windows: 0–1 month, 2–6 months, 7–12 months, and 13–24 months. Medical allowed-amounts by different claim categories were also incorporatedCitation8. Categories included, but were not limited to, medical, surgical, maternity, psychiatric, emergency, radiology, etc. A comprehensive list of all categories is provided in Appendix A.
BCBSLA utilized two different methodologies to produce their ROH model. A more traditional approach involved implementing a regularized, logistic regression (LR)-model, which can handle both dense and sparse input. The second model utilized random decision forests (RFs), which are a tree ensemble learning classification method. One benefit of the RF methodology is that it corrects for decision trees’ habit of model overfitting in the training set. All models were generated using Scikit-learn: Machine Learning in PythonCitation9.
Comparator – DxCG models
Researchers repeated the same analysis using 2 DxCG risk-score algorithms to compare the prognostic capabilities of the models. Two of the DxCG models were used as a comparison to the Blue Cross ROH model: (1) the All Medical Predicting Concurrent Total Risk (DxCG Model 18), and (2) Prescription + All Medical Predicting Prospective Likelihood of Hospitalization Excluding Obstetrics and Neonate (DxCG Model 71)Citation8.
DxCG Models are designed for commercially-insured populations of all ages, but less than 1% are aged 65 years or above. DxCG predicts the likelihood of at least one future hospitalization in the following 6 months, except for admissions related to maternity. Models calculate the ROH for a member over the next 6 months based on claims data during the baseline period. The DxCG models are derived from multivariable LRs, and patients are assigned a score between 0 and 1. All demographic, medical claims, and outpatient pharmacy data from all encounters are required to run the DxCG models.
Results
This analysis compared the Blue Cross ROH model to the commercially available DxCG models 18 and 71 using 2 separate methodologies, LR and RF. A total of 1,055,099 BCBSLA members met all inclusion criteria and were used for model validation. shows the results of each models’ overall predicted ROH (%), the mean (SD) of the area under the receiving operator characteristics curve (AUROC), as well as the statistical significance of each AUROC for the Blue Cross ROH models against the DxCG models using 10-fold, cross-validation data; that is, 10 versions of the model-fit statistics that vary depending on the random subset of data on which each model was trained and evaluated.
Table 1. Overall model comparisons.
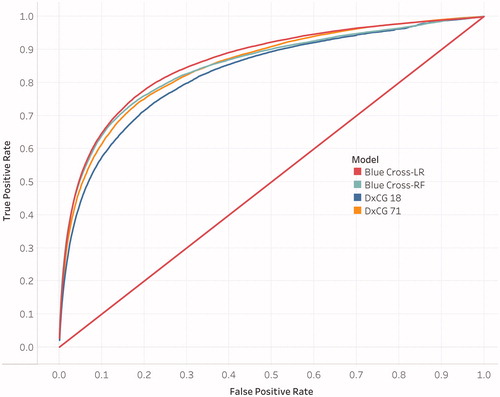
The AUROC for the Blue Cross-LR model was the largest (0.862) compared to both DxCG models and the Blue Cross-RF model. Furthermore, the one-sided t-test showed statistical significance (p < .001) for the Blue Cross-LR model when compared to both DxCG models. The AUROC for the Blue Cross-RF model was close to the AUROC for the DxCG model 71 (0.848 versus 0.849, respectively), but did not show statistical significance in the one-sided t-test (p = .325); however, the AUROC for the Blue Cross-RF model did show statistical significance to the DxCG model 18 (p < .001). Both Blue Cross ROH models predicted a slightly lower overall ROH compared to both DxCG models. represents the average ROC curve of all 10 cross-validation runs for each of the 4 models represented in .
Figure 2. Receiving Operator Characteristics (ROC) Curves for the 4 Models. The ROC curve for each model is fit to a future hospitalization and the area under the ROC curve is the highest of all 10 cross-validation runs.
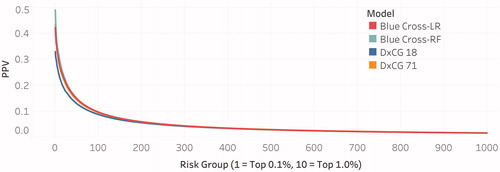
compares the positive predictive values (PPVs) for all four models and is a function of risk-levels for BCBSLA members. Risk levels were binned into 1,000 buckets (tiles), where ‘Tile = 1’ denotes the highest risk members and contains 0.1% of the sample population, and ‘Tile ≤10’ denotes high-risk members in the top 1% of the sample population.
Figure 3. Positive Predictive Value (PPV) Curves for the 4 Models. PPV curves represent the average of the PPV values across all 10-fold cross-validations for each model.
provides a summary of statistical, diagnostic metrics for all four models by the top risk tiles (0.1% and 1.0%). When applied to the validation cohort, the Blue Cross-RF model appears to outperform the other three models when considering the PPV, positive likelihood ratio (PLR), and sensitivity. In the highest tile (0.1%), the Blue Cross-RF model had a PPV of 49.0% compared to DxCG model 71 (PPV = 43.0%) and DxCG model 18 (PPV = 33.0%). Furthermore, the PLR, an indication of test performance independent of baseline risk, is relatively high for the Blue Cross-RF model at 61.4 versus DxCG model 71 (48.0) and DxCG model 18 (31.1). By contrast, the negative likelihood ratios (NLRs) were similar at the 0.1% and 1.0% tiles, where the NLR for the Blue Cross-RF model was 0.97 and 0.81 for tile 0.1 and 1.0% respectively and the NLR for DxCG model 71 was 0.97 and 0.83 for tile 0.1% and 1.0% respectively.
Table 2. Summary of Positive Predictive Values (PPVs) by risk level.
All 4 models exhibited nearly identical specificity and negative predictive values (NPVs) for the 0.1 and 1.0% tiles. Across all models for the 0.1% tile, specificity was about 99.9%, and the NPV was about 98.5%.
Discussion
BCBSLA has developed a predictive ROH model to identify members who are likely to be hospitalized in the next 6 months. The model, which implemented natural language processing and machine learning, was first validated using BCBSLA data, albeit a different dataset than that from which the model was generated. When applied to the validation cohort and after stratifying by the top 0.1% highest risk members, the 2 Blue Cross ROH models had comparable predictive power to 2 of the leading, proprietary ROH models currently in use by healthcare professionals.
Overall, the Blue Cross-RF model had slightly better predictive power compared to the other models. However, the AUROC curve was strongest for the Blue Cross-LR model at 0.862 and was significantly higher than the AUROC curve for DxCG model 71 (0.849) and DxCG model 18 (0.828). By contrast, the Blue Cross-RF model AUROC (0.848) was not significantly different from the AUROC for DxCG model 71 (0.849) but was significantly larger than the AUROC for DxCG model 18 (0.828).
The Blue Cross-RF model performed more favorably in other diagnostics. It had the highest PPV in the 0.1% tile (49.0%) compared to the DxCG model 71 (PPV of 43.0%), the Blue Cross-LR model (PPV of 42.0%) and the DxCG model 18 (PPV of 33.0%). Furthermore, the Blue Cross-RF model had a higher PLR than all other models for both the 0.1% and 1.0% tiles. With a PLR of 61.4 in the 0.1% tile, the Blue Cross-RF model is over 60 times as likely to predict a hospitalization for a patient that was hospitalized versus predicting a hospitalization for a patient who was not hospitalized.
While the Blue Cross-RF model was the most sensitive for both the 0.1% and 1.0% tiles at 3.2% and 19.9%, respectively, all models had relatively low sensitivity. For the 0.1% tile, the sensitivity for the Blue Cross-LR model, the DxCG model 71, and the DxCG model 18 was 2.8%, 2.7%, and 2.1%, respectively. The specificity and NPVs across all four models were nearly identical, indicating that all models have high, true-negative rates and have a high probability that, for the higher-risk patients, a negative prediction will most likely not result in a hospitalization.
The Blue Cross models had similar or slightly higher metrics compared to proprietary, ‘off-the-shelf’ DxCG models, illustrating how member-specific, regional data can be used to predict patients with a high ROH relatively accurately and be used comparably to popular predictive models currently in widespread use. Identifying these patients early-on could give medical professionals the ability to intervene and possibly avoid unnecessary admissions, which in turn reduces the healthcare burden for both the patient and provider.
Limitations
Our study has several key limitations that must be addressed. First, the Blue Cross ROH models were developed and evaluated using BCBSLA data, so predictive power may fluctuate if applied to other databases and populations. Additionally, the model was developed using a fully-insured patient population, which is not representative of the United States (in 2017, 8.8% of Americans were not insuredCitation10). The Blue Cross ROH Model should be tested in other databases to prove its generalizability. Another limitation of this analysis is that the comparator DxCG models were generated using a younger population (the vast majority of patients were aged under 60 years), whereas the Blue Cross ROH models better represent older age groups; however, since both models account for age, we believe the performance measurements are still comparable.
Next steps
BCBSLA plans to enhance their ROH models with additional social determinants of health. These social drivers of adverse events, which will be retrieved from external data sources, will provide more data to inform future models and assist clinical staff in developing interventions. Social determinants related to member’s health behavior (smoking, physical activity, obesity), environment (air quality, walking index), housing (area home values, vacant homes), and socioeconomic metrics (education, employment rate, income) can be derived by estimating social metrics for the geographic regions where the members reside (ZIP, Parish/County, BlockGroup, Tract) and imputing the regional estimates based on the member’s address. Understanding the social strata of members will assist BCBSLA’s clinical staff in deploying intervention strategies that are relevant to the individual. Combining these characteristics to enhance the ROH models will ideally help prevent potentially avoidable hospitalizations – saving lives and reducing costs.
Researchers are also interested in testing the Blue Cross ROH models using an external database because, as mentioned, a fundamental limitation of this study is that the Blue Cross ROH models were developed and evaluated using BCBSLA data. Lastly, now that BCBSLA can accurately recognize patients with a high ROH within a reasonable degree of certainty, best practices and intervention strategies for preventing potentially avoidable hospitalizations will need to be evaluated.
Conclusions
The ROH model developed by BCBSLA has proven to be predictive with high levels of accuracy, comparable to the popular DxCG models. However, now that patients with a high ROH can be accurately identified, further studies will need to focus on finding out which of those patients will benefit the most from a given intervention to prevent potentially avoidable hospitalizations. By having the ability to recognize high ROH members in advance, case- and disease-management programs can potentially mitigate clinical events, save lives, and reduce costs.
Transparency
Declaration of funding
This research was performed by Blue Cross Blue Shield of Louisiana and did not receive any specific grant from outside funding agencies in the public, commercial, or not-for-profit sectors.
Declaration of financial/other interests
This research was performed internally by Blue Cross Blue Shield of Louisiana, and authors did not have any competing financial interests or outside funding. JME peer reviewers on this manuscript have no relevant financial or other relationships to disclose.
Author contributions
JH and CN developed the model, performed the analyses, and drafted the paper; XY, YZ, and JO contributed to analysis and critical paper revisions; DC, JC, TB, VW, and SN supported data interpretation.
Previous presentations
A version of this research was presented as a poster at the 2019 International Society for Pharmacoeconomics and Outcomes Research (ISPOR) conference in New Orleans, Louisiana.
Acknowledgements
No assistance in the preparation of this article is to be declared.
Related Research Data
References
- Potentially avoidable hospitalizations. Rockville (MD): Agency for Healthcare Research and Quality; Last Updated June 2018. https://www.ahrq.gov/research/findings/nhqrdr/chartbooks/carecoordination/measure3.html
- Moy E, Chang E, Barrett M, et al. Potentially preventable hospitalizations – United States, 2001–2009. MMWR. 2013;62(3):139–143.
- The IBM cost of care model: using claims data to help predict healthcare resource consumption. Somers (NY): IBM Watson Health; 2018. https://www.ibm.com/downloads/cas/W62MR7MD
- The Evolution of DxCG, the gold standard in risk adjustment and predictive modeling. Waltham, MA: Cotiviti; 2016. https://resources.cotiviti.com/white-paper/the-evolution-of-dxcg
- The Johns Hopkins ACG® System: white paper. Baltimore (MD): Johns Hopkins University; 2018. https://www.healthy.works/wp-content/uploads/2018/11/The-Johns-Hopkins-ACG-System-White-Paper-SMALLER.pdf
- Hileman G, Steele S. Accuracy of claims-based risk scoring models. Schaumburg, Illinois: Society of Actuaries; 2016. https://www.soa.org/globalassets/assets/files/research/research-2016-accuracy-claims-based-risk-scoring-models.pdf
- Pope GC, Kautter J, Ingber MJ, et al. Evaluation of the CMS-HCC risk adjustment model. Maryland: Centers for Medicare and Medicaid in Baltimore; 2011.
- DxCG intelligence model directory verisk health. Waltham (MA): Verisk Health; 2014.
- Pedregosa F, Varoquaux G, Gramfort A, et al. Scikit-learn: machine learning in Python. J Mach Learn Res. 2011;12:2825–2830.
- Berchick ER, Hood E, Barnett JC. Health insurance coverage in the United States, Current Population Reports, p. 60–264. 2017. U.S. Government Printing Office, Washington, DC, 2018. https://www.census.gov/content/dam/Census/library/publications/2018/demo/p60-264.pdf
Appendix A: Claim categories
FIP Medical – General
FIP Medical – Rehabilitation
FIP Surgical
FIP Psychiatric – Hospital
FIP Psychiatric – Residential
FIP Alcohol and Drug Abuse – Hospital
FIP Alcohol and Drug Abuse – Residential
FIP Mat Norm Delivery
FIP Mat Norm Delivery – Mom\Baby Cmbnd
FIP Mat Csect Delivery
FIP Mat Csect Delivery – Mom\Baby Cmbnd
FIP Well Newborn – Normal Delivery
FIP Well Newborn – Csect Delivery
FIP Well Newborn – Unknown Delivery
FIP Other Newborn
FIP Maternity Non-Delivery
FIP SNF
FOP Other Observation
FOP Emergency Room – Hospital
FOP Emergency Room – Urgent Care
FOP Surgery – Hospital Outpatient
FOP Surgery – Ambulatory Surgery Center
FOP Radiology General – Therapeutic
FOP Radiology General – Diagnostic
FOP Radiology – CT/MRI/PET – CT Scan
FOP Radiology – CT/MRI/PET – MRI
FOP Radiology – CT/MRI/PET – PET
FOP Pathology/Lab
FOP Pharmacy – General
FOP Pharmacy – Chemotherapy
FOP Cardiovascular
FOP PT/OT/ST
FOP Psychiatric – Partial Hospitalization
FOP Psychiatric – Intensive Outpatient
FOP Alcohol & Drug Abuse – Partial Hospitalization
FOP Alcohol & Drug Abuse – Intensive Outpatient
FOP Other – General
FOP Other – Blood
FOP Other – Clinic
FOP Other – Diagnostic
FOP Other – Dialysis
FOP Other – DME/Supplies
FOP Other – Trtmt/SpcltySvcs
FOP Other – Pulmonary
FOP Preventive – General
FOP Preventive – Colonoscopy
FOP Preventive – Mammography
FOP Preventive – Lipid Panel
PROF Inpatient Surgery
PROF Inpatient Anesthesia
PROF Outpatient Surgery
PROF Office Surgery
PROF Outpatient Anesthesia
PROF Maternity – Normal Deliveries
PROF Maternity – Cesarean Deliveries
PROF Maternity – Non-Deliveries
PROF Maternity – Ancillary
PROF Maternity – Anesthesia
PROF Inpatient Visits – Medical
PROF Inpatient Visits – Psychiatric
PROF Inpatient Visits – Alcohol and Drug Abuse
PROF Office/Home Visits – PCP
PROF Office/Home Visits – Specialist
PROF Urgent Care Visits
PROF Office Administered Drugs – General
PROF Office Administered Drugs – Chemotherapy
PROF Allergy Testing
PROF Allergy Immunotherapy
PROF Miscellaneous Medical – General
PROF Miscellaneous Medical – Gastroenterology
PROF Miscellaneous Medical – Ophthalmology
PROF Miscellaneous Medical – Otorhinolaryngology
PROF Miscellaneous Medical – Vestibular Function Tests
PROF Miscellaneous Medical – Non-Invas. Vasc. Diag. Studies
PROF Miscellaneous Medical – Pulmonology
PROF Miscellaneous Medical – Neurology
PROF Miscellaneous Medical – Central Nervous System Tests
PROF Miscellaneous Medical – Dermatology
PROF Miscellaneous Medical – Dialysis
PROF Preventive Other – General
PROF Preventive Other – Colonoscopy
PROF Preventive Other – Mammography
PROF Preventive Other – Lab
PROF Preventive Immunizations
PROF Preventive Well Baby Exams
Pharmacy Generic
Pharmacy Unknown
Applied Behavioral Analysis
FOP ER Observation