
Abstract
Aims: This study aimed to evaluate all-cause economic outcomes, healthcare resource utilization (HRU), and costs in patients with Clostridioides difficile infection (CDI) and recurrent CDI (rCDI) using commercial claims from a large database representing various healthcare settings.
Materials and methods: A retrospective analysis of commercial claims data from the IQVIA PharMetrics Plus database was conducted for patients aged 18–64 years with CDI episodes requiring inpatient stay with CDI diagnosis code or an outpatient medical claim for CDI plus a CDI treatment. Index CDI episodes occurred between 1 January 2010 and 30 June 2017, including only those where patients were observable 6 months before and 12 months after the index episode. Each CDI episode was followed by a 14-d claim-free period. rCDI was defined as another CDI episode within an 8-week window following the claim-free period. HRU, all-cause direct medical costs and time to rCDI were calculated over 12 months and stratified by number of rCDI episodes.
Results: A total of 46,571 patients with index CDI were included. Mean time from one CDI episode to the next was approximately 1 month. In the 12-month follow-up period, those with no recurrence had 1.4 inpatient visits per person and those with 3 or more recurrences had 5.8. Most patients with 3 or more recurrences had 2 or more hospital admissions. The mean annual, total all-cause direct medical costs per patient were $71,980 for those with no recurrence and $207,733 for those with 3 or more recurrences.
Limitations: The study included individuals 18–64 years only. A stringent definition of rCDI was used, which may have underestimated the incidence of rCDI.
Conclusions: CDI and rCDI are associated with substantial healthcare resource utilization and direct medical costs. Timing of recurrences can be predictable, providing a window of opportunity for interventions. Prevention of multiple rCDI appears essential to reduce healthcare costs.
Introduction
Clostridioides difficile infection (CDI) is the most common healthcare-associated infection occurring in United States (US) hospitalsCitation1,Citation2. The Centers for Disease Control and Prevention (CDC) have labelled CDI as a “major health threat” because of the severity of symptoms, the all-cause mortality rate, the potential for antibiotic resistance, and the recurrence rate in patients who suffer CDICitation3.
It is estimated that approximately 450,000 cases of CDI occur each year in the US, with increasing incidence over the last two decadesCitation2,Citation4. CDI recurs in approximately 25% of patients treated for an initial episode and in up to 40–65% of patients who had a prior recurrent CDI (rCDI)Citation2,Citation5. Known risk factors for an initial CDI episode include recent systemic antimicrobial therapy, older age (≥65 years), healthcare exposure, and underlying chronic comorbidities, among othersCitation6. Risk factors for rCDI are largely the same, but also include previous CDI severity, and presence of hypervirulent strain, NAP1/BI/027Citation7,Citation8.
The annual economic cost of all CDI in the US is estimated to be $5.4 billion, with $4.7 billion of the costs incurred in healthcare settingsCitation9. Likewise, rCDI is estimated to cost $2.8 billion annually, approximately half of all CDI costsCitation10. Direct medical costs, including inpatient costs, are the main drivers of the overall economic burden of CDICitation2. One means of reducing the overall healthcare burden of CDI is to reduce the number of patients who experience rCDI episodes.
Many of the economic studies may underestimate the burden of CDI on the healthcare system as the underlying data are based on CDI diagnosed and treated only in acute-care hospitalsCitation11. The objective of this study was to evaluate economic outcomes, all-cause healthcare resource utilization (HRU), and all-cause costs in patients with CDI and rCDI using a large commercial healthcare claims data source covering patients treated in different types of healthcare settings and hospitals. Real-world analysis of clinical outcomes in patients with CDI and rCDI will be reported in a separate manuscript.
Materials and methods
Study design
This longitudinal, retrospective study used real-world data from the PharMetrics Plus database (IQVIA; Durham, NC), which contains claims, enrolment, and demographic data for more than 140 million individuals with commercial insurance coverage throughout the US, with coverage of data from over 90% of hospitals and over 90% of all US doctors. Patients in the PharMetrics Plus database are representative of the national, commercially-insured population in terms of age and gender for individuals <65 years. The database includes all adjudicated medical and prescription drug claims from more than 100 health plans. It includes both inpatient and outpatient claims, diagnoses and procedures based on International Classification of Diseases 9th Revision, Clinical Modification (ICD-9-CM) and International Classification of Diseases, 10th Revision, Clinical Modification (ICD-10-CM), and Current Procedural Terminology (CPT) codes, as well as retail and mail-order pharmacy claims.
Study population
Individuals were included in the study if they were between the ages of 18 and 64 years, continuously enrolled, and had at least one inpatient claim with a diagnosis of CDI (ICD-9-CM code: 008.45; ICD-10-CM codes: A04.7, A04.71, or A04.72), or one outpatient medical claim with CDI diagnosis code plus a CDI treatment. Treatment was defined as a prescription for an antibiotic used to treat CDI (vancomycin, fidaxomicin, metronidazole, or rifaximin), bezlotoxumab (monoclonal antibody therapy), or faecal microbiota transplant (FMT). FMT was identified by CPT codes 44705 or 44799, or Healthcare Common Procedure Coding System (HCPCS) code G0455.
Index CDI episodes occurred between 1 January 2010 and 30 June 2017 (). Only patients who were observable 6 months before and 12 months after the index CDI episode were included. The pre-index period was used to quantify pre-CDI healthcare exposure and to indicate that the first observed CDI diagnosis was not a recurrent episode, while the post-index requirement allowed sufficient time for observing one or more recurrences following the index diagnosis.
Figure 1. Graphical depiction of index CDI and rCDI definitions.
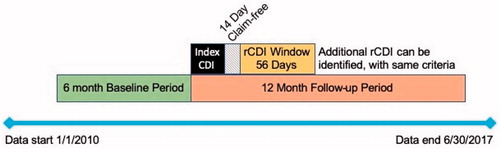
All medical claims with a CDI diagnosis that were observed within 14 d of a previous claim with a CDI diagnosis were considered part of the same episode, as were all days supplied for antibiotic prescriptions, with treatment continuing for the duration of the prescription. Each CDI episode was followed by a 14-d claim-free period after the end of treatment. rCDI was defined as another CDI episode, using the same criteria as above for the index CDI episode, within an 8-week window following the claim-free period ().
De-identified data were extracted for each individual: age; sex; geographic region; health insurance type; health status (measured by the Charlson comorbidity index [CCI]); comorbidities (diabetes, heart disease, cerebrovascular disease, renal disease, liver disease, and prior cancer); baseline CDI risk factors (such as autoimmune conditions, renal insufficiency, and current/history of smoking); and pre-index HRU.
Outcomes
All outcomes were calculated for the 12-month period after an index CDI, for all study patients, and by cohorts for number of rCDI episodes (0 rCDI, 1 rCDI, 2 rCDI, or 3+ rCDI). The number of patients with index CDI and rCDI episodes, and the time to rCDI were calculated. All-cause HRU was calculated, including number and length of inpatient admissions, and number of outpatient visits (including physician office visits, outpatient hospital visits, and emergency department [ED] visits). All-cause direct medical costs were calculated, including total costs, inpatient costs, outpatient costs (including physician office visits, outpatient hospital visits, ED visits, and other outpatient services), and prescription drug costs. The use of all-cause cost as an outcomes measure is supported by current methodologic recommendations because it provides a complete picture of cost burden for population decision makersCitation12,Citation13. In addition, the available method of using disease codes and drug codes to determine relatedness is not sufficiently reliable to separate disease-related and disease-unrelated costs.
Data analysis
Demographic characteristics, costs, and HRU for the relevant cohorts were displayed using counts and percentages for categorical variables and measures of central tendency (mean [standard deviation, SD]) for continuous variables. Multivariate logistic regression, adjusting for age, sex, illness burden (CCI), geographic region, health plan type, pre-index medication use (pre-index gastric acid-suppressing agents, antibiotics), pre-index medical procedures and treatments (transplant, gastrointestinal surgery, enteral feeding, chemotherapy), pre-index inpatient admission, and immunosuppressed status (Y/N), was conducted to evaluate the odds of multiple recurrences.
Costs were converted to 2018 dollars using the medical care component of the Consumer Price IndexCitation14. All statistical analyses were conducted with SAS version 9.3 (SAS Institute, Inc., Cary, NC).
Results
A total of 46,571 patients with an index CDI episode were included, with 3,129 (6.7%) having 1 recurrence, 472 (1.0%) having 2 recurrences, and 134 (0.3%) having 3 or more recurrences (). A larger proportion of patients were female and most had a preferred provider organization (PPO) health plan. The mean age was consistent across recurrence groups, at approximately 48 years. Geographically, the lowest rates of CDI and rCDI occurred in the West, and the highest rates of rCDI were seen in the Midwest. The mean (SD) baseline CCI score was lowest for those with no recurrences [1.2 (1.9)] and highest for those with 3 or more recurrences [2.3 (2.5)].
Table 1. Demographic and baseline characteristics.
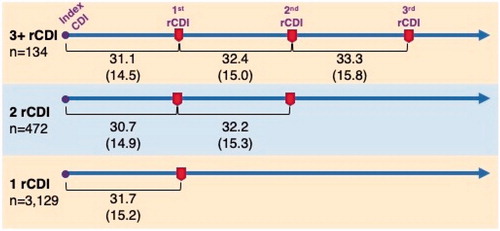
The mean time from one CDI episode to a recurrence (within the 8-week window, per definition) was consistent at approximately 1 month (). There were no substantial differences in the time to next CDI episode for patients who had 1 recurrence, 2 recurrences, or 3 or more recurrences (values ranged from 30.7 to 33.3 d).
Figure 2. The mean (SD) days from one CDI episode to a recurrence (within the 8-week window defining rCDI) was consistent at approximately 1 month and did not depend on the number of rCDI episodes (n = 3,735 patients).
During the 12-month follow-up period, HRU was reflective of the number of rCDI episodes. The number of inpatient visits per person and ED visits per person was highest for those with the greatest number of rCDI episodes (). The majority of patients (69.4%) who had 3 or more recurrences had at least 2 hospital admissions during the follow-up period, a figure which was lower for patients with fewer recurrences (62.1% for 2 rCDI, 53.0% for 1 rCDI, and 29.1% for 0 rCDI) (). The number of prescriptions per patient also was highest for those with three or more rCDI episodes.
Figure 3. In the 12-month follow-up period, the mean number of visits per patient for the emergency department (ED) or for an inpatient admission was highest for those with 3 or more CDI recurrences, at 4.6 visits and 5.8 visits, respectively.
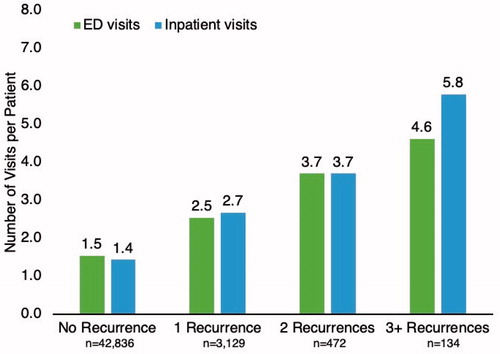
Table 2. All-cause healthcare resource utilization during 12-month follow-up.
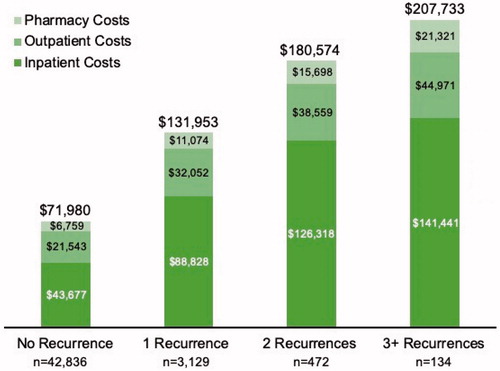
The mean annual, total all-cause direct medical costs per patient within the 12-month follow-up period were substantially different by rCDI group, from almost $72,000 for those with no recurrence to $207,700 for those with 3 or more recurrences (). Inpatient costs were the key cost driver, accounting for 61–70% of the total costs across the study cohorts. Outpatient costs comprised outpatient hospital visits, physician office visits, ED visits, and other outpatient services (including laboratory and imaging tests). Of the total outpatient costs, outpatient hospital visits accounted for the majority of the cost (56–58% of total): $12,111; $18,516; $22,542; and $25,828 by increasing recurrence group. ED costs were, by increasing recurrence group, $1,329; $2,127; $3,237; and $4,633.
Figure 4. Total, all-cause, direct medical costs during the 12-month period after an index CDI episode were substantial for any patient with recurrent CDI, and highest for those with 3 or more recurrences. Inpatient costs made up the majority of the total costs. Costs are adjusted to 2018 dollars.
Through multivariate logistic regression, there was only 1 covariate that was significantly associated with having 2 or more rCDI episodes vs. 1 rCDI (). Those with pre-index medical procedures and treatments, including transplant, gastrointestinal surgery, enteral feeding, or chemotherapy, were significantly more likely (odds ratio 1.27; 95% confidence interval: 1.04, 1.55) to have 2 or more recurrences than patients without pre-index medical procedures (p=.02). All other patient and clinical characteristics were not significantly associated with having more than 1 episode of rCDI, indicating the similarities between these cohorts, although a number of characteristics were borderline significant.
Table 3. Multivariate logistic regression for 2 + recurrences vs. 1 recurrence.
Discussion
CDI and rCDI are associated with substantial all-cause HRU and direct medical costs. Mean total, all-cause, direct medical costs for patients with rCDI varied by number of rCDI episodes and ranged between $131,000 for patients with 1 recurrence to more than $200,000 in patients with 3 or more recurrences in the 12 months following an index episode; costs for inpatient stays made up the majority of direct costs for all cohorts. The mean time between rCDI episodes was stable at about 1 month from the previous episode, with a standard deviation of approximately 15 d regardless of study cohort, indicating that the recurrence timing in this cohort aged 18–64 years seems predictable.
Prior studies have shown a mean CDI-attributable cost from $8,911 to $30,049 per patient/admission/episode/infection (2014 US dollars)Citation15. In one single centre study of 540 patients, the total hospitalization cost of treating a rCDI episode was 2.2 times that of primary CDICitation16. Our study provides a broader picture for CDI and rCDI medical costs, in more current dollars, that are not exclusively related to the CDI episode/hospitalization. Our study also focuses on a younger cohort than most other studies, with included patients between the ages of 18 and 64 years.
After a 6-month baseline period that was devoid of any CDI claims, the average time from the index CDI episode to each rCDI episode was approximately 1 month, similar to what has been reported previouslyCitation17. This likely represents the highest risk period for recurrence within the “window of vulnerability.” Once the colonic microbiota has been significantly depleted, the antibiotic treatment suppresses the CDI, but subsequently there might be insufficient time to restore the microbiota to a state where it is protective against reactivation of the latent C. difficile spores. Therefore, rate of recurrence and time to recurrence could be expected to be similar across episodes, without the presence of other influencing factors (e.g. concomitant antibiotics). Because the time to recurrence was relatively brief, we would expect the patient’s health plan at the time of the index CDI to assume most of the costs associated with the subsequent rCDI episode(s). This 1-month period also presents itself as a window of opportunity for interventions that can reduce the risk for future rCDI episodes. The findings of the logistic regression are important particularly because minimally significant factors were found that predict multiple recurrences vs. only 1 recurrence. Therefore, it seems that preventing any recurrence is the key objective, which should be an imperative for all CDI care. Though there are published analyses reporting risk factors for any CDI recurrence, the risk factors for multiple rCDI vs. 1 rCDI have not been extensively studied beforeCitation8,Citation18–21.
HRU was high for all patients with an index CDI, with the highest utilization for those with 3 or more recurrences. Other analyses of HRU have shown a similar hospital length of stay of 8.0 d for the index CDI episode, and 9.3 d for a rCDI episodeCitation22. In 2016, the mean hospital length of stay in the US for all conditions was 4.6 d, indicating that CDI places a higher burden on HRU than the average admissionCitation23. A single centre study showed similar rates of ICU use to our study, with 9.4% of patients with rCDI having an inpatient admission with ICU stayCitation24. An analysis of electronic records from 85 hospitals in the US showed the highest incidence of community-onset CDI was in the Northeast and MidwestCitation25. Our results support some of the earlier studies, with the highest rates of rCDI occurring in the Midwest.
The recurrence rates seen in this study are lower that what has been reported elsewhere (between 13.5% and 35% recurring within 30 d after initial CDI diagnosis)Citation2,Citation26. These lower rates are likely due to our study including a younger (18–64 years) cohort than those who are most frequently affected by CDI (≥65 years)Citation9,Citation26,Citation27. Younger patients tend to have fewer medical comorbidities, less requirement for concomitant antimicrobials, and likely lower rates of CDI recurrence. The mean CCI values reported here for patients with any rCDI are slightly lower than what was reported in other observational and randomized, controlled trials in CDICitation28–31. Another potential reason for our lower observed recurrence rates was our stringent criteria identifying likely rCDI cases. The study’s key objective was to quantify the economic burden of rCDI, and, therefore, we believe, a strict definition increased the validity of the findings. There may, unfortunately, have been cases of recurrent CDI that did not meet our case definition; thus, the reported incidence of rCDI may be an underestimation.
The PharMetrics Plus database contains adjudicated claims from payers for a diverse US population. The cost data collected reflect the payments made by the health plans or employers, therefore, we believe this data source is sufficiently accurate and valid to quantify the economic impact of rCDI to US commercial payers. As the data are solely from the US, they may not be generalizable to other countries. In this study, it is likely that the medical costs for the cohort with 3 or more recurrences are underestimated, because the cost summation stopped at 12 months following the index case of CDI. It is most likely that those patients who suffered 3 or more recurrences incurred additional CDI-related costs beyond 12 months from the index episode.
One limitation of this study is that it did not include individuals ≥65 years, as almost all of these individuals in the US are covered by Medicare, and the database used for the analysis contained only commercial claims. Previous research showed that older patients are more susceptible to rCDI, and the per-patient cost of treatment could be higher due to the impact of chronic conditionsCitation9,Citation26. Future studies focusing on the older, frail population would add to the current body of evidence. Also, a retrospective analysis of insurance claims data is subject to potential miscoding, however, these data errors are expected to be random and equal across the population. There may be missing encounter data when patients paid out of pocket, which would lead to an underestimation of costs. To address the key study objective, the study included patients who had a minimum of 18 months of continuous enrolment. These inclusion criteria would have excluded patients who disenroled sooner, including patients who died due to CDI, rCDI, or other reasons. In addition, individuals were excluded from this study if they lost commercial health insurance for any reason during the study period and could not be followed for 12 months; therefore, patients who became too disabled to work may have been excluded by this criterion. The impact of this limitation might have led to an under-estimation of the resource use and cost findings. The database does not define whether the patients had healthcare vs. community-acquired infection. Because this commercial database does not contain mortality data for patient privacy protection, the analysis cannot discern the reason for disenrolment. As such, the study was designed to focus on depicting economic burden, while unable to report mortality burden of rCDI.
Conclusion
CDI and rCDI are associated with substantial all-cause HRU and direct medical costs. As expected, repeat recurrences multiply the economic burden further. Despite a lack of predictors for multiple vs. 1 rCDI from patient characteristics, the timing of rCDI recurrence appears predictable. Leveraging this window of opportunity for early interventions that aim at reducing recurrences is key to addressing the economic burden of rCDI. Future research could consider a prospective study design of rCDI costs and consider a cohort aged ≥65 years.
Transparency
Declaration of funding
The study was funded by Ferring Pharmaceuticals Inc. (Parsippany, NJ).
Declaration of financial/other interests
Drs. Stong, Nelson, and Dahdal are employees of Ferring Pharmaceuticals Inc. Dr. Feuerstadt has served as a consultant to and on the speaker’s bureau for Merck and Co, and has served as a consultant for Ferring Pharmaceuticals Inc. and Roche Pharmaceuticals. Drs. Sacks and Lang are employees of Precision Health Economic and Outcomes Research and provided consulting services to Ferring Pharmaceuticals Inc.
A peer reviewer on this manuscript has disclosed that they have received consultancy fees from Astellas Pharma. The peer reviewers on this manuscript have no other relevant financial relationships or otherwise to disclose.
Author contributions
LS, WN, DND, NS, and KL designed and conducted the study. All authors analyzed and interpreted the data, drafted and critically revised the article for important intellectual content, and approved the article for publication.
Previous presentations
Portions of the data contained in this manuscript appeared in abstract/poster form at IDWeek 2019, October 2-6, 2019, Poster 2374. This manuscript has not been submitted and is not under consideration for publication anywhere else.
Acknowledgements
Medical writing and editorial support was provided by Agnella Izzo Matic, PhD, CMPP (AIM Biomedical, LLC) and was funded by Ferring Pharmaceuticals Inc.
References
- Ofosu A. Clostridium difficile infection: a review of current and emerging therapies. Ann Gastroenterol. 2016;29(2):147–154.
- Smits WK, Lyras D, Lacy DB, et al. Clostridium difficile infection. Nat Rev Dis Primers. 2016;2:16020.
- Centers for Disease Control and Prevention. Clostridioides difficile infection [Internet]; [cited 2019 Aug 13]. Available from: https://www.cdc.gov/hai/organisms/cdiff/cdiff_infect.html
- Reveles KR, Lee GC, Boyd NK, et al. The rise in Clostridium difficile infection incidence among hospitalized adults in the United States: 2001–2010. Am J Infect Control. 2014;42(10):1028–1032.
- Leffler DA, Lamont JT. Clostridium difficile infection. N Engl J Med. 2015;372(16):1539–1548.
- DePestel DD, Aronoff DM. Epidemiology of Clostridium difficile infection. J Pharm Pr. 2013;26(5):464–475.
- Song JH, Kim YS. Recurrent Clostridium difficile infection: risk factors, treatment, and prevention. Gut Liver. 2019;13(1):16–24.
- Zilberberg MD, Reske K, Olsen M, et al. Risk factors for recurrent Clostridium difficile infection (CDI) hospitalization among hospitalized patients with an initial CDI episode: a retrospective cohort study. BMC Infect Dis. 2014;14(1):306.
- Desai K, Gupta SB, Dubberke ER, et al. Epidemiological and economic burden of Clostridium difficile in the United States: estimates from a modeling approach. BMC Infect Dis. 2016;16(1):303.
- Rodrigues R, Barber GE, Ananthakrishnan AN. A comprehensive study of costs associated with recurrent Clostridium difficile infection. Infect Control Hosp Epidemiol. 2017;38(2):196–202.
- Dubberke ER, Olsen MA. Burden of Clostridium difficile on the healthcare system. Clin Infect Dis. 2012;55(2):S88–S92.
- van Baal P, Morton A, Meltzer D, et al. Future unrelated medical costs need to be considered in cost effectiveness analysis. Eur J Health Econ. 2019;20(1):1–5.
- Rappange DR, van Baal PHM, van Exel NJA, et al. Unrelated medical costs in life-years gained: should they be included in economic evaluations of healthcare interventions? Pharmacoeconomics. 2008;10:815–830.
- U.S. Bureau of Labor Statistics. Measuring price change in the CPI: medical care [Internet]; [cited 2020 Jan 9]. Available from: https://www.bls.gov/cpi/factsheets/medical-care.htm
- Nanwa N, Kendzerska T, Krahn M, et al. The economic impact of Clostridium difficile infection: a systematic review. Am J Gastroenterol. 2015;110(4):511–519.
- Shah DN, Aitken SL, Barragan LF, et al. Economic burden of primary compared with recurrent Clostridium difficile infection in hospitalized patients: a prospective cohort study. J Hosp Infect. 2016;93(3):286–289.
- Kelly CP. Can we identify patients at high risk of recurrent Clostridium difficile infection? Clin Microbiol Infect. 2012;18:21–27.
- Abou Chakra CN, Pepin J, Sirard S, et al. Risk factors for recurrence, complications an mortality in Clostridium difficile infection: a systematic review. PLoS One. 2014;9(6):e98400.
- Escobar GJ, Baker JM, Kipnis P, et al. Prediction of recurrenct Clostridium difficile infection using comprehensive electronic medical records in an integrated healthcare delivery system. Infect Control Hosp Epidemiol. 2017;38(10):1196–1203.
- LaBarbera FD, Nikiforov I, Parvathenani A, et al. A prediction model for Clostridium difficile recurrence. J Comm Hosp Intern Med Perspect. 2015;5(1):26033.
- van Beurden YH, Nezami S, Mulder CJJ, et al. Host factors are more important in predicting recurrent Clostridium difficile infection than ribotype and use of antibiotics. Clin Microbiol Infect. 2018;24(1):85.e1–85.e4.
- Zhang D, Prabhu VS, Marcella SW. Attributable healthcare resource utilization and costs for patients with primary and recurrent Clostridium difficile infection in the United States. Clin Infect Dis. 2018;66(9):1326–1332.
- Freeman WJ, Weiss AJ, Heslin KC. Overview of U.S. hospital stays in 2016: variation by geographic region. HCUP Statistical Brief #246. December 2018. Agency for Healthcare Research and Quality, Rockville, MD. www.hcup-us.ahrq.gov/reports/statbriefs/sb246-Geographic-Variation-Hospital-Stays.pdf.
- Aitken SL, Joseph TB, Shah DN, et al. Healthcare resource utilization for recurrence Clostridium difficile infection in a large university hospital in Houston, Texas. PLoS One. 2014;9(7):e102848.
- Zilberberg MD, Tabak YP, Sievert DM, et al. Using electronic health information to risk-stratify rates of Clostridium difficile infection in US hospitals. Infect Control Hosp Epidemiol. 2011;32(7):649–655.
- Lessa FC, Mu Y, Bamberg WM, et al. Burden of Clostridium difficile infection in the United States. N Engl J Med. 2015;372(9):825–834.
- Pechal A, Lin K, Allen S, et al. National age group trends in Clostridium difficile infection incidence and health outcomes in United States community hospitals. BMC Infect Dis. 2016;16(1):682.
- Cammarota G, Masucci L, Ianiro G, et al. Randomised clinical trial: faecal microbiota transplantation by colonoscopy vs. vancomycin for the treatment of recurrent Clostridium difficile infection. Aliment Pharmacol Ther. 2015;41(9):835–843.
- Charlson ME, Pompei P, Ales KL, et al. A new method of classifying prognostic comorbidity in longitudinal studies: development and validation. J Chron Dis. 1987;40(5):373–383.
- Delholm-Lambertsen E, Hall BK, Jørgensen SMD, et al. Cost savings following faecal microbiota transplantation for recurrent Clostridium difficile infection. Ther Adv Gastroenterol. 2019;12:1–14.
- McFarland LV, Surawicz CM, Rubin M, et al. Recurrent Clostridium difficile disease: epidemiology and clinical characteristics. Infect Control Hosp Epidemiol. 1999;20(01):43–50.