
Abstract
Aims: To evaluate total costs and health consequences of a colorectal cancer (CRC) screening program with colonoscopy, fecal immunochemical tests (FIT), and expanded use of multitarget stool DNA (mt-sDNA) from the perspectives of Integrated Delivery Networks (IDNs) and payers in the United States.
Materials and methods: We developed a budget impact and cost-consequence model that simulates CRC screening for eligible 50- to 75-year-old adults. A status quo scenario and an increased mt-sDNA scenario were modeled. The status quo includes the current screening mix of colonoscopy (83%), FIT (11%), and mt-sDNA (6%) modalities. The increased mt-sDNA scenario increases mt-sDNA utilization to 28% over 10 years. Costs for both the IDN and the payer perspectives incorporated diagnostic and surveillance colonoscopies, adverse events (AEs), and CRC treatment. The IDN perspective included screening program costs, composed of direct nonmedical (e.g. patient navigation) and indirect (e.g. administration) costs. It was assumed that IDNs do not incur the costs for stool-based screening tests or bowel preparation for colonoscopies.
Results: In a population of one million covered lives, the 10-year incremental cost savings incurred by increasing mt-sDNA utilization was $19.6 M for the IDN and $4.4 M for the payer. The incremental savings per-person-per-month were $0.16 and $0.04 for the IDN and payer, respectively. For both perspectives, increased diagnostic colonoscopy costs were offset by reductions in screening colonoscopies, surveillance colonoscopies, and AEs. Extending screening eligibility to 45- to 75-year-olds slightly decreased the overall cost savings.
Limitations: The natural history of CRC was not simulated; however, many of the utilized parameters were extracted from highly vetted natural history models or published literature. Direct nonmedical and indirect costs for CRC screening programs are applied on a per-person-per modality basis, whereas in reality some of these costs may be fixed.
Conclusions: Increased mt-sDNA utilization leads to fewer colonoscopies, less AEs, and lower overall costs for both IDNs and payers, reducing overall screening program costs and increasing the number of cancers detected while maintaining screening adherence rates over 10 years.
Introduction
Colorectal cancer (CRC) is the second leading cause of cancer-related deaths in the United StatesCitation1. There is significant evidence that screening for CRC reduces mortalityCitation2–14 and that most cancer deaths are preventable by screening and early detectionCitation6. The U.S. Preventive Services Task Force (USPSTF) recommendations suggest that there is substantial screening benefit for adults at average risk for CRC, with either a high-sensitivity stool-based test or a direct visualization examination of the colon and rectumCitation2. The USPSTF recommends that individuals 50–75 years of age, at average risk for CRC be screened, and the American Cancer Society (ACS) recommends that screening begins at the age of 45 years (qualified recommendation)Citation8 however, the risks and consequences of different screening methods varyCitation2.
Colorectal cancer screening is an on-going public health challenge and opportunity. There are multiple screening options with different screening intervals and variable levels of evidence supporting cost-effectiveness, performance, risk of harm, patient preference, and benefit for the prevention and early detection of CRC. The USPSTF and ACS prioritize screening uptake and adherence over the endorsement of a particular screening modalityCitation2,Citation8. There are no head-to-head high quality data that compare the performance, effectiveness, or patient preference for colonoscopy, fecal immunochemical tests (FIT), fecal occult blood tests (FOBT), and multitarget stool DNA (mt-sDNA, [Cologuard®]). Current CRC screening options included in guidelines can be categorically described as structural examinations (colonoscopy, CT colonography, flexible sigmoidoscopy), and stool-based tests (FIT, FOBT, mt-sDNA).
Through shared decision-making discussions with providers, patients may choose from screening options with varying degrees of preparation, time requirements, and invasiveness. For example, colonoscopy requires sedation, full bowel preparation, and can lead to adverse events (AEs) such as gastrointestinal bleeding or bowel perforationCitation15–18. However, colonoscopy screening identifies CRC, and prevents CRC through detection and removal of precancerous polyps. In contrast, noninvasive screening modalities such as mt-sDNA and FIT require neither bowel preparation nor sedation. Stool-based screening tests have varying performance characteristics (sensitivity and specificity) for the detection of CRC and precancerous lesionsCitation19. Positive stool-based screening tests should be followed by diagnostic colonoscopy and as appropriate, therapeutic polyp removal, and/or cancer diagnosis and treatment.
mt-sDNA is a molecular diagnostic test composed of 11 biomarkers, which include 10 DNA markers and a marker for hemoglobin. The DNA markers represent acquired changes in DNA (methylations, mutations) that are associated with colorectal neoplasia (precancer, cancer). The 11 biomarkers are analyzed and the results are combined in a logistic regression algorithm to yield a ‘positive’ or a ‘negative’ result. A head-to-head cross-sectional clinical study of FIT and mt-sDNA found that the mt-sDNA test has a sensitivity of 92% and specificity of 87%, whereas a leading commercially available FIT test has a sensitivity of 74% and specificity of 95% for CRCCitation19. The specificities of annual FIT and every 3°years mt-sDNA are theoretically similarCitation20 although these have not been evaluated in a study.
Modeling studies have estimated the clinical and economic outcomes of colorectal screening modalitiesCitation3–7. The majority of these studies assess the cost-effectiveness of screening from the societal perspective over a screening lifetime. Several are natural history models, including the Cancer Intervention and Surveillance Modeling Network (CISNET) models that simulate adenoma advancement into cancer and typically assume ideal (100%) adherence to screening regimensCitation21. Although these models are informative, there is a complementary need to quantify the total costs and health consequences of screening alternatives from the perspectives of Integrated Delivery Networks (IDNs) and payers. Integrated Delivery Networks consist of integrated provider networks, such as hospitals, urgent care centers, and laboratories. A shorter time horizon versus a screening lifetime should be simulated to reflect the frequent migration of individuals among IDNs and health plans. Furthermore, real-world applications of economic analyses should reflect imperfect adherence to screening, as well as potential shifting of patient choice of screening modalities over time.
Attempts to overcome the limitations to practical application of economic evaluations have occurred. Frazier et al.Citation3 and Vijan et al.Citation7 performed cost-effectiveness analyses with imperfect cross-sectional and repeat screening compliance. Subramanian et al.Citation6 incorporated patient preference for screening tests by assigning proportions of the modeled population to various modalities. Although these economic models address some of the limitations described above, they still focus on a societal perspective and do not address comparative costs of screening from the perspectives of IDNs and payers.
The objectives of this analysis were to examine costs from the perspectives of (1) IDNs and (2) payers, as well as to assess health consequences, such as adherence to CRC screening guidelines, number of detected CRC cases, and number of AEs.
Methods
Model overview
A 10-year Markov cohort model with annual cycles was developed to assess the costs and consequences of CRC screening with different modalities at varying utilizations and compliance levels. One million adults enter the model in the IDN and payer simulations. One million members is a common US payer size and is often used in health economic evaluationsCitation22–24 because it is easily scalable to an individual payer’s or IDN’s population. Based on the calculations from US Census dataCitation25 38% of covered lives were eligible for screening based on age (50–75 years), and an assumed 80% of those were considered to be at average risk for CRC, a calculation based on familial predispositionCitation26. The study included an average risk population only because recommended screening timing and frequency differs between average and high risk populations. The USPSTF and ACS recommendations apply to average risk patients onlyCitation2,Citation27. The U.S. Multi-Society Task Force of Colorectal Cancer (MSTF), however, provides recommendations for high risk individualsCitation20. Depending on various individual risk factors, the MSTF guidelines recommend screening with colonoscopy only, beginning at the age of 40 years or younger and at various intervals spanning from 3 to 5 yearsCitation20. With an average risk population, the simulated screening-eligible population for each perspective was 302,000 adults.
The screening algorithm was based on the 2016 USPSTF CRC screening recommendationsCitation2. Eligible individuals in the model are screened with mt-sDNA, FIT, or colonoscopy. Flexible sigmoidoscopy and CT colonography are not commonly utilized in the USCitation27 and were therefore not included. If the test is negative, mt-sDNA screeners enter a tunnel (nonscreening) state and are eligible for screening again in 3°years. Negative FIT screeners are eligible for rescreening annually, and colonoscopy screeners with negative results enter a tunnel state for the remainder of the time horizon, as guidelines recommend rescreening at 10 yearsCitation2.
Individuals with positive stool-based screening results are referred to diagnostic colonoscopy. If a polyp or colorectal neoplasia is detected during a diagnostic or screening colonoscopy, a biopsy is performed and the pathology is determined to be either a non-neoplastic finding, a nonadvanced adenoma, an advanced adenoma, or cancer (). Post-polypectomy surveillance is based on polyp categorization and the 2012 American Gastroenterological Association (AGA) guidelinesCitation28. If an advanced adenoma is detected, the individual is referred for a surveillance colonoscopy in 3 or 5 years depending on adenoma size, and histologyCitation28. Individuals with a negative diagnostic or surveillance colonoscopy enter a tunnel state for the remainder of the model horizon. The model allows mt-sDNA and FIT screeners to change screening modalities during each eligible cycle over the 10-year period. Furthermore, a proportion (16%) of all colonoscopies were required to be repeated due to poor bowel preparationCitation29 and AE rates due to colonoscopy were assumed to be based on whether or not a polypectomy is performedCitation18,Citation30–33 ().
Figure 1. Conceptual model framework.
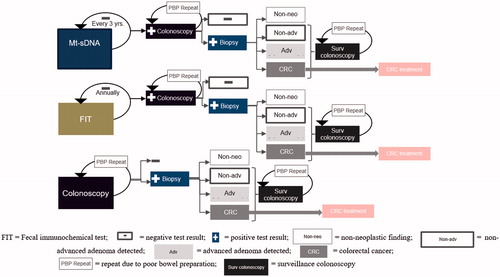
Table 1. Clinical inputs.
Population
We assigned age-specific risk profiles for incidence and prevalence of CRC, adenomas, and death, by dividing the model population into 5-year age bands (See Supplementary Table S1 for age distributions) at the beginning of each cycle. Annual all-cause mortality was based on the US life tables within 5-year age bands. In each cycle, 20% of each surviving subpopulation age into the subsequent age group; those above 75 years age out of the model. Beginning at the second cycle, ∼12,600 49-year-olds age into the screening eligible population as 50-year-olds each year.
As in the previous evaluations, propensity to adhere to screening was included in the specification of health statesCitation6,Citation47,Citation48. The ‘never-screener’ cohort comprises individuals who remain unscreened throughout the time horizon, and the ‘potential screener’ cohort comprises individuals who have a probability of adhering to recommended screening guidelines over 10 years. Based on a 10-year longitudinal retrospective claims analysis of over 150,000 subjects, 24% of patients remained unscreened throughout the time horizonCitation37. Our approach, reflecting adherence heterogeneity, prevented the entire cohort from eventually being screened.
Utilization of screening modalities in the primary analysis
The primary evaluation was between a status quo scenario and an ‘increased mt-sDNA’ utilization scenario. In the status quo scenario, we assumed that the screening mix remained constant throughout the time horizon as follows: 83% colonoscopy, 11% FIT, and 6% mt-sDNA, based on publicly available data on current utilization of screening modalities in the United States (Supplementary Table S2). In the ‘increased mt-sDNA’ scenario, the proportion utilizing mt-sDNA increased to 28% and the proportions utilizing FIT and colonoscopy decreased to 9 and 63% over 10 years.
Primary cross-sectional compliance, repeat screening compliance, and adherence
We used the following definitions for compliance and adherence: cross-sectional screening compliance—uptake of screening when due; repeat screening compliance—uptake of the same screening modality if it is repeated; screening adherence—evaluated according to CRC screening guidelinesCitation2 over a period of time. We used literature-based sources for cross-sectional compliance, and calculated the resulting adherence rates for all persons entering the model.
To calculate the number of individuals screened per modality per cycle, cross-sectional screening compliance proportions are applied to the number of eligible individuals allotted to each screening modality in each year. Cross-sectional screening compliance was 64%Citation37, 64.7%Citation35, and 67.49%1Citation34 for colonoscopy, FIT, and mt-sDNA, respectively. Repeat screening compliance was 64% for colonoscopyCitation37 and 81.6% for FITCitation36. Repeat screening compliance for mt-sDNA and FIT was assumed to be the same. Diagnostic colonoscopy compliance subsequent to a positive stool-based screening test was 78.4%Citation36 for FIT, and was assumed to be the same for mt-sDNA. As in a previous study, surveillance colonoscopy compliance was assumed to be 100%Citation7. We did not evaluate scenarios with surveillance more or less frequently than it is recommended by guidelines.
Adenoma and CRC epidemiology
The model is clinical in nature and is driven by observable epidemiological parameters. Therefore, unobserved adenoma progression was not simulated. Distributions (incidence) of adenoma number and size per age band were calculated based on the literature estimatesCitation5,Citation49. Size determined whether an adenoma was advanced (≥10 mm) or nonadvanced (<10 mm)Citation5 Surveillance colonoscopy frequencies were simulated according to AGA guidelines, which recommend surveillance every 3 years for patients with ≥1 advanced adenoma or ≥3 nonadvanced adenomasCitation28
CRC and adenoma epidemiology estimates for this analysis were based on models, published in the peer-reviewed literature, which simulated underlying diseaseCitation5,Citation21,Citation50. The Surveillance, Epidemiology, and End Results Program (SEER) CRC incidence estimates from 1975 to 1979, prior to widespread CRC screening, were applied to patients who remained unscreened throughout the time horizonCitation5. In addition, SEER estimates were used as baseline incidence rates for potential screeners. Relative risk incidence reductions per screening modality were based on the CISNET SimCRC colorectal model and were 63% for mt-sDNA2 (reflecting a 3-year screening interval), 67% for FIT3 (reflecting an annual screening interval), and 81% (reflecting a 10-year screening interval) for colonoscopy4Citation5. These reductions were applied to baseline incidence estimates to reflect the number of detected cancers for individuals undergoing screening.
Because the SimCRC model assumes 100% adherenceCitation5 applying those reductions in imperfect compliance scenarios would underestimate CRC incidence. Therefore, incidence reductions were weighted among adherent potential screeners (to whom the full SimCRC reduction per modality are applied) and noncompliant potential screeners (to whom the 1975–1979 SEER CRC incidence rates are applied) per annual cycle. We believe that this adjustment generates a more precise approximation of overall CRC incidence among screeners in real-world scenarios.
Test sensitivity and specificity per screening modality were extracted from published sourcesCitation5,Citation19 and FDA safety and effectiveness dataCitation38. Related to increased shedding of methylated DNA in stool, age-adjusted specificity was applied to mt-sDNACitation49. These performance characteristics were used to determine the number of biopsies during screening and diagnostic colonoscopies, as well as the number of detected cancers and advanced or nonadvanced adenomas. For colonoscopies, the number of non-neoplastic findings was determined by the calculation of false positives based on test specificityCitation51; however, for, stool-based tests, the number of false positives was calculated based on the diagnostic colonoscopy false positives for the screening continuum. One non-neoplastic finding per false positive was assumed.
Cost data
Although epidemiological and population-based parameters and assumptions did not vary between perspectives, costs included in each perspective did. The IDN and payer perspectives both incorporate direct medical costs, which were micro-costed and included procedural, AE, and CRC treatment components. Procedural and AE treatment costs were derived from Centers for Medicare and Medicaid Services (CMS) CPT codesCitation42 and the Healthcare Cost and Utilization Project (HCUP)Citation52 respectively. Colorectal cancer treatment costs were derived from the literature estimatesCitation4.
As a nonpayer owned delivery system, it was assumed that an IDN incurs neither bowel preparation nor stool-based screening test costs. Therefore, those costs were unique to the payer perspective and were derived from the literature and CMSCitation39. In order to estimate the full cost of screening programs, additional cost components were included in the IDN analysis. Direct nonmedical costs such as navigation services for patients and provider supportCitation46 and indirect nonmedical costs were attributed to elements such as screening program management and administration servicesCitation46. For mt-sDNA, applicable direct nonmedical and indirect costs were assumed to be the same as for FIT. The aggregate estimates were applied annually per screening modality ().
Table 2. Economic Inputs.
Cost indices were calculated in order to convert Medicare costs to Commercial and Medicaid costs, and from Commercial costs to Medicare and Medicaid costs (See Supplementary Data). Because costs are reported on a cumulative basis over a relatively long time horizon (10 years), they were discounted at an annual rate of 3%Citation53. All costs were either extracted from 2019 data or were updated to 2019 USD based on the medical CPICitation45.
Alternative assumptions
We modeled additional assumptions to test the robustness of the budget impact results. In alignment with American Cancer Society (ACS) recommendations, we extended screening eligibility to 45- to 75-year oldsCitation8. We also ran a simulation in which stool-based tests and bowel preparation costs were included in the IDN perspective. Finally, in order to compare our results with the USPSTF economic analysisCitation5 we ran scenarios in which all potential screeners receive a single modality throughout the time horizon, in conjunction with assumptions of 100% compliance and the inability to switch modalities over time.
Sensitivity analyses
For the deterministic sensitivity analysis (DSA), all clinical (such as incidence, incidence reduction, cross-sectional compliance, etc.) and economic parameters (such as CRC screening program line item costs, colonoscopy costs, AE costs, and CRC treatment) were varied by ±20%, and keeping all else constant. The probabilistic sensitivity analysis (PSA), however, was conducted utilizing the Monte Carlo techniqueCitation54. The model was replicated 10,000 times during which all parameters could vary across a predetermined range, as established by draws from a beta distribution. The range for costs and resource use was determined using a gamma distribution. In all cases, we used an assumed standard error of 10%.
Results
In year 1 of the horizon, a total of 302 K eligible and 229 K patients potentially screened each year for the 50- to 75-year-old cohort. Compared to the status quo, an additional 6,412 screenings occurred in the increased mt-sDNA utilization scenario (resulting from an additional 22,068 mt-sDNA screenings, 13,793 fewer colonoscopies, and 1,863 fewer FIT screenings), when using real-world compliance rates drawn from the literature and manufacturer supplied data. Overall, increased use of mt-sDNA resulted in 257 fewer surveillance colonoscopies, as would be expected when increasing the utilization of stool-based tests, but an increase in diagnostic colonoscopies (an additional 2,037) occurred. An additional 5 cases of CRC and 1,603 fewer non-neoplastic findings were detected. At the end of 10 years, overall screening adherence was 80%, both for the status quo and with increased utilization of mt-sDNA ().
Table 3. Incremental health outcomes for the IDN and payer perspectives.
In the primary analysis from the IDN perspective, the estimated cumulative 10-year costs were $1.001 B for the status quo scenario and $988.9 M in the increased mt-sDNA scenario, which led to a cost savings of $19.6 M and a per-person-per month (PPPM) savings of $0.16. The distribution of total savings was attributable to decreases in the following costs: 1% in surveillance colonoscopies, 69% in screening colonoscopies, 10% in AEs, and 19% for direct non-medical costs. From the payer perspective, the aggregate 10-year costs were $659 M for the status quo and $655 M for the increased mt-sDNA scenario, which led to an incremental cost savings of $4.4 M. The distribution of total savings was attributable to decreases in the following costs: 4% in surveillance colonoscopies, 52% across all screening modalities, and 31% in AEs. As a result, the PPPM savings was $0.04 ().
Table 4. Incremental economic outcomes for the IDN and payer perspective.
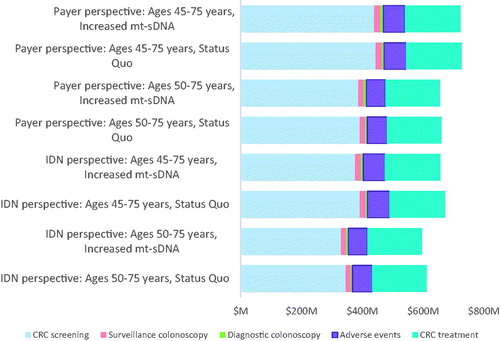
Compared to the primary results, when extending screening eligibility to 45- to 75-years, the overall cost savings slightly declined ($19.1 M for the IDN, a 2.5% decrease, and $4.2 M for the payer, a 4.5% decrease). Furthermore, by including stool-based tests and bowel preparation costs for screeners between ages 50 and 75 years in the IDN perspective, the savings decreased (65%) to $6.7 M. For the scenarios in which all eligible screeners receive a single modality throughout the time horizon, assuming 100% compliance and the inability to switch modalities over time, the aggregate 10-year costs from the IDN perspective were $1.19B for mt-sDNA, $979M for colonoscopy, and $2.29B for FIT. From the payer perspective, the cumulative costs were $470 M for FIT, $764 M for mt-sDNA, and $661 M for colonoscopy ().
Figure 2. Cumulative total cost (in millions) by category for the IDN and payer perspectives.
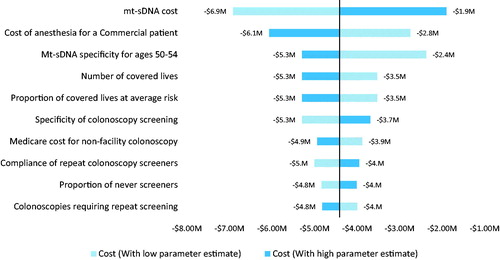
The DSA suggested that both perspectives were most sensitive to the number of covered lives, proportion of covered lives at average risk, specificity of colonoscopy, compliance with colonoscopies and the cost of anesthesia ( and ). The IDN perspective included screening program costs and these pertinent non-medical costs played a key role in its budget impact results. The payer perspective included mt-sDNA and FIT test costs, and its simulation was sensitive to the mt-sDNA cost. Among 10,000 iterations, the PSA demonstrated that 100 and 98.4% of the IDN and payer perspective simulations were cost saving and the number of incremental cancers detected ranged from 11 to 44.
Figure 3. Top 10 Results of the DSA for the IDN perspective. Note. The incremental BIM for the primary analysis from the IDN perspective is −$19,635,033.
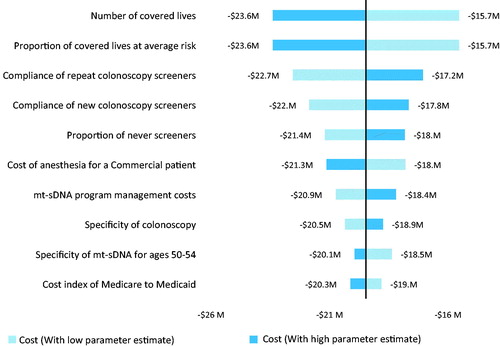
Figure 4. Top 10 Results of the DSA for the payer perspective. Note. The incremental BIM for the primary analysis from the payer perspective is −$4,410,486.
Discussion
We used a Markov cohort simulation model to project and contrast the budgetary impact of increasing utilization of mt-sDNA for CRC screening, relative to colonoscopy and FIT, for IDNs and payers. Our results show that increased utilization of mt-sDNA generates significant cost savings for both perspectives, with the IDN perspective realizing greater savings, as compared to the status quo, with similar clinical outcomes as the payer perspective.
Given that the majority of screening colonoscopies in individuals at average risk for CRC are negative, the study suggests that screening with a highly sensitive and specific stool-based test (e.g. mt-sDNA) will result in an enriched (i.e. a higher likelihood of precancer or cancer) population going on to have a colonoscopy. Colonoscopy is a more expensive screening option and carries significantly more risk of harms for patientsCitation15 including bleeding and perforation.
The cost savings for both perspectives can be explained principally by the reduction in the number of colonoscopies, resulting in savings on anesthesia, procedures, and AEs due to colonoscopy. For the IDN perspective, a large proportion of the cost savings is driven by the reduction in the number of FIT screenings, associated with a reduction in direct nonmedical spending. Several items, such as providing patient support and navigation services, were assumed to be $0 for mt-sDNA as they are included in the test cost. Although relatively inexpensive as a direct medical cost at ∼$18, IDNs may fail to consider the relatively expensive potential FIT screening program costsCitation46,Citation55,Citation56. The difference in degree of cost savings between the payer and IDN perspectives is due to the fact that screening program costs are included in the IDN perspective only, as well as the assumption that IDNs incur neither FIT nor mt-sDNA test costs.
The model results suggest that it is important to consider the incremental number of non-neoplastic findings between the status quo and the increased mt-sDNA utilization scenarios. Although the detection and removal of an adenoma would constitute ‘positive’ spending in that it would lead to CRC prevention, the detection and removal of a non-neoplastic finding could be considered wasteful spending among IDNs and payers.
Silva-Illanes and EspinozaCitation57 found that only 26% of 34 state-transition CRC screening models reviewed included administration costs related to CRC screening programs and only 12% included indirect costs. In order to estimate screening program costs incurred by IDNs, literature-based estimates were employed, or assumptions made for the various screening modalities (). Because several direct nonmedical and indirect costs (e.g. patient navigation and provider support) are provided by the manufacturer and thus included in the mt-sDNA cost, they were assumed to be $0 (). Similarly, several indirect costs, such as partnership development, data collection and tracking, and program monitoring and evaluation were also assumed to be $0 with mt-sDNA, as those services are provided through the manufacturer’s web portal and laboratory support services.
A distinctive feature of our model is that it allows for migration from one screening modality to another each eligible cycle. In a retrospective cohort analysis of over 300,000 FIT users, 32% switched screening modalities after the first round,Citation36 indicating that economic analyses should account for the switching of modalities due to various factors including patient preference and provider recommendations during shared decision-making. Due to the lack of data for population-specific costs, we calculated cost indices for Medicare to Medicaid and Commercial to Medicare costs in order to estimate the relevant costs. Future models could incorporate recent claims and cost data from all three patient populations. In addition, the model included the cost of following up on only the most advanced finding during screening, diagnostic, and surveillance colonoscopies. As a result, pathology costs incurred by payers and IDNs may be underestimated; however, at approximately $70 per test, this is a relatively small cost and therefore would likely not significantly affect the directionality of the overall findings. Furthermore, direct nonmedical and indirect costs are applied on a per-person-per modality basis, whereas in reality some of these costs may be fixed, that is not proportional to the number of persons screened. Future analyses should measure and distinguish among these fixed and variable (per-person) costs to more accurately estimate screening program costs. However, this model is the first to implement a variety of screening program costs not usually reflected in health economic evaluations and will aid in the decision-making processes for IDN and payer stakeholders. Further research should be conducted regarding the epidemiological components of the model. For example, it is uncertain to what degree 1 year of overdue screening within a screening regimen increases CRC incidence per modality over the time horizon. The impact of missed screening events varies with age just as incidence varies with increasing ageCitation58 Although we did not simulate the natural history of CRC parameters, such as adenoma size and distribution, baseline cancer incidence by 5-year age band, cancer stage distribution, and cancer life expectancy per stage were extracted from highly vetted natural history models or published literatureCitation5,Citation18,Citation19,Citation38,Citation59. Future research should further examine the implications of real-world health consequences of varying and switching screening modalities as technology continues to develop. Furthermore, future analyses should examine screening costs and benefits in a high risk population as well as the health and economic consequences incurred by a self-insured US employer.
When determining the optimal stool-based screening strategy, Knudsen et al.Citation5 conducted a non-cost based analysis that included efficiency ratios, defined as the incremental number of colonoscopies divided by the number of life years gained compared to colonoscopy screening. According to this method, FIT screening dominated among noncolonoscopy screening methods. Because our model does not incorporate CRC-related death rates, the USPSTF modeling study incorporated 100% compliance estimates, and individuals do not switch screening modalities in the CISNET models, we ran a scenario in which all potential screeners receive a single modality with 100% compliance and are unable to switch modalities over the time horizon. Although the CISNET cost-efficiency modeling results found that mt-sDNA generates the fewest number of harms among the three modalities in this analysis over a screening lifetimeCitation2,Citation5 our model suggested that FIT incurred a slightly lower frequency of AEs (5,000) compared to mt-sDNA (5,080) and both generated a large reduction in AEs compared to colonoscopy screening (22,000). However, when running this simulation, mt-sDNA is cost saving relative to the other modalities with respect to IDN costs.
In order to externally validate our model with CRC screening economic analyses incorporating natural history hypotheses, we searched the literature for populations that would incorporate similar epidemiological data. In 2001, with the incremental cost-per life year gained method, Vijan et al.Citation7 found that colonoscopy screening was the most cost-effective among various modalities compared to no screening. As with the Knudsen et al.Citation5 study, we are unable to draw a direct comparison; however, Vijan et al.Citation7 suggested that this result depended on compliance estimates for noncolonoscopy modalities. Estimates for the compliance of stool-based screening incorporated in our model are more recent as well as higher than those cited in Vijan et al., which stem from survey data collected in 1987Citation60,Citation61 and 1992Citation60.
With the SimCRC CISNET model,Citation21 Goede et al.Citation4 found that additional screening costs during pre-Medicare years led to long term (12–14 years) costs offsets in Medicare spending, driven by a reduction in cancer treatment spendingCitation4. However, with a 10-year time horizon versus a screening lifetime, our model demonstrated annual increases in CRC spending. This is perhaps due to differing methodology of comparing current screening rates to a future scenario in which the rate reached 70% as opposed to examining the impact of varying different screening modalities. Furthermore, our model had a shorter time horizon and Goede et al.’s model implemented FOBT or colonoscopy modalities only.
Choosing which modality with which to complete CRC screening should be based on risk for CRC and shared decision making with a healthcare provider and a patientCitation2 Current models represent colonoscopy with the highest sensitivity and specificity among all of the modalities, its incidence reduction is the greatest on average assuming 100% adherenceCitation5 Our model suggested a very slight increase in CRC incidence with a reduction in colonoscopies. However, on-time screening in accordance with USPTF guidelines will reduce CRC-related incidence and mortality compared with no screening. There is no “one size fits all” approach to CRC screening and patients at average risk for CRC should be offered options for screening and be engaged in discussion about the benefits and potential for harms for each option as well as accounting for values and preferencesCitation8.
Conclusion
Mt-sDNA provides a screening option for screening eligible adults at average risk for CRC with greater sensitivity and a longer screening interval (3 years) compared with other stool-based tests (1 year)Citation8 Therefore, increasing mt-sDNA utilization in CRC screening programs may provide opportunities for IDNs and payers to increase screening uptake and adherence. Based on the model results, increasing mt-sDNA utilization among screening programs including mt-sDNA, FIT, and colonoscopy, creates the potential for cost savings. Our investigation also suggests that increases in mt-sDNA utilization compared to the status quo would lead to increased CRC screening rates and more detected colorectal precancer and cancer.
With this analysis, we sought to enhance the literature on CRC screening health economic evaluations by making the cost results more applicable to real-world decision makers. The model had a shorter time horizon (10 years vs. lifetime), which reflected real-world frequent migration of patients to and from various health plans and IDNs. The model incorporated imperfect compliance estimates, which allowed simulations of inadequate adherence to screening guidelines. Our model also incorporated the ability for individuals to switch screening modalities each cycle when eligible for rescreening. With a variety of screening options, and given the choices, individuals may switch modalities over their screening lifetime. This model and framework may serve as a useful tool for IDNs and payers when considering evidence-based approaches to achieve CRC screening program goals.
Transparency
Declaration of funding
The funding source is Exact Sciences Corporation.
Declaration of financial/other relationships
Joanne M Hathway, MPH: is an employee of Precision Health Economics and Outcomes Research, which provides consulting services to the pharma, biotech, and diagnostic industry including Exact Sciences. Precision Health Economics and Outcomes Research has received professional fees for the development of the economic model.
Lesley-Ann Miller-Wilson, PhD, MBA: Employment, Stock from Exact Sciences Corporation.
Ivar S Jensen, MBA: is an employee of Precision Health Economics and Outcomes Research which provides consulting services to the pharma, biotech, and diagnostic industry including Exact Sciences Corporation. Precision Health Economics and Outcomes Research has received professional fees for the development of the economic model.
Burak Ozbay, PhD: Employment, Stock from Exact Sciences Corporation.
Catherine Regan, BA: is an employee of Precision Health Economics and Outcomes Research which provides consulting services to the pharma, biotech, and diagnostic industry including Sciences Corporation. Precision Health Economics and Outcomes Research has received professional fees for the development of the economic model.
Anupam B Jena, MD, PhD: Dr. Jena reports personal fees from Pfizer, personal fees from Hill Rom Services, Inc., personal fees from Bristol Myers Squibb, personal fees from Novartis Pharmaceuticals, personal fees from Vertex Pharmaceuticals, personal fees from Precision Health Economics, personal fees from Amgen, personal fees from Eli Lilly, personal fees from Analysis Group, personal fees from Sanofi Aventis, personal fees from Celgene, personal fees from Tesaro, personal fees from AstraZeneca, personal fees from Biogen, outside the submitted work.
Milton C Weinstein, PhD: Dr. Weinstein reports personal fees from Precision Health Economics and Outcomes Research,, which provides consulting services to the pharma, biotech, and diagnostic industry including Exact Sciences Corporation, during the conduct of the study.
Philip D Parks, MD, MPH: Employment, Stock from Exact Sciences Corporation.
JME peer reviewers on this manuscript have received an honorarium from JME for their review work, but have no other relevant financial relationships to disclose.
Author contributions
All authors were instrumental in drafting the manuscript and participated extensively in review and editing of the manuscript.
Supplemental Material
Download MS Word (24 MB)Acknowledgements
The authors would like to acknowledge Andrew Piscitello, PhD, Weiyu Yao, MSc, and Phil L Cyr, MPH.
Notes
Correction Statement
This article was originally published with errors, which have now been corrected in the online version. Please see Correction (http://dx.doi.org/10.1080/13696998.2021.1935473)
Notes
1 Mt-sDNA’s compliance rate represents the cumulative completed tests from kits shipped to patients during the 6-month period ending 12 months prior to the end of the Q3 2019, excluding program orders.
2 Knudsen AB, Zauber AG, Rutter CM, et al. Estimation of Benefits, Burden, and Harms of Colorectal Cancer Screening Strategies: Modeling Study for the US Preventive Services Task Force. JAMA. 2016 Jun 21;315(23):2595–609, Supplement, Table 6a.
3 Knudsen AB, Zauber AG, Rutter CM, et al. Estimation of Benefits, Burden, and Harms of Colorectal Cancer Screening Strategies: Modeling Study for the US Preventive Services Task Force. JAMA. 2016 Jun 21;315(23):2595–609, Supplement, Table 5a.
4 Knudsen AB, Zauber AG, Rutter CM, et al. Estimation of Benefits, Burden, and Harms of Colorectal Cancer Screening Strategies: Modeling Study for the US Preventive Services Task Force. JAMA. 2016 Jun 21;315(23):2595–609, Supplement, Table 3a.
References
- Siegel RL, Miller KD, Jemal A. Cancer statistics, 2019. CA A Cancer J Clin. 2019;69:7–34.
- Bibbins-Domingo K, Grossman DC, Curry SJ, et al. Screening for colorectal cancer: US preventive services task force recommendation statement. JAMA. 2016;315:2564–2575.
- Frazier AL, Colditz GA, Fuchs CS, et al. Cost-effectiveness of screening for colorectal cancer in the general population. JAMA. 2000;284:1954–1961.
- Goede SL, Kuntz KM, van Ballegooijen M, et al. Cost-savings to medicare from pre-medicare colorectal cancer screening. Med Care. 2015;53:630–638.
- Knudsen AB, Zauber AG, Rutter CM, et al. Estimation of benefits, burden, and harms of colorectal cancer screening strategies: modeling study for the US preventive services task force. JAMA. 2016;315:2595–2609.
- Subramanian S, Bobashev G, Morris RJ. Modeling the cost-effectiveness of colorectal cancer screening: policy guidance based on patient preferences and compliance. Cancer Epidemiol Biomark Prev. 2009;18:1971–1978.
- Vijan S, Hwang EW, Hofer TP, et al. Which colon cancer screening test? A comparison of costs, effectiveness, and compliance. Am J Med. 2001;111:593–601.
- Wolf AMD, Fontham ETH, Church TR, et al. Colorectal cancer screening for average-risk adults: 2018 guideline update from the American Cancer Society. A Cancer J Clin. 2018;68:250–281.
- Hewitson P, Glasziou P, Watson E, et al. Cochrane systematic review of colorectal cancer screening using the fecal occult blood test (hemoccult): an update. Am J Gastroenterol. 2008;103:1541–1549.
- Doubeni CA, Corley DA, Quinn VP, et al. Effectiveness of screening colonoscopy in reducing the risk of death from right and left colon cancer: a large community-based study. Gut. 2018;67:291–298.
- Nishihara R, Wu K, Lochhead P, et al. Long-term colorectal-cancer incidence and mortality after lower endoscopy. N Engl J Med. 2013;369:1095–1105.
- Schoen RE, Pinsky PF, Weissfeld JL, et al. Colorectal-cancer incidence and mortality with screening flexible sigmoidoscopy. N Engl J Med. 2012;366:2345–2357.
- Segnan N, and the SCORE Working Group, Armaroli P, Bonelli L, et al. Once-only sigmoidoscopy in colorectal cancer screening: follow-up findings of the Italian Randomized Controlled Trial–SCORE. J Natl Cancer Inst. 2011;103:1310–1322.
- Atkin W, Wooldrage K, Parkin DM, et al. Long term effects of once-only flexible sigmoidoscopy screening after 17 years of follow-up: the UK Flexible Sigmoidoscopy Screening randomised controlled trial. Lancet. 2017;389:1299–1311.
- Ranasinghe I, Parzynski CS, Searfoss R, et al. Differences in colonoscopy quality among facilities: development of a post-colonoscopy risk-standardized rate of unplanned hospital visits. Gastroenterology. 2016;150:103–113.
- Ko CW, Riffle S, Michaels L, et al. Serious complications within 30 days of screening and surveillance colonoscopy are uncommon. Clin Gastroenterol Hepatol. 2010;8:166–173.
- Fisher DA, Maple JT, Ben-Menachem T, et al. Complications of colonoscopy. Gastrointest Endosc. 2011;74:745–752.
- Warren JL, Klabunde CN, Mariotto AB, et al. Adverse events after outpatient colonoscopy in the medicare population. Ann Intern Med. 2009;150:849–857.
- Imperiale TFR, Itzkowitz DF, H S. Multitarget stool DNA testing for colorectal-cancer screening. New Eng J Med. 2014;371:184–188.
- Rex DK, Boland CR, Dominitz JA, et al. Colorectal cancer screening: recommendations for physicians and patients from the U.S. multi-society task force on colorectal cancer. Am J Gastroenterol. 2017;112:1016–1030.
- Cancer Intervention and Surveillance Modeling Network (CISNET). Joint Profile of Colorectal Cancer Model Profiles. 2018 [cited 2019 Mar 25]. Available from: https://cisnet.flexkb.net/mp/pub/cisnet_colorectal_joint_profile.pdf#pagemode=bookmarks
- Musgrove P, Fox-Rushby J. Cost-effectiveness analysis for priority setting. In: Jamison DT, Breman JG, Measham AR, et al., editors. Disease control priorities in developing countries. Washington (DC): World Bank The International Bank for Reconstruction and Development/The World Bank Group; 2006.
- Mezzio D, Brown D. Assessing drug price changes over 1 year and their influence on budget impact. Baltimore (MD): ISPOR International Society of Pharmacoeconomics and Outcomes Research; 2018.
- Appukkuttan S, Duchesneau E, Zichlin ML, et al. A budget impact analysis of the introduction of copanlisib for treatment of relapsed follicular lymphoma in the United States. JMCP. 2019;4:1–12.
- U.S. Census Bureau. Population Estimates by Age, Sex, Race and Hispanic Origin: United States Census Bureau. 2018 [cited 2018 Dec 1]. Available from: https://www.census.gov/newsroom/press-kits/2018/estimates-characteristics.html
- Burt RW. Colon cancer screening. Gastroenterology. 2000;119:837–853.
- American Cancer Society. Colorectal Cancer Screening: What Are My Options? 2019 [updated 2019 Feb 26; cited 2019 Aug 13]. Available from: https://www.cancer.org/latest-news/understanding-tests-that-screen-for-colon-cancer.html
- Lieberman DA, Rex DK, Winawer SJ, et al. Guidelines for colonoscopy surveillance after screening and polypectomy: a consensus update by the US multi-society task force on colorectal cancer. Gastroenterology. 2012;143:844–857.
- Govani SM, Elliott EE, Menees SB, et al. Predictors of suboptimal bowel preparation in asymptomatic patients undergoing average-risk screening colonoscopy. World J Gastrointest Endosc. 2016;8:616–622.
- Day LW, Kwon A, Inadomi JM, et al. Adverse events in older patients undergoing colonoscopy: a systematic review and meta-analysis. Gastrointest Endosc. 2011;74:885–896.
- Ko CW, Riffle S, Shapiro JA, et al. Incidence of minor complications and time lost from normal activities after screening or surveillance colonoscopy. Gastrointest Endosc. 2007;65:648–656.
- Leffler DA, Kheraj R, Garud S, et al. The incidence and cost of unexpected hospital use after scheduled outpatient endoscopy. Arch Intern Med. 2010;170:1752–1757.
- Chukmaitov AS, Menachemi N, Brown SL, et al. Is there a relationship between physician and facility volumes of ambulatory procedures and patient outcomes? J Ambulatory Care Manage. 2008;31:354–369.
- Manufacturer data on file. 2019. Mt-sDNA’s compliance rate represents the cumulative completed tests from kits shipped to patients during the six-month period ending 12 months prior to the end of the 2019, excluding program orders.
- van Roon AH, Goede SL, van Ballegooijen M, et al. Random comparison of repeated faecal immunochemical testing at different intervals for population-based colorectal cancer screening. Gut. 2013;62:409–415.
- Jensen CD, Corley DA, Quinn VP, et al. Fecal immunochemical test program performance over 4 rounds of annual screening: a retrospective cohort studyfecal immunochemical test performance characteristics. Ann Intern Med. 2016;164:456–463.
- Chyhaniuk A, Coombes ME. Longitudinal adherence to colorectal cancer screening guidelines. Am J Manag Care. 2016;22:105–111.
- Administration USFD. FDA Summary of Safety and Effectiveness Data. 2018.
- Centers for Medicare & Medicaid Services. Clinical Laboratory Fee Schedule. Baltimore (MD); 2019 Jun 1. Available from: https://www.cms.gov/Medicare/Medicare-Fee-for-Service-Payment/ClinicalLabFeeSched/Clinical-Laboratory-Fee-Schedule-Files.html
- Healthcare Bluebook. Binding price estimate for Anesthesia for colonoscopy (with biopsy). Available from: https://www.healthcarebluebook.com/
- Pyenson B, Scammell C, Broulette J. Costs and repeat rates associated with colonoscopy observed in medical claims for commercial and Medicare populations. BMC Health Serv Res. 2014;14:92.
- Centers for Medicare & Medicaid Services. Physician Fee Schedule cms.gov. 2019 May 1. Available from: https://www.cms.gov/apps/physician-fee-schedule/overview.aspx
- Healthcare Cost and Utilizaiton Project (HCUP). HCUP NIS Database Documentation. Rockville (MD); 2018 Dec 1. Available from: https://www.hcup-us.ahrq.gov/db/nation/nis/nisdbdocumentation.jsp
- Hathway J, Jensen I, Cyr P, et al. Economic analysis of colorectal cancer screening from multiple stakeholder perspectives: key components to improve practical applications in the US. New Orleans (LA): ISPOR International Society for Pharmacoeconomics and Outcomes Research; 2019.
- F1ederal Reserve Bank of St. Louis. Federal Reserve Economic Data. St. Louis (MO); 2019 [cited 2019 Jun 1]. Available from: https://fred.stlouisfed.org/series/CPIAUCSL#0
- Subramanian S, Tangka FKL, Hoover S, et al. Costs of colorectal cancer screening provision in CDC’s colorectal cancer control program: comparisons of colonoscopy and FOBT/FIT based screening. Eval Prog Plan. 2017;62:73–80.
- Leard LE, Savides TJ, Ganiats TG. Patient preferences for colorectal cancer screening. J Fam Pract. 1997;45:211–218.
- Phillips AK, Liang LY, Ladabaum LU, et al. Trends in colonoscopy for colorectal cancer screening. Med Care. 2007;45:160–167.
- Rutter CM, Yu O, Miglioretti DL. A hierarchical non-homogenous Poisson model for meta-analysis of adenoma counts. Statist Med. 2007;26:98–109.
- Zauber A, Knudsen A, Rutter C, et al. Evaluating the benefits and harms of colorectal cancer screening strategies: a collaborative modeling approach. 2015.
- Zauber AG, Lansdorp-Vogelaar I, Wilschut J, et al. AHRQ technology assessments. Cost-effectiveness of DNA stool testing to screen for colorectal cancer. Rockville (MD): Agency for Healthcare Research and Quality (US); 2007.
- Healthcare Cost and Utilization Project (HCUP). HCUP CCS—Services and Procedures. Rockville (MD); 2018. Available from: https://www.hcup-us.ahrq.gov/toolssoftware/ccs_svcsproc/ccssvcproc.jsp
- Sanders GD, Neumann PJ, Basu A, et al. Recommendations for conduct, methodological Practices, and Reporting of Cost-effectiveness Analyses: Second Panel on Cost-Effectiveness in Health and Medicine. JAMA. 2016;316:1093–1103.
- Briggs AH, Claxton K, Sculpher M. Decision modelling for health economic evaluation. Oxford: Oxford Univ. Press; 2011.
- Subramanian S, Tangka FKL, Hoover S, et al. Costs of planning and implementing the CDC’s colorectal cancer screening demonstration program. Cancer. 2013;119:2855–2862.
- Subramanian S, Tangka FKL, Hoover S, et al. Comparison of program resources required for colonoscopy and fecal screening: findings from 5 years of the colorectal cancer control program. Prev Chronic Dis. 2019;16:E50.
- Silva-Illanes N, Espinoza M. Critical analysis of Markov models used for the economic evaluation of colorectal cancer screening: a systematic review. Value Health. 2018;21:858–873.
- Doubeni CA, Fedewa SA, Levin TR, et al. Modifiable failures in the colorectal cancer screening process and their association with risk of death. Gastroenterology. 2019;156:63–74.e6.
- Soerjomataram I, Thong MS, Ezzati M, et al. Most colorectal cancer survivors live a large proportion of their remaining life in good health. Cancer Causes Control. 2012;23:1421–1428.
- Anderson LM, May DS. Has the use of cervical, breast, and colorectal cancer screening increased in the United States? Am J Public Health. 1995;85:840–842.
- Brown ML, Potosky AL, Thompson GB, et al. The knowledge and use of screening tests for colorectal and prostate cancer: data from the 1987 National Health Interview Survey. Prevent Med. 1990;19:562–574.