
 ?Mathematical formulae have been encoded as MathML and are displayed in this HTML version using MathJax in order to improve their display. Uncheck the box to turn MathJax off. This feature requires Javascript. Click on a formula to zoom.
Abstract
Objectives: Intravenous iron is the recommended treatment for patients with iron deficiency anemia (IDA) where oral iron is ineffective or rapid iron replenishment is required. Two high-dose, rapid-administration intravenous iron formulations are currently available in the UK: iron isomaltoside 1000/ferric derisomaltose (IIM) and ferric carboxymaltose (FCM). An indirect treatment comparison (ITC) recently showed that improvement from baseline hemoglobin was significantly larger with IIM than FCM. The objective was to use the ITC findings to evaluate the cost-effectiveness of IIM versus FCM from the UK healthcare payer perspective.
Methods: A patient-level simulation model was developed in R to evaluate the cost per patient experiencing hematological response with IIM versus FCM. The model generated a simulated cohort from parametric distributions of baseline hemoglobin and bodyweight. Changes in hemoglobin were modeled based on data from the ITC, covaried with baseline hemoglobin based on patient-level data from a randomized controlled trial. Posological models of the iron formulations were developed based on the summaries of product characteristics. UK-specific costs were based on healthcare resource groups.
Results: The proportion of patients experiencing hematological response was 9.0% higher with IIM relative to FCM (79.0% versus 70.0%), based on modeling of clinically realistic, correlated distributions of baseline hemoglobin and change from baseline hemoglobin. The mean number of infusions needed to administer the required dose was 1.92 with FCM, versus 1.38 with IIM, resulting in costs of £637 and £457 per treated patient with FCM and IIM respectively, corresponding to respective costs of £910 and £579 per responder.
Conclusions: The analysis showed that using IIM rather than FCM in patients with IDA was dominant and would reduce the number of iron infusions required to correct iron deficiency, thereby reducing the costs associated with IDA treatment and simultaneously increasing the proportion of patients with IDA experiencing a clinically meaningful hematological response.
Background and aims
Iron deficiency anemia (IDA) is defined as a low red blood cell count or hemoglobin concentration in the presence of low iron. Iron is required for heme production during erythroblast maturation and may be depleted through reduced iron intake or absorption, or increased iron utilization or lossCitation1. Anemia is defined by a hemoglobin level two standard deviations below the age and sex-normalized average, while iron deficiency is then confirmed by a serum ferritin level of less than 15 μg/L or 30 μg/L (depending on the specific guidelines and indication), and ruled out by a serum ferritin level greater than 100 μg/LCitation2,Citation3. Other erythrocytic changes such as hypochromia, microcytosis, anisocytosis, and poikilocytosis may also occur as a result of iron deficiency. These changes to the composition and nature of the blood commonly manifest as a series of symptoms including fatigue, dyspnea, and headache. Less common symptoms include cognitive dysfunction, restless leg syndrome, vertigo, syncope, pica and palpitations with more serious symptoms such as angina, marked ankle edema and dyspnea at rest, manifesting at hemoglobin concentrations <7 g/dLCitation2.
Intravenous iron has been shown to be superior to oral iron in achieving a rapid and sustained hematological response in patients with IDA of various etiologies, including inflammatory bowel disease (IBD), chronic heart failure (CHF), chronic kidney disease (CKD), pregnancy, and when administered prior to surgery for a wide range of indicationsCitation4–9.
Two high-dose, rapid-administration intravenous iron formulations are currently available in the UK: iron isomaltoside 1000/ferric derisomaltose (Monofer, Pharmacosmos A/S, Holbaek, Denmark; IIM) and ferric carboxymaltose (Ferinject, Vifor, Paris, France; FCM). To date, only two randomized controlled trials (RCTs) have been published comparing the formulations directly in general IDA populationsCitation10–12. The PHOSPHARE trials were run at different centers, but were identically-designed having a primary endpoint of hypophosphatemia incidence (s-phosphate <2 mg/dL) within 35 days of treatment, with secondary hypophosphatemia endpoints of severe hypophosphatemia, time with hypophosphatemia, and proportion of patients with hypophosphatemiaCitation10,Citation11. The primary endpoint showed there to be a significantly higher incidence of all hypophosphatemia with FCM than IIM (74.4% versus 8.0% with IIM; p < .0001)Citation12. Incidence of severe hypophosphatemia was also significantly higher with FCM relative to IIM (11.3% versus 0.0%; p < .0001). Hematological response was included as a secondary endpoint in the PHOSPHARE RCTs and, based on the pooled analysis of both trials, response per gram of infused iron was higher with IIM than with FCM at 2.2 g/dL per gram versus 2.0 g/dL per gramCitation12.
Prior to the publication of the head-to-head PHOSPHARE data, a number of indirect comparisons of the high-dose iron formulations had been published based on various different studies and endpoints in a mixture of different IDA sub-populations. With regard to hematological response, in 2017 Aksan et al.Citation13 published the findings of a Bayesian network meta-analysis including five RCTs comparing the two high-dose, rapid-administration iron formulations with iron sucrose (IS) and oral iron in patients with IBD, reporting that “no statistically significant difference was found when comparing FCM, [IIM] and [iron sucrose]”. In 2019, Pollock and MudumaCitation14 published a systematic literature review and frequentist indirect treatment comparison (ITC) applying random effects models and the Bucher et al.Citation15 methodology to four RCTs including over 3,500 patients with IDA of multiple etiologies. The ITC found that the proportion of patients experiencing hematological response was 8.5% higher with IIM than FCM, but not significantly so (p = .089); however, the same ITC reported a significantly higher change from baseline hemoglobin with IIM relative to FCM (0.249 g/dL higher with IIM; p = .006)Citation15.
The objective of the present study was to evaluate the cost-effectiveness of IIM relative to FCM in the treatment of IDA from the perspective of a UK healthcare payer. Given the secondary nature of the hematological endpoints in the PHOSPHARE RCTs and the potential multiplicity and powering issues associated with interpreting secondary endpoints, the present analysis utilized the significant finding of a larger change from baseline hemoglobin with IIM relative to FCM from the 2019 ITCCitation15. This estimate of hematological response was used in concert with UK-specific cost data and patient-level data to facilitate realistic modeling of key hematological and bodyweight parameters. The analysis focused on patients with IDA of all etiologies except those receiving dialysis for CKD.
Methods
Model development
A patient-level simulation model was developed in the programming language R version 3.6.1 (R Foundation for Statistical Computing, Vienna, Austria) to model the cost-effectiveness of IIM versus FCM from the perspective of a UK healthcare payer ()Citation16. In line with technical guidance from the National Institute for Health and Care Excellence (NICE) Decision Support Unit, the patient-level simulation approach was selected based on the non-linearity of the relationship between baseline hemoglobin, bodyweight and iron need. Relative to an analytic modeling solution, the patient-level simulation approach also simplified the incorporation of stochastic variation into both patient characteristics and model parametersCitation17.
Figure 1. Model schematic.
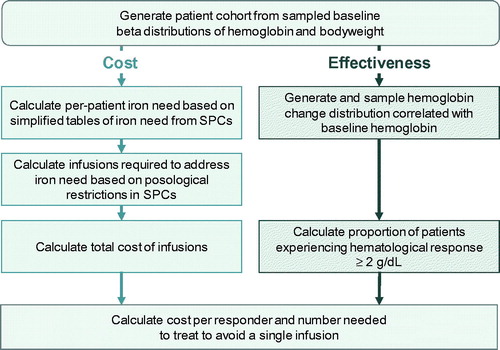
The model captured baseline distributions of hemoglobin and bodyweight, a distribution of the change from baseline hemoglobin correlated with baseline hemoglobin, and posological models of the two intravenous iron formulations based on the dosing and administration schedules described in the respective summaries of product characteristics (SPCs)Citation18,Citation19. The only modeled differences between the two simulation arms were the posological models for each of the two iron formulations, and the significant difference of +0.249 g/dL (95% confidence interval: 0.072 to 0.426 g/dL; p = .006) in the change from baseline hemoglobin with IIM relative to FCM as reported in the ITC conducted by Pollock and MudumaCitation14. The non-significant difference of 8.5% in the proportion of patients experiencing hematological response with IIM versus FCM in the ITC was not used as a model input, and therefore served as one means by which model performance was validated. The use of patient-level data (PLD) to establish appropriate measures of dispersion and correlation was a critical aspect of the modeling approach as incorrect or clinically implausible distributional assumptions would have materially affected the calculation of both the iron need and the proportion of patients experiencing hematological response.
In the base case analysis, mean baseline patient characteristics were based on weighted averages calculated from the studies included in the ITC (weighted average hemoglobin of 10.04 g/dL and bodyweight of 88.3 kg; )Citation20–23. Measures of dispersion around the means and the correlation between baseline hemoglobin and change in hemoglobin were aligned with PLD from a randomized controlled trial (RCT) of IIM versus IS; in the base case analysis, PLD from the PROVIDE RCT were used to parameterize transformed 2-parameter beta distributions of bodyweight and hemoglobinCitation21. While untransformed beta distributions are continuous and defined on the interval [0,1], as van Dorp and Mazzuchi note, the transformation Y = −log(X) transforms the [0,1] support of X into the [0,∞) support of Y while maintaining the flexibility of X, thereby facilitating the use of the distribution in non-bounded domainsCitation24 .The flexibility of the distribution shape makes the transformed, non-bounded beta distribution well-suited to matching specific distributions obtained from PLDCitation25.
Table 1. Characteristics of studies included in the indirect treatment comparison.
Beta distributions around baseline hemoglobin and bodyweight were parameterized based on the PLD from PROVIDE. The first shape “” parameters were derived by minimizing the sum of the square deviances of the beta quantile function probabilities at 2.5% and 97.5% from the 2.5% and 97.5% quantiles of the PLD using a function of the PLD mean as the second shape “
“ parameter in the quantile function. The second shape “
” parameters of the final beta distributions were then calculated as
where
was the ratio of the mean and maximum parameter values from the PLD. Deviance minimization was performed using a combination of golden section search and successive parabolic interpolation as implemented in the R optimize functionCitation26. The base case analysis was run by simulating 100,000 patients in each arm, generated by drawing from the parametric distributions around baseline characteristics using the default Mersenne twister random number generator in R 3.6.1Citation27.
After assignment of baseline patient characteristics, the iron dose required to correct the iron deficiency was calculated on a per-patient basis using the simplified tables of iron need from the respective SPCsCitation18,Citation19. The number of infusions needed to administer the required iron dose was then calculated based on the posological specifications of the two formulations as listed in the SPCs, with IIM being dosed up to 20 mg/kg in a single infusion, and FCM being dosed up to 1,000 mg in a single infusion.
An inverse correlation between baseline hemoglobin and the change from baseline hemoglobin after administration of intravenous iron has been observed in numerous previous RCTs such as Reinisch et al.Citation28 A realistic correlation between these model parameters was captured in the model using a Pearson product-moment correlation coefficient (PPMCC) calculated from the PLD from the PROVIDE RCTCitation21. The hemoglobin change distribution was sampled using an approach in which the residuals from an ordinary least squares regression of baseline hemoglobin as a predictor of change from baseline hemoglobin were combined with the PPMCC to correlate the change distribution with the baseline distribution:
For each arm, the model reported mean baseline hemoglobin, change from baseline hemoglobin, bodyweight, iron need, number of infusions required, and cost of infusions, in addition to standard deviations around all outcomes. From these outputs, the model then derived the proportion of patients experiencing hematological response (Hb change ≥2 g/dL) and the cost per responder in each arm. Based on these outcomes, the number needed to treat (NNT) to avoid a single infusion was calculated, along with an incremental cost-effectiveness ratio (ICER) expressed as an incremental cost per additional responder.
Costs
Costs from a UK healthcare payer perspective (ultimately that of the Department of Health) were based on healthcare resource group (HRG) day case tariffs () on the assumption that iron infusions would be conducted as elective day cases in the hospital setting. Given the national payer perspective, no market forces factor (MFF) was applied to the HRG tariffs to tailor the analysis to a specific geography within the UK.
Table 2. Overview of iron deficiency anemia treatment activity and tariffs by healthcare resource group.
Sensitivity analysis
A series of sensitivity analyses were conducted to evaluate the extent to which model outcomes were affected by changes to individual model parameters. Sensitivity analyses included using the lowest and highest HRG tariff values in place of the weighted average in the base case; deriving the distributional and correlative assumptions around baseline hemoglobin, bodyweight, and change from baseline hemoglobin from the NIMO study rather than the PROVIDE RCTCitation29; using the modified Ganzoni equation in place of the simplified tables of iron need to establish the per-patient iron requirement; and changing the seed for the random number generator used to generate the simulated cohort. This final analysis was conducted to establish the sensitivity of model outcomes to a systemic change in the random sequence used for distribution sampling (i.e. model stability).
Results
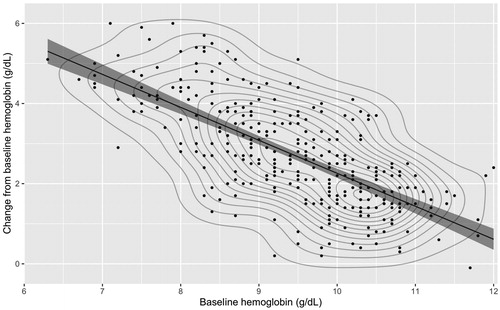
The analysis of PLD from the PROVIDE RCT showed a strong inverse correlation between baseline hemoglobin and change from baseline hemoglobin, with lower baseline hemoglobin values associated with larger increases in hemoglobin after intravenous iron treatment (). The PPMCC was −0.708 and least squares regression yielded a slope parameter of −0.619 with an intercept of 11.08 g/dL, representing a strong linear relationship in which each additional unit of baseline hemoglobin was associated with a 0.619 g/dL reduction in the change in hemoglobin following intravenous iron treatment.
Figure 2. Scatterplot, least squares regression, and contour plot of the relationship between baseline hemoglobin and change from baseline hemoglobin in patients in the PROVIDE randomized controlled trialCitation20.
The base case analysis of 100,000 patients in each arm showed that the simulated cohorts closely matched the distributional characteristics of the PLD from PROVIDE ( and ). The 0.249 g/dL difference across the distributions informed by the ITC was maintained, resulting in average post-treatment hemoglobin levels of 12.53 g/dL with FCM versus 12.78 g/dL with IIM ( and ). The proportions of patients experiencing a hemoglobin change ≥2 g/dL were 69.98% with FCM versus 79.05% with IIM. The average number of infusions per patient was 1.92 with FCM versus 1.38 with IIM, a difference of 0.54 infusions per patient, resulting in an NNT to avoid one infusion with IIM relative to FCM of 1.85.
Figure 3. Scatterplot and least squares regression models of baseline hemoglobin and change from baseline hemoglobin distributions for iron isomaltoside and ferric carboxymaltose in simulated patient cohorts of 100,000 patients in each arm.
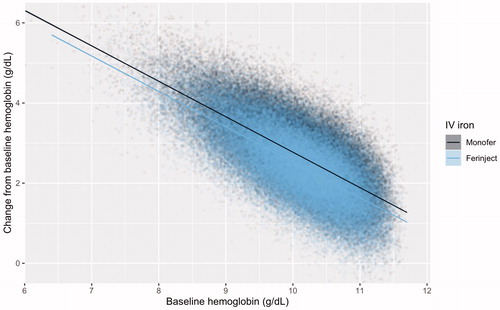
Table 3. Hematological, posological, and economic results from the base case analysis of 100,000 simulated patients.
The total cost of infusions based on HRGs was GBP 637 with FCM versus GBP 458 with IIM, corresponding to a saving of GBP 179 per patient with IIM. The cost per patient experiencing hematological response (≥2 g/dL increase from baseline hemoglobin) was GBP 910 with FCM versus GBP 579 with IIM representing a cost saving of GBP 331 per responder with IIM.
Sensitivity analyses
The analysis of PLD from the NIMO real-world study yielded results similar to those from the PROVIDE RCT data, showing a strong negative correlation between baseline hemoglobin and change from baseline. The PPMCC between baseline hemoglobin and change from baseline hemoglobin was −0.589, with a least squares regression analysis showing a slope parameter of −0.593 with an intercept of 11.52 g/dL, closely aligned with the regression analysis of the PROVIDE RCT PLD.
The analysis based on the NIMO distributional assumptions yielded very similar results to the base case, with the difference in the proportion of responders dropping from 9.1% to 8.9% and the difference in costs increasing from a saving of GBP 179 in the base case to a saving of GBP 189 with the NIMO data (). The analyses having the largest effect on outcomes were the use of the Ganzoni equation to calculate iron need and using the highest HRG tariff cost; switching to use the Ganzoni equation resulted in a reduction in both absolute and incremental costs, with savings with IIM down to GBP 132 from GBP 179 in the base case, while using the highest HRG tariff cost increased the cost savings with IIM to GBP 574.
Figure 4. Kernel density plots showing sampled beta distributions of (A) baseline hemoglobin and (B) change from baseline hemoglobin parameterized using patient-level data from the iron isomaltoside arm of the PROVIDE randomized controlled trial and the difference in change from baseline hemoglobin from an indirect treatment comparison. (C) The final modeled hemoglobin distributionsCitation15,Citation21. Abbreviations. FCM, ferric carboxymaltose; IIM, iron isomaltoside/ferric deriosmaltose; IV, intravenous.
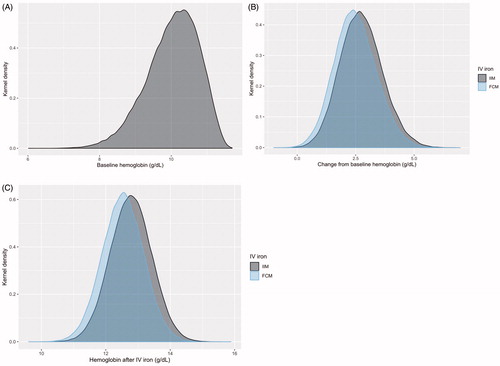
Table 4. One-way sensitivity analysis results.
Discussion
Based on the findings of an ITC of IIM versus FCM and PLD from a randomized study of patients with IDA, a patient-level simulation model projected that IIM would be more effective and cost-saving relative to FCM from the perspective of a UK healthcare payer.
The present analysis had a number of strengths. The distributional assumptions employed in the model were informed by PLD to ensure a clinically plausible simulation with regard to distributions of baseline hemoglobin, baseline bodyweight, change from baseline hemoglobin, and the correlation between baseline hemoglobin and change from baseline. The robustness of the modeling approach was also a key strength; changing the entire patient-level dataset from which the underlying distributional assumptions were derived resulted in only a minor change in the modeled outcomes.
The analysis also had limitations that should be acknowledged when interpreting the findings. The first was the reliance on a single clinical differentiator between the two iron formulations. While the source was an indirect treatment comparison based on RCTs which included over 3,500 patients at the time of randomization, the studies were diverse in terms of the etiology of IDA in the enrolled patient populations, and the anchor to IIM via iron sucrose was based on only one RCT, which included 511 patients at randomizationCitation20. Regarding etiology, the Onken et al.Citation21 study included 2,584 patients with non-dialysis-dependent CKD (NDD CKD) at the time of randomization and this was by far the largest study included in the ITC. However, a subgroup of patients with NDD CKD would likely be present in any sufficiently large population of patients with IDA and, since the present analysis evaluated the cost-effectiveness of a single course of treatment for IDA, the cost-effectiveness profile of IIM relative to FCM would not be expected to materially differ in patients with etiologies associated with recurrent or chronic IDA; each course of treatment would have the same underlying cost and effectiveness characteristics.
It is possible, even likely, that the significant difference in change from baseline hemoglobin reported in the ITC arose due to differences in dosing rather than any fundamental differences in the efficacy of the iron formulations. A pooled analysis of the hematological endpoints in the two PHOSPHARE RCTs did show that the response per gram of infused iron was significantly higher with IIM than FCM, but all of the hematological endpoints were secondary and the PHOSPARE study authors noted that they should be interpreted as exploratoryCitation12. Regardless of the exact response per unit iron infused, real-world studies such as NIMO and RCTs such as PROCEED have demonstrated that patients receiving higher doses of a given iron formulation experience a greater responseCitation28,Citation29. The hematological aspects of the present analysis were therefore predicated on a difference that could potentially be abolished by increasing the dose of FCM administered. This, however, serves to highlight the other fundamental driver of the analysis: posology. In a resource-constrained healthcare system, the posological differences between the iron formulations may be a critical factor in determining the cumulative dose of iron administered. The ability to administer >1,000 mg of IIM in a single infusion (in patients weighting >50 kg) may allow the iron deficit to be addressed with a single infusion of IIM, while dosing with FCM would be limited to 1,000 mg per infusion. In certain patients, these differences result in patients either receiving more infusions to correct the iron deficit with FCM than IIM or, owing to resource constraints, the patient not ultimately receiving a sufficient amount of iron to ameliorate their iron deficiency.
In considering the number of visits required to correct iron deficiency, it is important to consider other interactions that patients may have with the healthcare provider at which iron may be infused. IDA has multiple etiologies, and patients with, for example, IBD, may be in frequent contact with a clinician regarding other aspects of disease management such as administration of infliximab, adalimumab, or vedolizumab. In these instances, cost savings could, in theory, be realized by combining multiple treatments or consultations into the same visit, narrowing the difference in cost between the iron formulations in specific etiological subgroups. Intravenous infusions of iron may indeed be charged under an HRG corresponding to a primary diagnosis of, for example, IBD, although the complication “index” for the HRG is increased with a concomitant diagnosis of IDA in addition to the underlying primary diagnosis. For instance, the NHS National Casemix Office 2019/20 HRG Grouper shows a primary diagnosis of IBD combined with an OPCS code for intravenous infusion would be billed under HRG FD02H, associated with a unit cost of GBP 421 in 2018/19. With the addition of IDA as a secondary diagnosis, the HRG changes to FD02G, which was associated with unit cost of GBP 673 in 2018/19. The difference of GBP 252 is comparable to the 2019/20 tariff value for iron deficiency anemia without complications (SA04L) of GBP 257.
Furthermore, patients with extremely low hemoglobin levels would be likely to have more frequent interactions with clinicians, including ongoing laboratory tests to confirm (or otherwise) the persistence hemoglobin values in the normal range. In line with the PLD from PROVIDE and NIMO, the patient-level simulation included a small proportion of patients with hemoglobin concentrations <7 g/dL. However, further to the above point on the etiology of IDA, the present analysis focused on the cost-effectiveness of a single course of treatment for IDA, the drivers of which would not be expected to change between courses of treatment in patients with chronic or recurrent IDA. While patients with low hemoglobin may also be undergoing more frequent routine monitoring at which iron could be simultaneously infused, the charges for iron infusions and routine monitoring would either fall under different HRG tariffs or be billed under tariffs with higher complication indices, at least partially mitigating the potential for cost savings from the national payer perspective, and hence also reducing any potential effect on the findings of the analysis.
Finally, the present analysis did not capture costs of sequelae of IDA, which would be anticipated to be equivalent regardless of the iron formulation in use, or of adverse events following iron infusion, where there is a growing base of evidence to suggest that differences do exist between the iron formulations. Recent studies such as the PHOSPHARE RCTs have shown that FCM results in a significant increase in the incidence of hypophosphatemia relative to IIM, while a recent evidence synthesis effort based on prospective studies including over 8,000 patients has shown that there may also be an increased risk of serious or severe hypersensitivity reactions with FCM relative to IIMCitation12,Citation30. Future modeling efforts could capture the incidence and consequences of these adverse events in addition to the initial administration costs of the iron formulations.
Conclusions
The present analysis showed that using IIM rather than FCM in patients with IDA is cost-effective and would be expected to reduce the number of iron infusions required to correct iron deficiency, thereby reducing the costs associated with IDA treatment and simultaneously increasing the proportion of patients with IDA experiencing a clinically meaningful hematological response.
Transparency
Declaration of funding
Pharmacosmos A/S funded the development of the simulation model and analysis, preparation of the manuscript, and the article processing charge for the manuscript.
Declaration of financial/other relationships
GM is a full-time employee of Pharmacosmos A/S, the marketing authorization holder for iron isomaltoside 1000/ferric derisomaltose in the European Union. RFP is a director and shareholder in Covalence Research Ltd, which received consultancy fees from Pharmacosmos A/S to develop the simulation model and analysis, and prepare the manuscript.
JME peer reviewers on this manuscript have received an honorarium from JME for their review work, but have no other relevant financial relationships to disclose.
Author contributions
GM and RFP were involved in the conception and design of the analysis; RFP developed the model to analyze the data and identified the parameters of the UK analysis; RFP prepared the first draft of the manuscript; GM revised the manuscript critically for intellectual content; and GM and RFP approved the final version to be published. GM and RFP agree to be accountable for all aspects of the work.
Acknowledgements
No assistance in the preparation of this article is to be declared.
References
- Camaschella C. Iron-deficiency anemia. N Engl J Med. 2015;372(19):1832–1843.
- National Institute for Health and Care Excellence. Anaemia - iron deficiency. Clinical Knowledge Summary. Available from: https://cks.nice.org.uk/anaemia-iron-deficiency Last accessed November 13, 2019.
- Dignass AU, Gasche C, Bettenworth D, et al. European Crohn’s and Colitis Organisation [ECCO]. European consensus on the diagnosis and management of iron deficiency and anaemia in inflammatory bowel diseases. J Crohns Colitis. 2015;9(3):211–222.
- Avni T, Bieber A, Steinmetz T, et al. Treatment of anemia in inflammatory bowel disease–systematic review and meta-analysis. PLoS One. 2013;8(12):e75540.
- Bonovas S, Fiorino G, Allocca M, et al. Intravenous Versus Oral Iron for the Treatment of Anemia in Inflammatory Bowel Disease: A Systematic Review and Meta-Analysis of Randomized Controlled Trials. Medicine (Baltimore)). 2016;95(2):e2308.
- Avni T, Leibovici L, Gafter-Gvili A. Iron supplementation for the treatment of chronic heart failure and iron deficiency: systematic review and meta-analysis. Eur J Heart Fail. 2012;14(4):423–429.
- O'Lone EL, Hodson EM, Nistor I, et al. Parenteral versus oral iron therapy for adults and children with chronic kidney disease. Cochrane Database Syst Rev. 2019;2:CD007857.
- Susantitaphong P, Alqahtani F, Jaber BL. Efficacy and safety of intravenous iron therapy for functional iron deficiency anemia in hemodialysis patients: a meta-analysis. Am J Nephrol. 2014;39(2):130–141.
- Reveiz L, Gyte GM, Cuervo LG, Casasbuenas A. Treatments for iron-deficiency anaemia in pregnancy. Cochrane Database Syst Rev. 2011;10:CD003094.
- Pharmacosmos A/S. A Trial Comparing the Incidence of Hypophosphatemia in Relation to Treatment With Iron Isomaltoside and Ferric Carboxymaltose in Subjects With Iron Deficiency Anaemia (IDA-04). NCT03238911. Available from: https://clinicaltrials.gov/ct2/show/NCT03238911 Last accessed November 10, 2019.
- Pharmacosmos A/S. A Trial Comparing the Incidence of Hypophosphatemia in Relation to Treatment With Iron Isomaltoside and Ferric Carboxymaltose in Subjects With Iron Deficiency Anaemia (IDA-05). NCT03237065. Available from: https://clinicaltrials.gov/ct2/show/NCT03237065 Last accessed November 10, 2019.
- Wolf M, Rubin J, Achebe M, et al. Effects of Iron Isomaltoside vs Ferric Carboxymaltose on Hypophosphatemia in Iron-Deficiency Anemia: Two Randomized Clinical Trials. JAMA. 2020;323(5):432–443.
- Aksan A, Işık H, Radeke HH, et al. Systematic review with network meta-analysis: comparative efficacy and tolerability of different intravenous iron formulations for the treatment of iron deficiency anaemia in patients with inflammatory bowel disease. Aliment Pharmacol Ther. 2017;45(10):1303–1318.
- Pollock RF, Muduma G. A systematic literature review and indirect comparison of iron isomaltoside and ferric carboxymaltose in iron deficiency anemia after failure or intolerance of oral iron treatment. Expert Rev Hematol. 2019;12(2):129–136.
- Bucher HC, Guyatt GH, Griffith LE, et al. The results of direct and indirect treatment comparisons in meta-analysis of randomized controlled trials. J Clin Epidemiol. 1997;50(6):683–691.
- R Core Team. R: A language and environment for statistical computing. R Foundation for Statistical Computing; Vienna, Austria; 2019. Available from: https://www.R-project.org/ Last accessed November 9, 2019.
- Davis S, Stevenson M, Tappenden P, et al. NICE DSU Technical Support Document 15: Cost-Effectiveness Modelling using Patient-Level Simulation. Available from: http://nicedsu.org.uk/wp-content/uploads/2016/03/TSD15_Patient-level_simulation.pdf. Last accessed March 5, 2020.
- Pharmacosmos A/S. Monofer 100mg/ml solution for injection/infusion. Summary of Product Characteristics. Available from: https://www.medicines.org.uk/emc/product/5676/smpc Last accessed November 19, 2019.
- Vifor France. Ferinject (ferric carboxymaltose). Summary of Product Characteristics. Available from: https://www.medicines.org.uk/emc/product/5910 Last accessed November 19, 2019.
- Derman R, Roman E, Modiano MR, et al. A randomized trial of iron isomaltoside versus iron sucrose in patients with iron deficiency anemia. Am J Hematol. 2017;92(3):286–291.
- Onken JE, Bregman DB, Harrington RA, et al. Ferric carboxymaltose in patients with iron-deficiency anemia and impaired renal function: the REPAIR-IDA trial. Nephrol Dial Transplant. 2014;29(4):833–842.
- Evstatiev R, Marteau P, Iqbal T, Khalif IL, Stein J, Bokemeyer B, Chopey IV, Gutzwiller FS, Riopel L, Gasche C; FERGI Study Group. FERGIcor, a randomized controlled trial on ferric carboxymaltose for iron deficiency anemia in inflammatory bowel disease. Gastroenterology. 2011;141(3):846–853.e1–2.
- Mahey R, Kriplani A, Mogili KD, et al. Randomized controlled trial comparing ferric carboxymaltose and iron sucrose for treatment of iron deficiency anemia due to abnormal uterine bleeding. Int J Gynaecol Obstet. 2016;133(1):43–48.
- Gupta AK, Nadarajah S. Handbook of Beta Distribution and Its Applications. 2004. 1st Edition. CRC Press, Boca Raton, FL, USA. ISBN 9780429152887.
- Gavaskar U. A comparison of two elicitation methods for a prior distribution for a binomial parameter. Manag Sci. 1988;34:784–790.
- Brent RP. Algorithms for Minimization without Derivatives. 1973. Prentice-Hall, Englewood Cliffs, NJ, USA. ISBN 0130223352.
- Matsumoto M, Nishimura T. Mersenne twister: a 623-dimensionally equidistributed uniform pseudo-random number generator. ACM Trans Model Comput Simul. 1998;8(1):3–30.
- Reinisch W, Staun M, Tandon RK, et al. A randomized, open-label, non-inferiority study of intravenous iron isomaltoside 1,000 (Monofer) compared with oral iron for treatment of anemia in IBD (PROCEED). Am J Gastroenterol. 2013;108(12):1877–1888.
- Frigstad SO, Haaber A, Bajor A, et al. The NIMO Scandinavian Study: A Prospective Observational Study of Iron Isomaltoside Treatment in Patients with Iron Deficiency. Gastroenterol Res Pract. 2017;2017:4585164.
- Pollock RF, Biggar P. Indirect methods of comparison of the safety of ferric derisomaltose, iron sucrose and ferric carboxymaltose in the treatment of iron deficiency anemia. Expert Rev Hematol. 2020;13(2):187–195.