
Abstract
Aims: This study aims to develop a mapping algorithm that can be used to predict 5-level EQ-5D (EQ-5D-5L) utility scores from the Psoriasis Disability Index (PDI) for further use in cost-utility analysis among psoriasis patients.
Materials and Methods: A total of 321 participants with psoriasis was recruited in a dermatology clinic from a tertiary hospital in China. The EQ-5D-5L utility scores were scored using the Chinese-specific value set. Three model specifications were used and each one was estimated using three different statistical techniques, including the ordinary least squares (OLS), the Tobit regression and the generalized linear model (GLM). The goodness-of-fit of mapping performance was estimated by using two common indicators: the mean absolute error (MAE) and the mean square error (MSE).
Results: A final validated sample of 321 psoriasis patients was analyzed in the study. The patients had a mean ± standard deviation (SD) age of 39.7 ± 12.9 years, and the EQ-5D-5L state utility score is 0.899 ± 0.106. Among all the models considered, the OLS linear model based on the four PDI item scores was selected as the best model due to higher accuracy (MAE = 0.1334 and 0.1557 for the estimation and validation sample separately).
Limitations: The main limitation of this study is that the survey site was limited to one hospital and not more broadly representing the whole of China. Additionally, there are some missing data in the full sample and an absence of an external dataset to validate the algorithms.
Conclusions: The mapping algorithms reported in this paper can be used to predict the EQ-5D-5L utilities from the PDI; however, similar to other mapping studies in the literature it can only serve as the second-best approach to elicit utilities from disease-specific instruments.
Introduction
Psoriasis is an immune-mediated polygenic skin disease, which is featured by the squamous erythema or plaques, localized or widely distributedCitation1. Psoriasis is a common skin disease and it occurs worldwideCitation2. The prevalence of psoriasis varies a lot in different races, nations and regions, and people with lighter color skin tend to suffer this disease. Europeans have the highest prevalence, varying from 2.3% (Sweden) to 6.5% (Germany)Citation3. In China, the prevalence for psoriasis was found to be 0.47% among adults in 2012Citation4.
Psoriasis has been proved to not only be associated with an increased risk of cardiovascular disease, but also heavily impacts on patients’ physical and mental healthCitation5. It is important to measure the health-related quality of life and especially the health state utility scores of psoriasis patients and, based on which the cost-utility analysis can be conducted. The Psoriasis Disability Index (PDI) is a commonly used scale to measure the quality of life among psoriasis patients. However, it is not a preference-based scale and cannot be used to elicit health state utility scores and calculate quality-adjusted life years (QALYs). The 5-level EQ-5D questionnaire (EQ-5D-5L) is a widely used preference-based instrument that can be used to calculate health state utility scores.
Mapping is a technique that can be used to predict health state utility scores from non-preference-based instrumentsCitation6. These derived utility scores can facilitate the calculation of QALYs and be used in health economic evaluations. This research aims to develop a mapping algorithm from PDI onto EQ-5D-5L utility scores which is based on psoriasis patients in China. The study follows the standardized guidelines that have been developed for the reporting of mapping studiesCitation7,Citation8.
Materials and methods
Study population
This study was conducted in the dermatological outpatient clinics of Xiangya Hospital, China and the data was collected from psoriasis patients. The sample exclusion and recruitment criteria have been reported beforeCitation9. The research questionnaire was divided into two parts: Firstly, the patients completed the basic information and instruments questions; Secondly, the doctors or nurses filled out the clinical information. Informed consent was obtained from all respondents. The study was approved by the Ethics Review Board of the School of Medicine, Shandong University (Reference No. LL-201401044), and the research adhered to the tenets of the Declaration of Helsinki.
Instruments
The PDI is a disease-specific instrument commonly used to measure the quality of life of psoriasis patientsCitation10. It contains 15 items which covers 5 dimensions: daily activities, work, personal relations, leisure and treatment. All items have followed the Likert 4-point scale scoring method, it scored from 0 to 3. Hence, the total summary score ranges from 0 to 45, with a higher score indicating a greater limitation experienced due to psoriasis. Any questionnaire missing responses to two or more items was excluded from the analysisCitation11.
The EQ-5D-5L is a generic preference-based health state utility scale which includes a health descriptive system based on five dimensionsCitation12. The dimensions cover mobility, self-care, usual activities, pain/discomfort and anxiety/depression, and characterized by five levels (i.e. no problems, slight problems, moderate problems, severe problems, and extreme problems)Citation13. Liu et al.Citation14 developed a Chinese-specific utility algorithm, based on a TTO survey of 1,271 China residents, which provides a theoretical range of utility scores from −0.149 to 1.0.
Conceptual overlap
The estimation of mapping algorithms between disease-specific measures and preference-based generic measures relies on conceptual overlap between the dimensions of the PDI and EQ-5D-5L. It is important to inspect the overlap or correlation between two instruments before a mapping study is conducted. Thus, we started our analyses by exploring the data to find the similarities between the two instruments using Spearman rank correlation coefficients. The strength of correlation can be defined as follows: very weak (0–0.19), weak (0.20–0.39), moderate (0.40–0.59), strong (0.60–0.79), and very strong (0.80–1)Citation15.
Crosswalks
Three model specifications were taken into consideration for this study. The details of the three different sets of explanatory variables are as follows: Model 1 – PDI total scores, age and gender; Model 2 – PDI subscale scores, age and gender; Model 3 – PDI item scores, age and gender. Based on previous literature and the analysis of distribution of this study data, three regression-based types of statistical algorithms were used to construct predicting models. The ordinary least square (OLS) model, used to estimate the unknown parameters in a linear regression model by minimizing the sum of squared errors from the data, is the most widely used method in the mapping literatureCitation16. As the dependent variable showed a ceiling effect, the Tobit model was used in this study for the purpose of dealing with the censored nature of EQ-5D-5L data (i.e. it can solve the issue of a large proportion of EQ-5D-5L utility having a full health of 1.0 in the sample distribution)Citation17. The Generalized Linear Model (GLM) method is more applicable for the non-normal distribution of dependent variables and predict the disutility values (1-EQ-5D-5L utility)Citation18,Citation19. The GLM which was estimated using a Gaussian distribution with a link function of log form was found to be appropriate for this study.
All variables were considered in the mapping functions, including total scores, 5 individual dimensions scores and all 15 items of the PDI. The stepwise regression method was used to select the final statistical significant (p < .05) predictors into the mapping function.
Goodness of fit
The goodness-of-fit of fitting models were tested on two commonly used indicators, namely, mean absolute error (MAE) and mean square error (MSE)Citation20. In addition, the Spearman rank correlation coefficients were also examined to test the strength of correlations between the predicted values and observed values.
On account of no external data being available for this study, the hold-out method was applied to validate the alternative models, which means that all samples were separated into two groups randomly: 70% of the data (estimation dataset, N = 225 patients) was selected to generate the mapping models. The remaining 30% (validation dataset, N = 96 patients) was reserved for validation to test the goodness-of-fit of the models. Theoretically, the number of estimation sample should be larger than the validation set to improve the accuracy of model prediction. And this method was to solve the dataset inadequacy problem in the study. This method has been published previouslyCitation21,Citation22. For example, Kim et al.Citation23 have divided a total sample of 199 breast cancer patients into two groups using computer-generated random numbers: 75% of the sample was assigned to construct mapping models while the rest 25% was used to validate. All statistical analyses were conducted in Stata version 14.0 (Stata Corp LP, College Station, TX, USA).
Results
Patient characteristics
A total of 351 patients who were diagnosed with psoriasis were interviewed in the study. Of them, thirty patients were excluded because of missing responses to two or more questions of PDI. A final included sample of 321 patients (91.45%) were analyzed in this study.
Patient characteristics are described in . The mean age of patients was 39.7 ± 12.9 years, and range from 16 to 80 years. Most of the participants were male (71%), 73.8% were married, 60.4% lived in an urban area, and almost 90% had completed secondary school and higher education. The mean duration of disease was 8.6 ± 9.3 years, varying from 0.1 to 48 years. Based on the PASI, half of the (54.8%) respondents had mild psoriasis conditions.
Table 1. Patient characteristics.
shows the summary statistics of the estimation and validation sets of the outcome measures, EQ-5D-5L and PDI, and further detailed outcomes of dimensions and items of PDI scores. The means (SD) EQ-5D-5L utility score were 0.91 (0.10) and 0.87 (0.11), whilst the means (SD) of the total PDI score were 36.34 (6.69) and 36.80 (4.72), in the estimation set and validation set respectively. Among the five PDI dimensions scores, the dimension with the highest scores was Daily activities, whilst the dimension scoring the lowest was Treatment. As regard to the item scores, the highest score was observed for the item of More Smoke/Drink (see for more details).
Table 2. Descriptive statistics for health utility and HRQoL variables.
Development of mapping models
The correlation coefficients between EQ-5D-5L utility and PDI scores have been calculated. It was found that there is a moderate correlation relationship (r = −0.4204) between EQ-5D-5L utility and PDI total scores. And relative weak correlations were observed between EQ-5D-5L utility and the five PDI dimensions, which ranged from 0.2139 (Treatment) to 0.3726 (Personal relations). The correlation relationship between EQ-5D-5L utility and PDI items varies from very weak to weak, and almost every item has a weak correlation with the EQ-5D-5L utility except for items of Communal changing and More smoke/drink (item13 and item14). And all correlation coefficients were statistically significant (p < .001). See details in .
Table 3. Spearman rank correlations of PDI with EQ-5D-5L values (estimation sample, n = 225).
The goodness-of-fit estimation and validation results for each of the mapping models are reported in and separately. We have used three statistical algorithms to construct nine models, including OLS (OLS1, OLS2, OLS3), Tobit (Tobit1, Tobit2, Tobit3), GLM (GLM1, GLM2, GLM3,). As can be seen from the tables, the predicted mean values all over-predict the true mean value, and the same with the median comparisons. The predicted minimum values over-predict the true value due to the proportion of less than 0.5 values is only 10%. And the maximum values are nearly the same as the true value. Overall speaking, the Model3 in almost every statistical algorithm has relative lower values except for the method of Tobit in the estimation results. To rank the fitting method from the low value to high value based on lower MAE value, we can find the OLS3, the Tobit3 and the GLM3 are the best models in the separate model specifications. We finally selected OLS3 as the best fitting model based on the smallest MAE and MSE values. And the correlation coefficient between EQ-5D observed value and predicted value in the estimation set and validation set is 0.4801 and 0.3693, respectively. See details in and .
Table 4. EQ-5D-5L Goodness-of-fit results from estimation analyze (N = 225).
Table 5. EQ-5D-5L Goodness-of-fit results from validation analyze (N = 96).
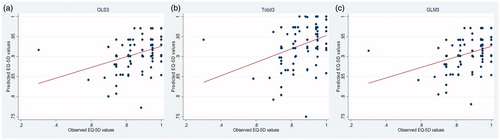
The scatter plots of and present observed values versus predicted values for the best-selected Model in the separate specification method both from estimation and validation samples.
Figure 1. Scatter plot of observed versus predicted EQ-5D-5L from estimation sample.
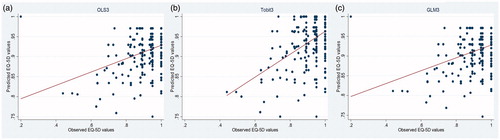
Figure 2. Scatter plot of observed versus predicted EQ-5D-5L from validation sample.
The coefficients and standard errors from the above selected the best model in the separate specification method, i.e. OLS3, Tobit3, and GLM3 are shown in . The items of House/garden work (N1), Time off work (N6), Social relations (N10) and Sport difficulties (N12) were significantly included in the best-selected models may because of the relatively high correlation with EQ-5D-5L utility scores. The mapping equation is showed details in .
Table 6. Coefficients and standard errors of the best model in every method.
Table 7. Recommended models for deriving utilities from PDI scores.
Discussion
The algorithms reported in this study can be used to derive EQ-5D-5L utility scores and further facilitate to calculation the QALYs in the absence of health utility data when only the PDI instrument is administrated. Currently, many mapping studies on psoriasis have used the Dermatology Life Quality Index (DLQI) as the source scale, and based on a widely literatures search, this study is the first mapping study which use the PDI as the source scale to dateCitation24–26. The final best model was chosen based on the smallest MAE values. Three models were selected as the optimal model by comparing the goodness-of-fit indicators mentioned in the Method part. And they have been listed in for readers or researchers to reference. In addition to selecting the Tobit3 as the best mapping model conditional on lowest MAE value, the OLS3 and GLM3 should also be considered as supplementary models in the sensitivity analysis.
The Model3 tends to have better-predicting performance based on lower MAE or MSE values compared to other models. And Tobit3 was validated to be the best fitting model for both the estimation sample and validation sample, which proved that the selected model was a robust fitting model. In addition, it can be found that only Tobit models over-predicted the observed maximum of 1, and it has been adjusted to fit the therotical range. The predicted values are more concentrated in the range of 0.8 to 1, it can be speculated that the model predicts the higher, rather than lower values. And it can be seen from the tables that the predicted values tend to underpredict the highest utility values while overpredicting the EQ-5D-5L utility scores of the more severe status of psoriasis patients.
The distribution of predicted values is consistent with previous mapping studies, which means tending to underpredict the EQ-5D-5D utility values for better health states and overpredicting the more severe health states. The minimum predicted values in this study have been severly underpredicted since the lower EQ-5D values (<0.4) account for the only 1% proportion of the total samples.
The Mapping method can be used for calculating the health utility and further utilized in pharmacoeconomics evaluations, which has been taken into effect in China for drug price negotiation. By this method, the affordability and accessibility of drugs for patients with psoriasis can be promoted, and the quality of life of patients with psoriasis can be further improved.
This study is subject to several limitations. Firstly, the survey site was limited to one hospital and was not representating the whole of China. Secondly, there are some missing data in the full sample and we have to exclude 30 patients (<10% of the sample) from the mapping analysis. However, this is not uncommon in the literatureCitation27 and it is unlikely to impact the relationship between PDI and EQ-5D-5L. Thirdly, an external dataset will be ideal to examine the mapping performance although internal validation has been widely used in the literature.
Conclusions
The mapping algorithms reported in this paper can be used to predict the EQ-5D-5L utilities from the PDI; however, similar to other mapping studies in the literature it can only serve as the second best approach to elicit utilities from disease-specific instruments. The external data should be collected to validate the selected algorithm in the future.
Transparency
Declaration of funding
The funding was provided by the National Natural Science Foundation of China, general projects (No. [2018] 81573049) and the Scientific Research Foundation for the Returned Overseas Chinese Scholars, State Education Ministry (No. [2015]311).
Declaration of financial/other interests
TL and SL are employees of Shandong University, which received funding to conduct this study. JS and YK are employees of Xiangya Hospital who are responsible for data collection and analysis and their institution have received study grants from Central South University. YZ is an employee of Heping Hospital and his institution has received research support from Changzhi Medical College.
JME peer reviewers on this manuscript have no relevant financial or other relationships to disclose.
Author contributions
JS was responsible for analyzing the data and finishing the first manuscript. TL reviewed the whole article and rectified the core mistakes of results. SL and YK contrived the thinking of this study. YZ corrected some grammar mistakes of manuscript and came up with some advice for this research. All authors approved the final draft.
Ethical approval
The study has acquired the support from the Ethics Review Board of the School of Medicine, Shandong University (Reference No. LL-201401044), and the research abided by the tenets of the Declaration of Helsinki.
Acknowledgements
The authors thank all the contributions for this study.
References
- Parisi R, Symmons DP, Griffiths CE, et al. Global epidemiology of psoriasis: a systematic review of incidence and prevalence. J Invest Dermatol. 2013;133:377–385.
- Naldi L, Mercuri SR. Epidemiology of comorbidities in psoriasis. Dermatol Ther. 2010;23:114–118.
- Raychaudhuri SP, Farber EM. The prevalence of psoriasis in the world. J Eur Acad Dermatol Venerol. 2001;15:16–17.
- Ding X, Wang T, Shen Y, et al. Prevalence of psoriasis in China: a population-based study in six cities. Eur J Dermatol. 2012;22:663–667.
- Krueger G, Koo J, Lebwohl M, et al. The impact of psoriasis on quality of life: results of a 1998 National Psoriasis Foundation patient-membership survey. Arch Dermatol. 2001;137:280.
- Longworth L, Yang Y, Young T, et al. Use of generic and condition-specific measures of health-related quality of life in NICE decision-making: a systematic review, statistical modelling and survey. Health Technol Assess. 2014;18:1–224.
- Petrou S, Rivero-Arias O, Dakin H, et al. The MAPS reporting statement for studies mapping onto generic preference-based outcome measures: explanation and elaboration. PharmacoEconomics. 2015;33:993–1011.
- Wailoo AJ, Hernandez-Alava M, Manca A, et al. Mapping to estimate health-state utility from non–preference-based outcome measures: an ISPOR Good Practices for Outcomes Research Task Force Report. Value Health. 2017;20:18–27.
- Liu L, Li S, Zhao Y, et al. Health state utilities and subjective well-being among psoriasis vulgaris patients in mainland China. Qual Life Res. 2018;27:1323–1333.
- Finlay AY, Coles EC. The effect of severe psoriasis on the quality of life of 369 patients. Br J Dermatol. 1995;132:236–244.
- He Z, Lu C, Ou A, et al. Reliability and validity of the Chinese version of the Psoriasis Disability Index (PDI) in Chinese patients with psoriasis. Health Qual Life Outcomes. 2012;10:37–37.
- Rabin R, De-Charro F. EQ-5D: a measure of health status from the EuroQol Group. Ann Med. 2001;33:337–343.
- Herdman M, Gudex C, Lloyd A, et al. Development and preliminary testing of the new five-level version of EQ-5D (EQ-5D-5L). Qual Life Res. 2011;20:1727–1736.
- Nan L, Liu G, Li M, et al. Estimating an EQ-5D-5L Value Set for China. Value Health. 2017;20:662–669.
- Swinscow T, Campbell M. Statistics at square one. 9th ed. London: BMJ Publishing Group; 1997.
- Longworth L, Rowen D. Mapping to obtain EQ-5D utility values for use in NICE health technology assessments. Value Health. 2013;16:202–210.
- Whitehurst DG, Bryan S. Another study showing that two preference-based measures of health-related quality of life (EQ-5D and SF-6D) are not interchangeable. But Why Should we Expect Them to Be? Value Health. 2011;14:531–538.
- Lamu AN, Chen G, Gamst-Klaussen T, et al. Do country-specific preference weights matter in the choice of mapping algorithms? The case of mapping the Diabetes-39 onto eight country-specific EQ-5D-5L value sets. Qual Life Res. 2018;27:1801– 1814.
- Fox J. Effect displays for generalized linear models. Sociol Methodol. 1987;17:347–361.
- Brazier J, Deverill M, Green C. A review of the use of health status measures in economic evaluation. J Health Serv Res Policy. 1999;4:174–184.
- Gillard PJ, Devine B, Varon SF, et al. Mapping from disease-specific measures to health-state utility values in individuals with migraine. Value Health. 2012;15:485–494.
- Kim SH, Kim SO, Lee SI, et al. Deriving a mapping algorithm for converting SF-36 scores to EQ-5D utility score in a Korean population. Health Qual Life Outcomes. 2014;12:145.
- Kim EJ, Ko SK, Kang HY. Mapping the cancer-specific EORTC QLQ-C30 and EORTC QLQ-BR23 to the generic EQ-5D in metastatic breast cancer patients. Qual Life Res. 2012;21:1193–1203.
- Blome C, Beikert FC, Rustenbach SJ, et al. Mapping DLQI on EQ-5D in psoriasis: transformation of skin-specific health-related quality of life into utilities. Arch Dermatol Res. 2013;305:197–204.
- Davison NJ, Thompson AJ, Turner AJ, et al. Generating EQ-5D-3L utility scores from the Dermatology Life Quality Index: a mapping study in patients with psoriasis. Value Health. 2018;21:1010–1018.
- Herédi E, Rencz F, Balogh O, et al. Exploring the relationship between EQ-5D, DLQI and PASI, and mapping EQ-5D utilities: a cross-sectional study in psoriasis from Hungary. Eur J Health Econ. 2014;15:S111–S119.
- Starkie HJ, Briggs AH, Chambers MG, et al. Predicting EQ-5D values using the SGRQ. Value Health. 2011;14:354–360.