
Abstract
Aims
Obinutuzumab (GA101; G) is a new treatment for follicular lymphoma (FL) that is anticipated to have greater efficacy than the current treatment, rituximab (R). The aim of this study was to evaluate the cost-effectiveness of G plus chemotherapy (G + Chemo) against that of R plus chemotherapy (R + Chemo) for patients in Japan with previously untreated FL.
Materials and methods
We localized a previously reported cost-effectiveness model using the Japanese cost data. For estimating costs adapted in the model, FL patients treated with R were identified from Japanese hospital-based claims database and classified into three treatment regimen groups according to chemotherapies used with R: CHOP, CVP, and bendamustine (B). Based on services per patient and cost items, parameters determining the cost amounts were derived using a multivariate generalized linear mixed model to estimate the direct medical costs for each treatment regimen group for G and R. For the utility, same values in the previous model were used. Lifetime cost and quality-adjusted life year (QALY) were estimated under the payer’s perspective.
Results
The calculated incremental cost-effectiveness ratios (ICERs) in million JPY per QALY for G-CHOP vs. R-CHOP, G-CVP vs. R-CVP, and G-B vs. R-B were 5.4, 4.3, and 4.8, respectively. ICERs were lower than 7.5 million JPY per QALY, which is the cost-effectiveness threshold for cancer treatments, and showed that G + Chemo is a cost-effective treatment regimen for Japanese patients with previously untreated FL. Lifetime direct medical costs were lowest in the R-B group because hospitalization costs that accounted for most of the total cost were lowest in this group.
Limitations and conclusions: The cost-effectiveness of G + Chemo is acceptable in Japan. Differences in the direct medical costs among treatment regimen groups were mostly due to hospitalization costs. This is probably because many Japanese hematologists choose inpatient treatments over outpatient treatments in CHOP-based induction therapy.
Introduction
Follicular lymphoma (FL) is the most common type of indolent B-cell lymphoma and accounts for 10–20% of all non-Hodgkin lymphomas (NHLs)Citation1. The incidence of FL in Japan is only half of that in the United States, but it had increased by 14.4% to an annual percent change of 1.1 per 100,000 people per year by 2008Citation2 and is anticipated to continue increasing in prevalence. FL treatment has significantly improved with the arrival of the anti-CD20 antibodyCitation3 rituximab (R), which has extended overall survival (OS). In addition to R for induction therapy, R has also been widely used for maintenance therapy and was approved in Japan in 2015. However, some FL patients, especially those with advanced FL, experience relapse or disease progression after R treatment (e.g. 48.9% within ten yearsCitation4); these patients also tend to have multiple relapses with shorter intervals and worse prognosis than other FL patientsCitation5. Therefore, the unmet need still exists in particular for long-term disease control.
Obinutuzumab (GA101; G), a unique third-generation fully humanized type II anti-CD20 monoclonal antibody, has been used as a FL treatment since August 2018 in Japan. G binds to the CD20 protein, similar to R, but with different action mechanisms, such as high direct cell death induction and high antibody-dependent cellular cytotoxicity, and is anticipated to demonstrate high efficacy for FL patientsCitation6. The GALLIUM trial, which was a randomized, open-label, phase III trial for patients with untreated advanced indolent NHL, demonstrated that G-plus-chemotherapy followed by monotherapy (G + Chemo) resulted in a significant improvement in progression-free survival (PFS) than R-plus-chemotherapy followed by monotherapy (R + Chemo)Citation7 and a comparable quality of lifeCitation8. This result suggested that G allows FL patients to maintain a stable condition.
The cost-effectiveness of G was evaluated in Western countries. The National Institute for Health and Care Excellence (NICE) recommended the use of G for both untreated and advanced FL patients under the patient access schemeCitation9–11. G was also assessed in a US setting and found that treatment with G + Chemo against R + Chemo was more cost-effective in patients with previously untreated FLCitation12. These results suggest that there is a substantial difference among countries. In Japan, the public interest in the cost-effectiveness of G is increasing, because the implementation of the Japanese health technology assessment raised the awareness of both physicians and patients to cost-saving treatment options.
Although healthcare services for FL treatment as well as their costs vary among countries, there are no reports on the utilization or cost of healthcare services for FL patients in Japan. Therefore, we aimed to evaluate the cost-effectiveness of G + Chemo compared to that of R + Chemo, and examine the difference among combined chemotherapies (CHOP, CVP, and bendamustine [B]), for FL patients that have not undergone any treatment yet, mainly using Japanese data as much as possible for reflecting current healthcare services in Japan.
Methods
Our analysis was conducted by localizing the cost-effectiveness model developed by Guzauskas et al.Citation12 using Japanese cost data. The same outcome values were used as in the previous study, because there are limited domestic Japanese data for clinical parameters such as QOL, OS, PFS, and adverse event (AE) rates in FL. The public healthcare payer’s perspective in Japan (i.e. including only direct costs) were used.
Cost-effectiveness evaluation
Cost-effectiveness of G-CHOP, G-CVP, and G-bendamustine (G-B) was compared to R-CHOP, R-CVP, and R-B. For the analysis, we used a Microsoft Excel file with macros from a previously reported lifetime horizon modelCitation12, which was provided to us by the authors of that report, and adapted it to the Japanese situation.
Model structure
The three-state partitioned survival model, which included PFS status, progressive disease (PD) status, and death, focused on direct medical care costs. Patients in the PFS status could either be in treatment or finished with treatment. Those in the PD status were in second-line treatments.
All patients started in the PFS status. From there, they either received the study drugs or not (on/off treatment). If patients discontinued treatment prior to progression, they were not assigned a cost for active treatment but were assigned the same PFS utility and other incurred routine costs of care. If patients progressed within the first two years, they transitioned to the health state “early relapse (Y 0–1)” and remained there until death. Those patients who progressed in the subsequent years moved into “late relapse” and remained there until death. Patients who progressed within two years had significantly worse survival outcomes than those who progressed laterCitation13,Citation14. Utilities and supportive care costs also differed according to time of progression.
Model parameters
The probability of patients remaining in the PFS status was modeled in the previous study as a PFS curve derived from Kaplan–Meier’s PFS data from the GALLIUM trialCitation7 and 10-year treatment effect data from the PRIMA trialCitation15–17. In the previous study, the exponential function was used in the base-case to the PFS data in order to extrapolate it beyond the observation period, based on the results of fitting several parametric distributions: Exponential, Weibull, Log-logistic, Log-normal, generalized Gamma, and Gompertz. Therefore, we also used the exponential function in the base-case analyses. Based on the same assumption as the previous study, the PFS curve for G + chemo was derived by applying the hazard ratio (0.68) to the R + chemo PFS curve and used for 9 years, reflecting the results that the PFS treatment effect was maintained beyond 10 years, as shown in the PRIMA 10-year update studyCitation18. After 9 years, the probability of remaining in PFS for G + chemo was assumed to be equivalent to that for R + chemo.
The proportion of patients remaining in the PD status was modeled also in the previous study as the difference between PFS and OS curves, the latter of which was derived based on the dying probability for R + Chemo or G + Chemo, and a post-progression survival curve of pooled group of R + Chemo and G + ChemoCitation7,Citation12. The same time to off-treatment (i.e. the duration in which patients were considered to be on-treatment) and utility values were used as the previous studyCitation12.
We included four AEs (pneumonia, anemia, neutropenia, and thrombocytopenia) with incidence rates reported in the GALLIUM study. The cost for each event except pneumonia was calculated from all eligible patients identified from Japanese hospital-based claims data, as described below. The cost for pneumonia was not included, because the treatment for pneumonia as an AE is difficult to distinguish from the treatment for other infectious diseases involving pneumonia using the hospital-based claims database in Japan. All utility values were the same as the previous study, and the same in G + Chemo and R + ChemoCitation8. AE-related disutilities were not included in the base-case. Owing to lack of evidence of specific AE disutilities in the first line FL population, disutilities were taken from the NICE appraisal of pixantrone in relapsed or refractory aggressive B-cell NHL. In the sensitivity analysis, disutilities for treatment related grade 3/4 AEs were experienced in ≥2% of study subjects. The time horizon was a lifetime. While the previous study considered a lifetime to be 50 years, we used 40 years based on the older starting age in our study. The model parameters are shown in .
Table 1. Model parameters.
We adapted the model to incorporate the Japanese medical environment. The following changes were made: a 2% discount rate for all future outcomes and costsCitation19; cost-effectiveness threshold value of 7.5 million JPY (68,182 USD) per quality-adjusted life year (QALY) for malignant neoplasm technologies according to Japanese guidelinesCitation20; mean age of eligible patients from Japanese hospital-based claims data (63, 71, and 67 years, as described below for CHOP, CVP, and B, respectively); a life tableCitation21; proportion of menCitation22; height and weightCitation23 in the general Japanese population according to Japanese statistics; unit prices of R, G, and all chemotherapies based on the Japanese drug price list updated in April, 2018; administration (i.e. hospitalization, prescription for AE prevention); supportive care (consultation and examination) costs for each treatment phase derived from the MDV database and generalized linear mixed model (GLMM), except unit prices of R, G, and all chemotherapies; unit prices of each AE based on the above Japanese drug price list; and 0 as the proportion of patients receiving each second-line treatment to avoid double-counting, because the costs of these treatments were included in the administration costs of the relapse phase. The last point assumes that costs of all-line treatments within the relapse phase were not differentiated, but those in the early or later relapse phase were differentiated.
We calculated lifetime direct-medical costs and QALYs for G + Chemo and R + Chemo groups in an untreated FL patient population and then calculated the incremental cost-effectiveness ratio (ICER). We performed one-way and probabilistic sensitivity analyses for the same parameter estimates and statistical distributions as the previous study (). We also performed scenario analyses according to the previous study, including 12 parametric survival curves and two treatment periods, to evaluate the assumption of the PFS treatment effect duration. We additionally conducted two scenarios, including the substitution of R for biosimilar products and variation of age from 55 to 75 years by 5-year increments. In the probabilistic sensitivity analysis, all parameters were randomly varied over 5,000 simulations to calculate the 95% credible range (CR). The covariance matrix for varying lambda for PFS and PPS modeling was also provided by authors with the original model.
Cost estimation
For the local adaptation, we calculated all cost parameters using two sets of Japanese claims data: hospital-based claims and employees’ health insurance claims. The former are collected from hospitals and contain information from the greatest number of patients in Japan. They are appropriate for estimating representative direct medical costs, but not for following up treatment outside hospitals, so we could not use these data to sufficiently evaluate disease progression, treatment course, or differences in the cost of treatments. In contrast, employees’ health insurance claims data allow the long-term follow-up of treatment changes across hospitals. The model required costs of five treatment phases (induction, maintenance, follow-up, early relapse, and later relapse), so we used employees’ health insurance claims data to identify the utilization of different health resources among different treatment phases.
Data source
We used a Japanese hospital-based claims database developed by Medical Data Vision, Co., Ltd. (MDV; Tokyo, Japan). The MDV database comprises approximately 10.51 million patients from 192 hospitals in Japan that use the Diagnostic Related Group-liked fixed payment system in JapanCitation24,Citation25. These hospitals account for 11% of all acute-phase hospitals, contain from 20 to over 1,000 beds, and are widely distributed throughout Japan. The MDV database uses an anonymized patient identifier and stores the following patient information: gender, birth year, date of medical service, diagnosis codes, hospitalization, medical procedures, test orders, operations, and prescriptions.
The JMDC database, constructed by JMDC Inc., included approximately 7.5 million patients, accounting for about 5% of the Japanese population. The JMDC database is based on employees’ health insurance claims data and allows for longer follow-up periods than the MDV database, even after patients change hospitals.
We defined five treatment phases (): induction, maintenance, follow-up, early relapse, and later relapse; these were based on the combination of chemotherapies and prescription intervals throughout the entire period of observation of patients with FL identified from the JMDC database.
Table 2. Definitions of treatment phases.
Population
Patients that were at least 18-years-old of age and prescribed R within 90 days after FL diagnosis from 1 October 2012 to 31 December 2018 were identified from the MDV database. The FL diagnosis was defined by the 10th revision of the International Statistical Classification of Diseases as C82 or diagnosis names that included “follicular lymphoma.” Although G was launched during the above-mentioned period, we estimated costs only for R + Chemo because no patient using G in the MDV database; additionally, the model assumed different drug prices for R and G, but the values of other cost parameters between R + Chemo and G + Chemo were the same. Included patients were prescribed chemotherapy within seven days after the date of the initial R dose (index date) and classified into three treatment groups according to the combination of chemotherapies: R-CHOP, R-CVP, and R-B. The chemotherapies prescribed for R-CHOP were cyclophosphamide, doxorubicin, vincristine, and prednisone (CHOP). The chemotherapies prescribed for R-CVP were cyclophosphamide, vincristine, and prednisone (CVP). We excluded patients that did not have follow-up periods of 180 days and more. The R-B patients with an index date before 1 January 2017 were excluded because B launched for patients with previously untreated FL at the end of 2016. The observation period was from the index date to the observation period end date listed in the MDV database.
Definition of treatment phases
Eligible FL patients identified from the JMDC database met the same inclusion and exclusion criteria as described above: 59, 10, and 18 patients in R-CHOP, R-CVP, and R-B groups, respectively, were identified in the JMDC database. First, we listed all prescription dates for R and chemotherapies from the start of the induction therapy to the end of the observation period for all eligible patients in the JMDC database. We also listed the information for descriptive characteristics of each prescription that included combination use-patterns for R and chemotherapies within seven days of each prescription, days since the start of the induction therapy, days since the date of the previous R or chemotherapy treatments. Second, a clinical practitioner examined the list and determined thresholds of prescription use and combinations of drugs enable one treatment phase to be distinguished from the others, such as the possible range of intervals between treatment cycles in each treatment phase, the possible combination patterns of medications in each treatment phase, and the possible range of intervals before each treatment phase, based on treatment variations according to demographic, clinical and socio-economic background factors of patients in the clinical practice. Third, researchers used criteria based on the thresholds of their combinations to define the five treatment phases; the parameters were checked and adjusted to ensure identification of the treatment phases for all prescriptions. Forth, a clinical practitioner checked the clinical validity of the definitions for the five treatment phases (). Finally, we listed all prescription dates of R and chemotherapies from the index date to the observation-period-end date; we then identified treatment phases for all eligible patients identified from the MDV database, based on the definitions created from the JMDC datasets. Adapting the definitions to include the above-mentioned prescription dates and therapies list for identifying treatment phases, we calculated medical costs based on treatment groups and treatment phases.
Definition of costs
We defined cost items, which included items for estimating FL treatment-specific medical costs, using the MDV dataset. The medical services for FL treatments that we identified as cost items were: administration (hospitalization, prescription, saline or infusion solution, preventive medications), consultation, and examination (biochemical exams and imaging tests); these cost items were used for more than 50% of FL patients within six months after the index date, and those unrelated to FL treatments were excluded (meals, cafeteria utilization, out-of-hours services, etc.). Preventive medications associated with chemotherapies included antiemetics and proton pump inhibitors (PPIs) that had unit prices higher than those of other preventive medications, such as antihistamines, laxatives, and H2 blockers. Lastly, the clinical practitioner checked the clinical validity of the included cost items listed in Supplementary Table 1. Unit prices of the included cost items were determined for each year of use.
Estimating costs
Unit costs were multiplied by the amount and number of times prescribed and were then totaled per patient by treatment phase to determine the medical costs used for FL treatment. As demographic and clinical characteristics of patients were varied among the treatment regimen groups, we also examined factors affecting medical costs and acquired parameters for those factors by using a multivariate GLMM for eight cost groups: hospitalization, prescription, saline or infusion solution, antiemetics, PPIs, consultation, biochemical exams, and imaging tests. Fixed variables included sex, age, treatment regimen groups, treatment phases, treatment histories within 6 months before the index date, days from the index date to the start date of the treatment phases identified as described above, and days of outpatient visits during each treatment phase (only in models for costs of consultation, biochemical exams, or imaging tests). Treatment histories included hepatic disease treatments, moderate to severe renal disease treatments, and all-cause medication costs. All statistical analyses were conducted using R version 3.6.0 (R Foundation for Statistical Computing, Vienna, Austria). A “glmmML” package (version 1.1.0) was used for GLMM. All cost results are shown in both JPY and USD using the average exchange rate in 2018.
Results
Cost of treatment phases
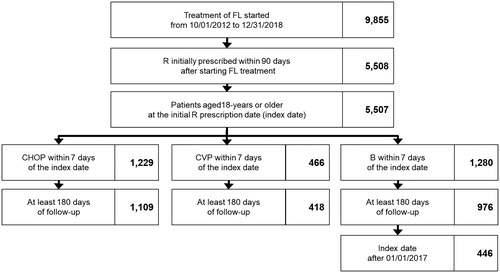
For adapting Japanese treatment costs as parameters in cost-effectiveness models, we estimated the costs of treatment phases. The numbers of eligible patients identified in the MDV database for this cost estimation were 1,109, 418, and 446 in the R-CHOP, R-CVP, and R-B groups, respectively (). Only patients with index dates after the launch of B were included in the R-B group. The median ages of these groups at the index date were 63, 71, and 67 years, respectively. Transition rate to the maintenance phase was approximately 25% in both the R-CHOP and R-CVP groups. Early relapse rate was higher in the R-CVP group (13.2%) than in the R-CHOP group (8.1%). Many patients in the R-B group had short follow-up periods, and their transition rates were not comparable to the other groups.
Figure 1. Selection flowchart for eligible patients. Abbreviations. FL, follicular lymphoma; R, rituximab; B, bendamustine.
The result of multivariate GLMMs showed that hospitalization costs, which accounted for the majority of the administration costs, varied depending on the treatment group, age at the index date, and treatment phase. Hospitalization costs were significantly higher in the R-CHOP group than the other groups, and in the first induction phase followed by the subsequent induction phase, the early relapse phase, and the later relapse phase (Supplementary Table 2). Imaging costs that accounted for most of the consultation/examination costs varied depending on the patient’s age at the index date, treatment phase, days of outpatient visits during each treatment phase, and all-cause medication costs within 6 months before the index date. Imaging costs were highest in the first induction phase and did not vary much between the treatment regimen groups (Supplementary Table 2).
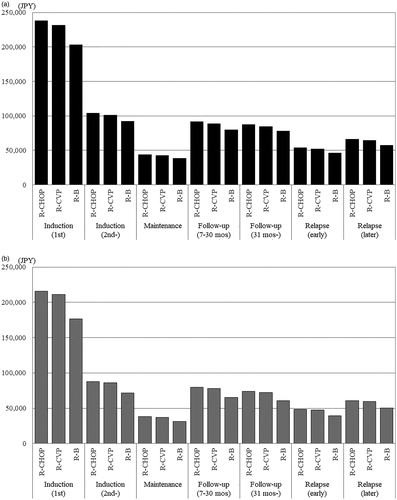
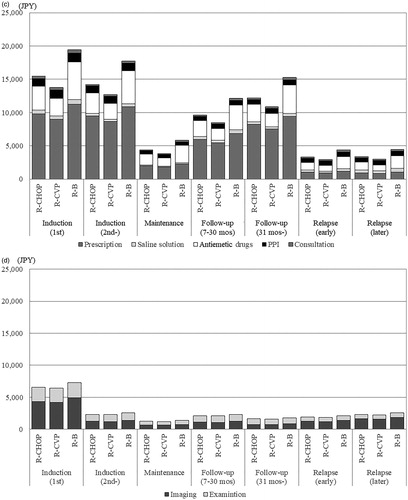
Using parameters and values derived from the multivariate GLMM, we estimated direct medical costs for a typical Japanese patient with FL using the following assumptions: male, 65 years old (median age of all eligible patients), no disease history before the index date, and no medical costs before the index date. Days from the index date to the start of treatment were assumed to be the same (median of all eligible patients). The results showed that total costs depended on hospitalization costs, and both total and hospitalization costs were lowest in the R-B group in every treatment phase (). Other administration and examination costs were highest in the R-B group, especially those for antiemetic drugs, but these costs were less than a tenth of the hospitalization costs and had little impact on the difference in total costs ().
Figure 2. Estimated costs according to treatment phases. (a) Total costs. Abbreviations. JPY, Japanese yen; R, rituximab; mos, months; B, bendamustine; PPI, proton pump inhibitor. (b) Administration costs: hospitalization. (c) Administration costs: other. (d) Examination costs.
Cost-effectiveness results
The results of the base-case analysis are shown in . Average total drug costs were higher in the G + Chemo groups (8.2, 7.3, and 9.0 million JPY, or 74,545, 66,364, and 81,818 USD, for CHOP, CVP, and B, respectively) than in the R + Chemo groups (3.4, 3.5, and 4.8 million JPY, or 30,909, 31,818, and 43,636 USD, for CHOP, CVP, and B, respectively). Administration costs including hospitalization, prescription, saline solution, antiemetic drugs, and PPI costs were slightly higher in G + Chemo groups (0.8, 0.9, and 1.1 million JPY, or 7,273, 8,182, and 9,091 USD, for CHOP, CVP, and B, respectively) than in the R + Chemo groups (0.7, 0.9, and 1.1 million JPY, or 6,364, 8,182, and 10,000 USD, for CHOP, CVP, and B, respectively). The total costs included average total drug costs, administration costs, AE costs, and supportive care costs including consultation, imaging and examination. The total costs for the G + Chemo groups were 9.3, 8.5, and 10.5 million JPY (84,545, 77,273, and 95,455 USD) for CHOP, CVP, and B, respectively; those for R + Chemo were 4.5, 4.7, and 6.3 million JPY (40,909, 42,727, and 57,273 USD).
Table 3. Results of cost-effectiveness analysis.
Total QALYs were 11.18 in the G + Chemo groups (95% CR: 10.28–12.09), 10.29 in the R + Chemo groups (95% CR: 9.26–11.26), and the same among the treatment regimen groups because the same utility values were used.
Total ICER, in million JPY per QALY, was 5.0 for G + Chemo vs. R + Chemo, reflecting patient numbers among chemotherapy regimens based on the MDV database (1,109, 418, and 446 patients in the R-CHOP, R-CVP, and R-B groups, respectively). For each chemotherapy group, ICERs, in million JPY per QALY, were 5.4 (95% CR: 3.2–16.2) for G + CHOP vs. R + CHOP, 4.3 (95% CR: 2.6–12.5) for G + CVP vs. R + CVP, and 4.8 (95% CR: 2.9–13.4) for G + B vs. R + B; in USD, they were 49,091(95% CR: 29,091 to –147,273), 39,091 (95% CR: 23,636 to –113,636), and 43,636 (95% CR: 26,364–121,818), respectively. One-way sensitivity analysis showed that the results were most sensitive to the time horizon, meaning that ICER exceeded 7.5 million JPY (68,182 USD) per QALY for 15 years or less (Supplementary Table 3). For G + CVP vs. R + CVP, ICERs were under the 7.5 million JPY (68,182 USD) per QALY threshold in every scenario (Supplementary Table 3).
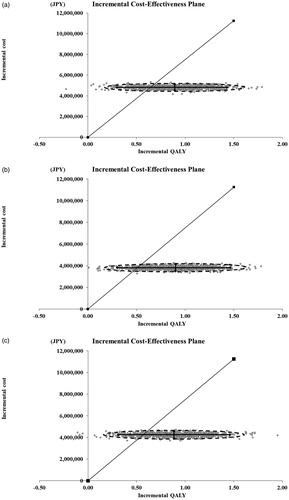
Probabilistic sensitivity analysis revealed that G + Chemo is a more cost-effective treatment option than R + Chemo, and the probabilities that ICERs were lower than the 7.5 million JPY (68,182 USD) per QALY threshold were 81.3%, 90.4%, and 85.1%, for G + CHOP vs. R + CHOP, G + CVP vs. R + CVP, and G + B vs. R + B, respectively ().
Figure 3. Incremental cost-effectiveness plane. Each point shows ICER of G + Chemo vs. R + Chemo, the solid line shows the willingness to pay (7.5 million JPY), and the broken line shows 95% credible range. (a) G-CHOP vs. R-CHOP. (b) G-CVP vs. R-CVP. (c) G-B vs. R-B.
Discussion
Cost of treatment phases
The medical costs for Japanese patients with previously untreated FL were estimated to be lowest in the R-B group and highest in the R-CHOP group, assuming the same clinical characteristics among treatment regimen groups. Differences in cost among treatment regimen groups were mostly due to hospitalization costs, which accounted for most of the direct medical costs. In Japan, physicians who prefer disease management involving hospitalization contributed to high total medical costs. High total medication costs in the first induction phase were attributed to much higher hospitalization costs than other disease phases, as well as higher imaging and biochemical exam costs. Relapse also caused high medical costs. There were notable differences in antiemetics costs among the treatment regimen groups, which were almost twice as high in the R-B group than in the R-CVP group. This might have been caused by the recent launch of expensive long-acting antiemetic drugs and the likelihood of selecting these for patients undergoing treatment with R-B. It is challenging to prescribe short-acting antiemetics for continuous daily use by patients receiving R-B because they are mostly treated on an outpatient basis, while most patients receiving R-CHOP are treated on an inpatient basis. Patients prescribed B within 2 years of its launch were included in our study, and the number of patients exceeded those receiving R-CVP, which indicated the rapid dissemination of B in Japanese clinical practices. In our study, the mean age of patients in the R-B group was lower than that in the R-CHOP group. If the increasing popularity of B continues for R-B prescriptions for younger patients, then total medical costs for patients with previously untreated FL could decrease.
Cost-effectiveness evaluation
The results of the cost-effectiveness analysis of G + Chemo compared to R + Chemo in Japanese patients with previously untreated FL showed that ICERs were lower than the Japanese threshold for all treatment regimens. The analysis identified G + Chemo as cost-effective, according to the Japanese cost-effectiveness threshold of 7.5 million JPY (68,182 USD) per QALY for technologies for malignant neoplasms. The total cost for G + Chemo was higher than that for R + Chemo. The higher unit price of both R and G in Japan than in the U.S. causes the large difference of total costs among them. However, the ICERs were 4.2–5.4 million JPY (38,182–49,091 USD) per QALY below the threshold, which suggests that the incremental effectiveness for G + Chemo compared to that of R + Chemo overcomes the large difference in total drug costs between G + Chemo and R + Chemo. ICER was lowest in G-CVP vs. R-CVP, followed by G-B vs. R-B, which indicates that G treatment regimens are the better treatment option for achieving cost-effectiveness. Assuming the substitution of all R for biosimilar products, ICERs also remained below the threshold. Cost-effectiveness was worse for all treatment regimens when time horizon values were assumed as markedly shorter than the base-case value; this suggests that the cost-effectiveness of G would not be significant for patient populations with short follow-up periods; however, a time horizon of 40-years is an appropriate assumption according to the previous studyCitation26.
QALYs were 11.18 for G + Chemo and 10.29 for R + Chemo, and higher than in the previous study (9.76 for G + Chemo and 8.95 for R + Chemo), although the starting ages of subjects were 63–71 years of age, older than in the previous study (57.9 years). This is because we used a Japanese life table that reflects the long-life expectancy in Japan and so extends the simulated lifetime of populations. However, incremental QALYs were similar between two studies (0.89 and 0.81) and unaffected by the baseline mortality difference.
Probabilistic sensitivity analysis determined that the wide CR of QALYs increased the uncertainty of the cost-effectiveness results. Collecting utility values of a sufficient number of Japanese patients with previously untreated FL is expected to decrease errors of QALY estimates and allow for more accurate and Japanese-specific cost-effectiveness analysis, and improve the applicability to real Japanese clinical practice.
G has an advantage over R in delaying first relapsesCitation8, which is considered to result in improving OS and decreasing the frequency of retreatment during lifetime. R has substantially improved the OS and shows efficacy of retreatment as well, but the interval is shown to be shorter with each relapse. In the present study, we considered only the first relapse as the factor increasing total costs and, conservatively, did not include long-term benefits due to delayed first relapses for delaying the second and subsequent relapses. If long-term follow-up studies show long-term delaying effects, models including those assumptions are anticipated to show better cost-effectiveness of G.
Limitations
Since the patients in the R-B treatment regimen group had short follow-up periods, a limited number of patients transitioned to maintenance, follow-up, and relapse phases; therefore, it was difficult to determine the cost estimations accurately. When considering the cost differences among treatment phases in the R-B treatment regimen group, an additional two to three years of data is required. In addition, after we accumulate more years of data, the current results should be reexamined for any bias. Interestingly, Japanese physicians who prefer in-hospital treatment regimens increased hospitalization costs in the induction phase when compared to those in Western countries who prefer out-patient treatments. We concluded that if hospitalization costs in Japan were similar to those in Western countries, then lower medical costs in the induction phase would decrease ICERs, thereby improving overall cost-effectiveness. Our model assumed that almost all patients (except those who transitioned to the follow-up phase) transitioned to the maintenance phase of G or R monotherapy as the ideal transition according to the FL treatment guideline; however, only 25% of eligible patients from the MDV dataset transitioned to the maintenance phase. A limitation of the MDV database is that it is does not allow follow-up of each patient for a long period. Even if the low transition rate reflects the real clinical setting, it causes lower total costs but higher relapse rates than the base-case and then it is difficult to consider the impact on results. However, we assumed relapse rates were same among G and R, which presumably results in the low impact on ICERs. Costs in the relapse phase did not differ between G and R. The sequence of therapy in the relapse phase is likely to vary according to the first-line treatment, but we assumed it is the same between G and R because we estimated costs based only on R + Chemo and the sequence of therapy is unknown in patients with G, as it was only launched recently. Estimated costs in the relapse phase were partly reflected in the sequence, but underestimated in subsequent lines of treatment due to limited follow-up durations. For estimating costs, we excluded patients who were followed up for fewer than 180 days, but the median PFS in FL was reported as 5 years. Most disease costs of later relapses are unlikely to be included in this study, but they are less expensive than those of early relapses. Additionally, we did not include costs due to death/treatment related mortality, because the model provided by authors of the previous study does not consider them. MDV database does not allow to distinguish the follow-up termination between due to death and changing hospital. If assuming the same costs due to death/treatment within 180 days between G + Chemo and R + Chemo, we consider that it has a limited impact on our results. Finally, we localized costs but not utilities, due to the difficulty of currently considering accurate utility weights in Japan. As utilities are considered varied among countries even if among patients with same disease stages, adapting Japanese utility values is likely to provide cost-effectiveness results reflecting a true acceptability for G in Japan.
Conclusions
Direct medical costs for FL treatments in the Japanese clinical setting were estimated to be highest in R-CHOP among the R + Chemo treatment regimen groups. The existing cost-effectiveness model was adapted by using estimated medical costs for the R + Chemo treatment regimen groups. Ultimately, we determined that the cost-effectiveness of G + Chemo treatment was sufficiently acceptable for all regimen groups when compared to R + Chemo treatment.
Transparency
Declaration of financial/other relationships
S.O. and N.O. are employees of Chugai Pharmaceutical Co., Ltd, Tokyo, Japan. A.S. is an employee of Medilead, Inc., Tokyo, Japan. K.H. has received honoraria from Chugai Pharmaceutical Co., Ltd, Tokyo, Japan. A.I. received research grants from Pfizer Japan Inc., CSL Behring Japan Inc., Gilead Science K.K., and Fuji Film K.K.; consulting fees from Novartis Pharma K.K., AbbVie GK, Milliman Inc., Sony Inc., and Eli Lilly Japan K.K.; and is a member of the speakers bureaus for Chugai Pharmaceutical Co. Ltd., CRECON Research and Consulting Inc., Terumo Corporation, Bristol-Myers Squibb K.K., and Creativ-Ceutical K.K.
JME peer reviewers on this manuscript have received an honorarium from JME for their review work, but have no other relevant financial relationships to disclose.
Acknowledgements
None reported.
Supplementary_Table_3_rev_clean.docx
Download MS Word (37.5 KB)Supplementary_Table_2_rev_clean.docx
Download MS Word (21.1 KB)Supplementary_Table_1.docx
Download MS Word (27.6 KB)Data availability statement
The data that support the findings of this study are available from the corresponding author, S.O., upon reasonable request.
References
- The World Health Organization Classification of malignant lymphomas in japan: incidence of recently recognized entities. Lymphoma study group of Japanese pathologists. Pathol Int. 2000;50(9):696–702.
- Chihara D, Ito H, Matsuda T, et al. Differences in incidence and trends of haematological malignancies in Japan and the United States. Br J Haematol. 2014;164(4):536–545.
- Conconi A, Lobetti-Bodoni C, Montoto S, et al. Life expectancy of young adults with follicular lymphoma. Ann Oncol. 2015;26(11):2317–2322.
- Bachy E, Seymour JF, Feugier P, et al. Sustained progression-free survival benefit of rituximab maintenance in patients with follicular lymphoma: long-term results of the PRIMA study. J Clin Oncol. 2019;37(31):2815–2824.
- Johnson PW, Rohatiner AZ, Whelan JS, et al. Patterns of survival in patients with recurrent follicular lymphoma: a 20-year study from a single center. J Clin Oncol. 1995;13(1):140–147.
- Said R, Tsimberidou AM. Obinutuzumab for the treatment of chronic lymphocytic leukemia and other B-cell lymphoproliferative disorders. Expert Opin Biol Ther. 2017;17(11):1463–1470.
- Marcus R, Davies A, Ando K, et al. Obinutuzumab for the first-line treatment of follicular lymphoma. N Engl J Med. 2017;377(14):1331–1344.
- Davies A, Trask P, Demeter J, et al. Health-related quality of life in the phase III GALLIUM study of obinutuzumab- or rituximab-based chemotherapy in patients with previously untreated advanced follicular lymphoma. Ann Hematol. 2020.
- Thielen FW, Buyukkaramikli NC, Riemsma R, et al. Obinutuzumab in combination with chemotherapy for the first-line treatment of patients with advanced follicular lymphoma: an evidence review group evaluation of the NICE Single Technology Appraisal. Pharmacoeconomics. 2019;37(8):975–984.
- National Institute for Health and Care Excellence. Obinutuzumab for untreated advanced follicular lymphoma [Internet]. London: NICE; 2018; [cited 2020 Mar]. Available from: https://www.nice.org.uk/guidance/ta513
- National Institute for Health and Care Excellence. Obinutuzumab in combination with chlorambucil for untreated chronic lymphocytic leukaemia [Internet]. London: NICE; 2015; [cited 2020 Mar]. Available from: https://www.nice.org.uk/guidance/ta343
- Guzauskas GF, Masaquel A, Thuresson PO, et al. Obinutuzumab plus chemotherapy followed by obinutuzumab monotherapy is cost-effective vs. rituximab plus chemotherapy followed by rituximab monotherapy for previously untreated follicular lymphoma patients in the United States. Leuk Lymphoma. 2019;60(7):1668–1676.
- Casulo C, Byrtek M, Dawson KL, et al. Early relapse of follicular lymphoma after rituximab plus cyclophosphamide, doxorubicin, vincristine, and prednisone defines patients at high risk for death: an analysis from the National LymphoCare Study. J Clin Oncol. 2015;33(23):2516–2522.
- Maurer MJ, Bachy E, Ghesquières H, et al. Early event status informs subsequent outcome in newly diagnosed follicular lymphoma. Am J Hematol. 2016;91(11):1096–1101.
- Salles G, Seymour JF, Offner F, et al. Rituximab maintenance for 2 years in patients with high tumour burden follicular lymphoma responding to rituximab plus chemotherapy (PRIMA): a phase 3, randomised controlled trial. Lancet. 2011;377(9759):42–51.
- Salles GA, Seymour JF, Feugier P, et al. Long term follow-up of the PRIMA study: half of patients receiving rituximab maintenance remain progression free at 10 years. Blood. 2017;130:486.
- Salles GA, Seymour JF, Feugier P, et al. Updated 6 year follow-up of the PRIMA study confirms the benefit of 2-year rituximab maintenance in follicular lymphoma patients responding to frontline immunochemotherapy. Blood. 2013;122(21):509.
- Salles GA, Seymour JF, Feugier P, et al. Long term follow-up of the PRIMA study: half of patients receiving rituximab maintenance remain progression free at 10 years. Am Soc Hematol. 2017;130(Suppl. 1):486.
- Center for Outcomes Research and Economic Evaluation for Health, National Institute of Public Health (C2H). Guideline for preparing cost-effectiveness evaluation to the Central Social Insurance Medical Council, Version 2.0 [Internet]; 2019; [cited 2019 Sep 5]. Available from: https://c2h.niph.go.jp/en/tools/guideline/index.html
- Center for Outcomes Research and Economic Evaluation for Health, National Institute of Public Health (C2H). Full scale introduction of cost-effectiveness evaluations in Japan: overview (2/20/2019) [Internet]; 2019; [cited 2019 Sep 5]. Available from: https://c2h.niph.go.jp/tools/system/overview_en.pdf
- Director-General for Statistics and Information Policy, Ministry of Health, Labour and Welfare. The 22nd life tables [Internet]; 2015; [cited 2019 Sep 5]. Available from: https://www.mhlw.go.jp/english/database/db-hw/lifetb22nd/dl/tables.pdf
- Population as of 1st of January in 2015 [Internet]; 2015; [cited 2019 Sep 5]. Available from: https://www.stat.go.jp/data/jinsui/pdf/201501.pdf
- Averages of height and weight per sex and age. Tokyo, Japan: Statistics Bureau, Ministry of Internal Affairs and Communications; 2018.
- Nakamura M. Utilization of MDV data and data quality control. Japan J Pharmacoepidemiol. 2016;21(1):23–25.
- Hashikata H, Harada KH, Kagimura T, et al. Usefulness of a large automated health records database in pharmacoepidemiology. Environ Health Prev Med. 2011;16(5):313–319.
- Tan D, Horning SJ, Hoppe RT, et al. Improvements in observed and relative survival in follicular grade 1–2 lymphoma during 4 decades: the Stanford University Experience. Blood. 2013;122(6):981–987.
- Wild D, Walker M, Pettengel R, et al. PCN62 utility elicitation in patients with follicular lymphoma. Value Health. 2006;9(6):A294.
- Nafees B, Stafford M, Gavriel S, et al. Health state utilities for non small cell lung cancer. Health Qual Life Outcomes. 2008;6(1):84.
- Tolley K, Goad C, Yi Y, et al. Utility elicitation study in the UK general public for late-stage chronic lymphocytic leukaemia. Eur J Health Econ. 2013;14(5):749–759.
- Swinburn P, Lloyd A, Nathan P, et al. Elicitation of health state utilities in metastatic renal cell carcinoma. Curr Med Res Opin. 2010;26(5):1091–1096.
- Beusterien KM, Davies J, Leach M, et al. Population preference values for treatment outcomes in chronic lymphocytic leukaemia: a cross-sectional utility study. Health Qual Life Outcomes. 2010;8:50.