
Abstract
Aims
Healthcare resource utilization (HRU) and costs in post-transplant lymphoproliferative disease (PTLD) patients following allogeneic hematopoietic stem cell transplant (HCT) were evaluated in the USA.
Methods
MarketScan Commercial and Medicare Supplemental database claims from 01 July 2010 to 31 December 2017 were analyzed. Patients eligible for analysis received allogeneic HCT between 01 January 2011 to 31 December 2015, had ≥6 months of continuous enrollment before HCT, and had ≥1 claim for PTLD or ≥1 inpatient or ≥2 outpatient claims for a clinically-relevant lymphoma within 1 year following HCT (PTLD index = first claim of diagnosis). Patients with clinically-relevant lymphomas within 6 months before HCT were excluded. HRU and total paid amounts were assessed from the week before the HCT through 1-day pre-PTLD index (HCT to PTLD) and monthly from PTLD index through 1-year post-PTLD index. HRU is reported as mean (SD). Results were also provided by survival status.
Results
Overall, 92 patients were eligible for analysis. From HCT to PTLD, 98.9% of patients were hospitalized, with 1.7 (1.2) hospitalizations/patient. The average length of stay was 25.3 (22.2) days/patient. From HCT to PTLD, 98.9% of patients had outpatient services with 233.7 (261.1) services/patient and 91.3% of patients had a prescription fill with 32.9 (26.0) prescriptions/patient. In the first month post-PTLD index, 51.2% of patients were hospitalized. Mean paid amounts were $399,470/patient (range $7542–$1.7 M) from HCT to PTLD. Cumulative mean paid amounts 1-year post-PTLD were $429,043/patient. Total cost/patient/month was ∼7 times higher in patients who died (n = 49; $232,591) than those who lived (n = 43; $33,677). Costs were mainly driven by hospitalizations.
Limitations
Limitations include those inherent to retrospective analyses (i.e. miscoding, lack of clinical detail).
Conclusions
HRU and costs from HCT to PTLD were high and more than doubled within 1-year post-PTLD. PTLD patients who died had ∼7 times higher costs than those who lived, driven by hospitalizations. Effective treatments are needed to reduce the burden of PTLD.
JEL CLASSIFICATION CODE:
Introduction
Post-transplant lymphoproliferative disease (PTLD) is a lymphoma following allogeneic hematopoietic stem cell transplant (HCT) or solid organ transplant. Patients undergoing HCT are treated with immunosuppressive regimens and are highly susceptible to infection. Nearly all PTLD cases following HCT are the direct result of B-cell proliferation driven by unchecked Epstein-Barr virus (EBV) reactivation or primary infectionCitation1–3. Approximately 90% of people are infected with EBVCitation4, but EBV negative patients, such as children without an EBV infection, who receive stem cells from an EBV positive donor are significantly more likely to develop PTLDCitation5. Most PTLD cases occur within 2–4 months of the HCT, during the immunosuppressed period prior to immune reconstitutionCitation5–7.
PTLD following HCT tends to affect patients who are relatively young compared with lymphoma diagnosis in the general populationCitation8. The mortality of PTLD following HCT has dropped from 85% to approximately 20–30% with the introduction of rituximab-based treatmentsCitation5–7. However, PTLD remains an aggressive disease for patients who do not respond to rituximab. A retrospective study of patients with PTLD following HCT demonstrated that 78% of patients refractory to rituximab died at a median of 33 daysCitation9. Furthermore, in two studies, ∼80% of patients treated with rituximab died a median of 16 and 56 days after PTLD diagnosisCitation5,Citation10. Aggregated data from a review of 9 studies found that in rituximab non-responders, the mean time from HCT to PTLD was 138 days in children and 132 days in adultsCitation11. The average time from PTLD diagnosis following HCT to death for rituximab non-responders was 10 weeks in children and about 7 weeks in adultsCitation11.
The healthcare burden of HCT is substantial, with an average hospitalization stay of 34 days following the transplant and overall billed charges of $892,700 per transplantCitation12. PTLD presumably incurs additional healthcare and economic burden, although the combined burden of HCT and PTLD has yet to be described. The objective of this study was to evaluate the healthcare research utilization (HRU) and costs (total paid amounts) in patients who develop PTLD following allogeneic HCT using a large US administrative claims database.
Methods
Study design and data source
This was a retrospective cohort study using claims from the United States MarketScan Commercial Claims and Encounters and Medicare Supplemental and Coordination of Benefits databases. The MarketScan Commercial database contains data from approximately 137.6 million employees and their dependents, and the Medicare Supplemental database contains data from ∼10.2 million retirees. The study period spans from 1 July 2010 to 31 December 2017.
Patient selection
HCT was identified by International Classification of Diseases 9th or 10th Revision, Clinical Modification (ICD-9-CM or ICD-10-CM) diagnosis codes (see Supplemental Table S1). Patients eligible for analysis received an allogeneic HCT between 1 January 2011 and 31 December 2015. The earliest date of HCT was used as the HCT date. Patients selected for the analysis had at least 6 months of continuous enrollment before the HCT. Patients that had a diagnosis code for an autologous stem cell transplant within 2 days of the HCT were excluded. Using the same methods as a previously published retrospective claims analysisCitation13, patients with PLTD were identified by ICD-9-CM or ICD-10-CM diagnosis codes 238.77 or D47Z1 in any position on a non-diagnostic claim or an ICD-9-CM or ICD-10-CM diagnosis code indicating a clinically-relevant lymphoma (see Supplemental Table S1) in any position on at least 1 inpatient non-diagnostic claim or at least 2 outpatient non-diagnostic claims on different days. The earliest date of PTLD or lymphoma diagnosis on or after the HCT date was the PTLD index date. Patients were included in the analysis if the PTLD index was within the first year following HCT. The HCT date was restricted to 31 December 2015 to allow patients to have 1 year for PTLD index and potentially 1 year for follow-up post-PTLD index, which was variable in length to the earlier of disenrollment in the database, end of the study period (31 December 2017), or patient death. Patients with a clinically-relevant lymphoma diagnosis in the 6 months before HCT were excluded to limit the possibility of selecting patients with relapsed lymphoma. The MarketScan Commercial database is a closed claims system, therefore minimizing misclassification of patients and increasing the specificity of the patient population examined in the analysis.
Outcomes
All-cause HRU claims and total paid amounts were assessed from the week before the HCT date through 1-day prior to the PTLD index (HCT to PTLD) and from the PTLD index date monthly through the 1-year post-PTLD index (Supplemental Figure S1).
Demographics (e.g. index year, age, sex, geographic region, insurance plan type) were summarized for the PTLD index date. Comorbidity data were used to calculate the Deyo Charlson Comorbidity Index [CCI] score and determine the percentage of patients with clinically relevant comorbidities (e.g. multiple myeloma, acute myeloid leukemia, acute lymphocytic leukemia, myelodysplastic syndrome, and myeloproliferative neoplasms) in the 6 months prior to the HCT date.
All-cause HRU and total paid amounts for inpatient, outpatient (including emergency room [ER] visits, office visits, and other services), and pharmacy services were analyzed. A patient could have had multiple service claims in the same visit. HRU analysis included the percentage of patients and the number of services per patient. Outcomes were also stratified by survival status. Death of a patient was assumed based on the below criteria during the follow-up period:
Inpatient death
Death reported to the Social Security Administration
Death by a previously published death proxyCitation14,Citation15, which required all the following criteria to be met:
No outpatient prescription drug claims >30 days after the “event date”;
No medical claims >30 days following the “event date”; and
Enrollment end date ≤90 days following the “event date”
Death date for the death proxy was considered the end of enrollment. All other patients were considered to be alive. Costs per patient per month were calculated to account for the differences in follow-up time by survival status. Total paid amounts included the payment from the insurer or health plan and from the patient. All dollar estimates were inflated to 2017 US dollars using the Medical Care Component of the Consumer Price Index.
Statistical analysis
Descriptive statistics were conducted for all study outcomes. Categorical variables are presented as number and percentage of patients and continuous variables are presented as mean and standard deviation (SD).
Results
Patient population
Based on study eligibility criteria, 92 patients were included in the analysis (). The mean age (SD) of the patients at PTLD index was 47.1 (17.5) years (). The percentage of patients less than 18 years of age was 8.7%, whereas the majority (60.9%) of the patients were between 45 and 64 years of age. At the PTLD index, 56.5% of patients were male, and the majority (60.9%) were on a Point of Service insurance plan (). In the 6-month period before the HCT date, the mean (SD) Deyo-CCI score was 2.6 (1.7; ). The percentage of patients with graft versus host disease increased from 3.3% during the 6 months before HCT date to 30.4% during the 6 months prior to the PTLD index. The mean (SD) time from HCT to PTLD was 118.2 (92.8) days.
Figure 1. Patient selection. Abbreviations. HCT, hematopoietic stem cell transplant; PTLD, post-transplant lymphoproliferative disease.
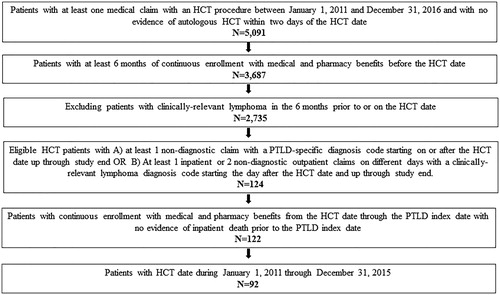
Table 1. Demographics measured on the PTLD index date.
Table 2. Comorbidities.
Based on the reported deaths and death proxy, 49 patients died after PTLD while 43 patients were considered alive. Mean age (SD) at PTLD index in patients who died after PTLD was 49.2 (17.7) years and 44.8 (17.1) years for those who did not die (). In the 6-month period before the HCT date, patients who died had a mean (SD) Deyo-CCI score of 2.9 (1.8) while patients who did not die had a Deyo-CCI score of 2.2 (1.6) ().
Healthcare resource use
During the period from HCT to PTLD, 98.9% of patients were hospitalized, with a mean (SD) of 1.7 (1.2) hospitalizations/patient (). The mean (SD) length of stay during hospitalization was 25.3 (22.2) days/patient. From HCT to PTLD, an overall 98.9% of patients had outpatient services with a mean (SD) of 233.7 (261.1) services/patient. ER and office visit claims were recorded for 18.5 and 63.0% of patients, respectively, with a mean (SD) of 2.2 (2.7) ER visits/patient and 12.0 (13.2) office visits/patient (). A prescription fill was recorded for 91.3% of patients, with a mean (SD) of 32.9 (26.0) prescriptions/patient. ER visits were recorded for 26.5 and 9.3% of patients who died and patients who did not die, respectively, with a mean (SD) of 0.4 (0.4) and 0.3 (0.1) ER visits/patient, respectively ().
Table 3. Healthcare resource utilization from HCT to PTLD.
Within the first month post-PTLD index, more than half (51.2%) of all patients were hospitalized, with a mean length of stay of 15.5 days in that month (). The monthly mean number of hospitalizations remained steady over time and ranged from 1.4 to 1.0 over the 12-month period. All patients had an outpatient service within the first-month post-PTLD index (). ER visits, office visits, and prescription fill claims were recorded for 10.7%, 40.5%, and 85.7% of patients, respectively, in the first month post-PTLD index. In general, the monthly mean number of outpatient services decreased over time and ranged from 80.3 to 30.3 during the 12-month period (). The monthly mean number of prescriptions/patients ranged from 8.8 to 6.6 during the 12-month period. During the entire post-PTLD period, 89.8% of patients who died had a hospitalization compared with 65.1% who did not die.
Table 4. Healthcare resource utilization during each month over the 12-months following PTLD index.
Costs
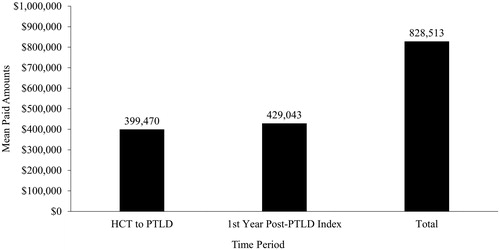
During the period from HCT to PTLD, total mean (SD) paid amounts were $399,470 ($308,215)/patient and ranged from $7,542 up to $1.7 M for some patients (). Mean (SD) inpatient, outpatient, and pharmacy paid amounts/patient were $329,268 ($283,316), $59,437 ($62,494), and $10,765 ($11,139), respectively. During the first year post-PTLD index, costs were primarily driven by a high number of hospitalizations and other HRU in the first month following PTLD index (). Mean cumulative inpatient, outpatient, and pharmacy paid amounts/patient were $230,808 $168,292 and $29,943 respectively, for an overall cumulative mean paid amount of $429,043/patient. Overall, from HCT through to 1-year post-PTLD index, the total mean paid amount was $828,513/patient (). Costs were mainly driven by hospitalizations, which were 82% of the cost from HCT to PTLD and 54% of the costs in the first year post-PTLD index.
Figure 2. Healthcare costs from HCT to PTLD. Abbreviations. HCT, hematopoietic stem cell transplant; PTLD, post-transplant lymphoproliferative disease. Plots indicate median, minimum, maximum, Q1, and Q3.
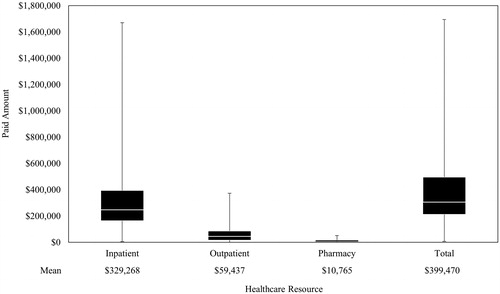
Figure 3. Mean healthcare costs in the 12-months following PTLD index. Abbreviations. PTLD, post-transplant lymphoproliferative disease.
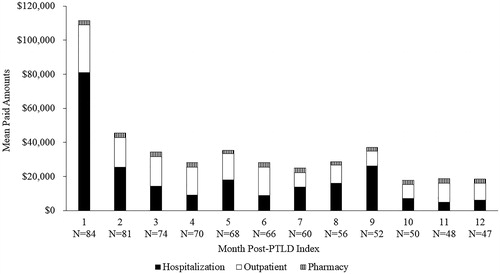
Figure 4. Total healthcare costs. Abbreviations. HCT, hematopoietic stem cell transplant; PTLD, post-transplant lymphoproliferative disease.
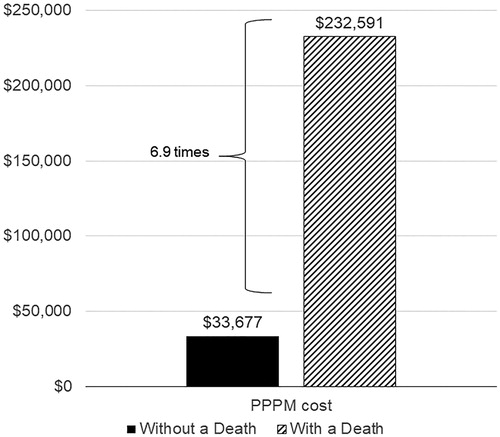
During the first year post-PTLD index, the cumulative mean paid amount was $232,591/patient/month who died and $33,677/patient/month who did not die, a 6.9-fold difference (). The difference in paid amounts was primarily driven by inpatient paid amounts, which were $213,387/patient/month who died and $18,984/patient/month who did not die, an 11.2-fold difference.
Figure 5. Total healthcare costs per month by survival status. Abbreviations. PPPM, per patient per month.
Discussion
This descriptive study shows that HRU in terms of hospitalizations, ER visits, office visits, outpatient services, and pharmacy services were high during the period between the week before HCT and the PTLD diagnosis. Total paid healthcare amounts during this period were substantial (mean [SD] = $399,470 [$308,215]) and reached up to $1.7 million in some patients. PTLD following HCT resulted in an additional burden of HRU and costs within a short amount of time after the PTLD index. Costs were highest within the first month post-PTLD compared with the rest of the first year post-PTLD. Over half of the patients were hospitalized within the first-month post-PTLD index and hospitalizations were responsible for the majority of costs in the first month and the first year. Total paid amounts in the first year post-PTLD index more than doubled the costs from HCT to PTLD to an overall total mean paid amount of $828,513/patient.
More than half of the patients in the PTLD cohort died. In the period between the week before HCT and the PTLD diagnosis, a substantially higher proportion of patients who died had an ER visit compared with those who did not die. In the period post-PTLD index, patients who died had approximately 7-fold higher costs compared with those who did not die, which was primarily driven by hospitalization costs.
The HRU and financial burden accrued by patients even before developing PTLD are considerable. Many patients receive HCT due to a malignancy. The cost of chemotherapy infusion in the US is approximately $50,000Citation16 and patients may require additional therapies and hospitalizations to manage or reduce the risk of chemotherapy-induced neutropenia or thrombocytopeniaCitation17,Citation18. At the HCT date in the current study, 44.6% of the patients had acute myeloid leukemia, mean costs for which during the induction period have been previously found to be $145,189 for commercially insured patients in the USCitation19. Patients then receive HCTs, which based on billed charges for 30-day pre-HCT through 180 days post-HCT hospitalization admission, has been estimated to be $892,700 in the United StatesCitation12. Finally, the patient is diagnosed with PTLD, further increasing HRU and costs as demonstrated in the current study. Less than half of PTLD patients in the current study survived and the hospitalization costs in these patients were high. Patients who respond to treatment will have longer survival times, potentially delaying or preventing additional hospitalizations. Thus, new and effective treatments are needed for PTLD to reduce the overall healthcare burden.
To our knowledge, this is the first study conducted to assess the HRU and the costs of PTLD following HCT. The total mean paid amount of $399,470 for the period from HCT to PTLD in the current study is comparable to the costs of HCT reported in two previous US retrospective database studiesCitation20,Citation21. The first study of claims from 2010 to 2013 found that the mean healthcare costs (based on fee-for-service equivalent or amount paid) of myeloablative HCT and nonmyeloablative/reduced-intensity HCT from 10-days pre-HCT to 1-year post-HCT were $549,208 and $432,157, respectivelyCitation21. The second study reported a total mean paid amount of $524,554 through a 1-year post-allogeneic HCTCitation20. The current study indicates that the overall costs double within the first year of the PTLD index, adding over $400,000 to the overall healthcare burden. The peak of these costs occurs within 1 month after the PTLD index.
The mean age of 47 years at the PTLD index in the current study was relatively low compared with the development of lymphoma in the general US population. For example, the median age for diagnosis of any lymphoma is 65 yearsCitation22. The age most impacted by PTLD corresponds with the general age of peak work income in the United StatesCitation23. Therefore, loss of work due to PTLD may further contribute to an individual’s financial burden. PTLD also affects children; 8.7% of patients in the current study were under the age of 18 and their caregivers may need to miss work to provide additional care.
In addition to a financial burden, PTLD may impose an emotional burden on patients and caregivers. Many of the patients with PTLD received HCT as a treatment for malignancy and have likely already faced fear, anxiety, and depression in response to their cancer diagnosis and treatmentCitation24. At the time of discharge, patients who receive HCT have a low perception of psychological and social well-beingCitation25. PTLD likely adds to that burden on the patient. There is little information on the specific psychological impact of PTLD following HCT, but lymphoma, in general, can cause patients to experience substantial psychological distress, such as depression and anxietyCitation26,Citation27.
Key strengths of the current study are the relatively large sample included in the database, the information of actual paid amounts, and the closed nature of the database. The exclusion of patients with clinically-relevant lymphomas within 6 months of the HCT, which limits the possibility of selecting patients with relapsed lymphoma, increases the specificity of the patient population examined in the analysis. However, it is possible that patients were included who had lymphoma more than 6 months before the HCT. Another limitation of the study is the potential for miscoding that is inherent in any retrospective analysis. To address the issue of potential miscoding, we used non-diagnostic claims and the requirement of at least 1 inpatient or 2 outpatient claims on different days for lymphoma to identify PTLD and eliminate the risk of selecting patients who had a single lymphoma code used only for screeningCitation13. Since this study uses the US commercial or Medicare supplemental databases, it is not generalizable to other patient populations, such as those who are uninsured or on Medicaid or outside the US healthcare system. Other limitations include lack of clinical details, such as the type of PTLD (e.g. monomorphic or polymorphic), which are factors that contribute to the aggressiveness of the disease. Finally, the mortality data is limited by the use of a death proxy for patients who could not be confirmed to be alive, potentially overestimating the number of deaths. Interpretations of the mortality data may also be limited by a slight difference in age and comorbidities between patients who died and did not die.
Conclusions
In this descriptive study, the already high cost of HCT was more than doubled within 1 year after the PTLD index. PTLD patients who died had ∼7 times higher costs than those who lived. HRU was high across all types of patient services with hospitalization driving the majority of the cost before and after PTLD. Effective treatments are needed to reduce the burden of PTLD.
Transparency
Declaration of funding
Funding for this study was provided by Atara Biotherapeutics, Inc. The study sponsor contributed to study design, data interpretation, and writing of the manuscript.
Declaration of financial/other interests
CW, HX, and AB are employees and stockholders of Atara Biotherapeutics, Inc. NP and IS are employees of IBM Watson Health, which provides contracting services to Atara Biotherapeutics, Inc.
JME peer reviewers on this manuscript have no relevant financial or other relationships to disclose.
Author contributions
CW, HX, and AB contributed to the study design. NP and IS contributed to data analysis. All authors contributed to the data interpretation and provided critical review of the manuscript, approved the manuscript for publication, and agree to be accountable for all aspects of the manuscript.
Figure E1 Study Period Revised
Download TIFF Image (80 KB)Supplemental Material
Download MS Word (13.4 KB)Acknowledgements
We would like to acknowledge Akshay Sudhindra, MD, for verifying the clinically-relevant lymphomas and Nicole Fulcher for input on study design and protocol development. Medical writing and editorial assistance were provided by Erin P. Scott, PhD, of Scott Medical Communications, LLC and Rachel Beckerman of Maple Health Group, LLC. This assistance was funded by Atara Biotherapeutics, Inc.
Data availability statement
Authors agree to make their data available upon reasonable request. It is up to the author to determine whether a request is reasonable.
References
- Cleary ML, Nalesnik MA, Shearer WT, et al. Clonal analysis of transplant-associated lymphoproliferations based on the structure of the genomic termini of the Epstein-Barr virus. Blood. 1988;72(1):349–352.
- Shapiro RS, McClain K, Frizzera G, et al. Epstein-Barr virus associated B cell lymphoproliferative disorders following bone marrow transplantation. Blood. 1988;71(5):1234–1243.
- Al-Mansour Z, Nelson BP, Evens AM. Post-transplant lymphoproliferative disease (PTLD): risk factors, diagnosis, and current treatment strategies. Curr Hematol Malig Rep. 2013;8(3):173–183.
- Epstein MA, Achong BG, Barr YM. Virus particles in cultured lymphoblasts from Burkitt’s lymphoma. Lancet. 1964;1(7335):702–703.
- Uhlin M, Wikell H, Sundin M, et al. Risk factors for Epstein-Barr virus-related post-transplant lymphoproliferative disease after allogeneic hematopoietic stem cell transplantation. Haematologica. 2014;99(2):346–352.
- Curtis RE, Travis LB, Rowlings PA, et al. Risk of lymphoproliferative disorders after bone marrow transplantation: a multi-institutional study. Blood 1999;94:2208–2216.
- Styczynski J, Gil L, Tridello G, et al. Response to rituximab-based therapy and risk factor analysis in Epstein Barr Virus-related lymphoproliferative disorder after hematopoietic stem cell transplant in children and adults: a study from the Infectious Diseases Working Party of the European Group for Blood and Marrow Transplantation. Clin Infect Dis. 2013;57(6):794–802.
- Alexander DD, Mink PJ, Adami HO, et al. The non-Hodgkin lymphomas: a review of the epidemiologic literature. Int J Cancer. 2007;120(12):1–39.
- Fox CP, Burns D, Parker AN, et al. EBV-associated post-transplant lymphoproliferative disorder following in vivo T-cell-depleted allogeneic transplantation: clinical features, viral load correlates and prognostic factors in the rituximab era. Bone Marrow Transplant. 2014;49(2):280–286.
- Ocheni S, Kroeger N, Zabelina T, et al. EBV reactivation and post transplant lymphoproliferative disorders following allogeneic SCT. Bone Marrow Transplant. 2008;42(3):181–186.
- Katz A, Barlev A, Joshi AJ. Burden of post-transplant lymphoproliferative disorder-mortality after allogeneic hematopoietic cell transplantation. Bone Marrow Transplantation 2018. Supplement: 44th Annual EBMT Meeting Abstracts, p. P218.
- Bentley T, Phillips S. 2017 U.S. organ and tissue transplant cost estimates and discussion. Seattle WA: Milliman Inc.; 2017 [cited 2020 Jul 13]. (Milliman Research Report). Available from: https://www.milliman.com/en/Insight/2017-US-organ-and-tissue-transplant-cost-estimates-and-discussion
- Kasiske BL, Kukla A, Thomas D, et al. Lymphoproliferative disorders after adult kidney transplant: epidemiology and comparison of registry report with claims-based diagnoses. Am J Kidney Dis. 2011;58(6):971–980.
- Paramore LC, Thomas SK, Knopf KB, et al. Estimating costs of care for patients with newly diagnosed metastatic colorectal cancer. Clin Colorectal Cancer. 2006;6(1):52–58.
- Song X, Zhao Z, Barber B, et al. Characterizing medical care by disease phase in metastatic colorectal cancer. J Oncol Pract. 2011;7(3):25s–30s.
- Hopson S, Casebeer A, Stemkowski S, et al. Does site-of-care for oncology infusion therapy influence treatment patterns, cost, and quality in the United States? J Med Econ. 2018;21(2):152–162.
- Weycker D, Hatfield M, Grossman A, et al. Risk and consequences of chemotherapy-induced thrombocytopenia in US clinical practice. BMC Cancer. 2019;19(1):151.
- Kawatkar AA, Farias AJ, Chao C, et al. Hospitalizations, outcomes, and management costs of febrile neutropenia in patients from a managed care population. Support Care Cancer. 2017;25(9):2787–2795.
- Stein EM, Bonifacio G, Latremouille-Viau D, et al. Treatment patterns, healthcare resource utilization, and costs in patients with acute myeloid leukemia in commercially insured and Medicare populations. J Med Econ. 2018;21(6):556–563.
- Bonafede M, Richhariya A, Cai Q, et al. Real-world economic burden of hematopoietic cell transplantation among a large US commercially insured population with hematologic malignancies. J Med Econ. 2017;20(12):1244–1251.
- Broder MS, Quock TP, Chang E, et al. The cost of hematopoietic stem-cell transplantation in the United States. Am Health Drug Benefits. 2017;10:366–374.
- Cancer Stat Facts: Non-Hodgkin Lymphoma [Internet]. Bethesda (MD): National Cancer Institute; 2019 [cited 2019 April 8]. Available from: https://seer.cancer.gov/statfacts/html/nhl.html
- National Research Council. Aging and the Macroeconomy. Long-term implications of an older population. Committee on the Long-Run Macroeconomic Effects of the Aging U.S. Population. Board on Mathematical Sciences and their Applications, Division on Engineering and Physical Sciences, and Committee on Population, Division of Behavioral and Social Sciences and Education, Washington, DC; 2012.
- Posluszny DM, Bovbjerg DH, Syrjala KL, et al. Correlates of anxiety and depression symptoms among patients and their family caregivers prior to allogeneic hematopoietic cell transplant for hematological malignancies. Support Care Cancer. 2019;27(2):591–600.
- Grant M, Cooke L, Williams AC, et al. Functional status and health-related quality of life among allogeneic transplant patients at hospital discharge: a comparison of sociodemographic, disease, and treatment characteristics. Support Care Cancer. 2012;20(11):2697–2704.
- Oerlemans S, Mols F, Nijziel MR, et al. The course of anxiety and depression for patients with Hodgkin’s lymphoma or diffuse large B cell lymphoma: a longitudinal study of the PROFILES registry. J Cancer Surviv. 2014;8(4):555–564.
- Carlson LE, Angen M, Cullum J, et al. High levels of untreated distress and fatigue in cancer patients. Br J Cancer. 2004;90(12):2297–2304.