
Abstract
Aims
To evaluate the cost-effectiveness of fingolimod versus interferon (IFN)-β1a at a dose of 30 μg per week for the treatment of relapsing pediatric-onset multiple sclerosis (POMS) in Canada.
Material and methods
A discrete-time Markov model was developed to compare fingolimod with IFN β-1a over a time horizon of two years representing patients followed up to mean age of 18 years from a Canadian health care system perspective. Twenty-one health states based on the Expanded Disability Status Scale (EDSS) were considered: EDSS 0‒9 for relapsing multiple sclerosis (MS), EDSS 0‒9 for secondary progressive MS, and “Death.” Relative treatment efficacy for fingolimod versus IFN-β1a was estimated from the PARADIGMS study. Costs and resource use were obtained from published literature and Canadian sources. Utilities were estimated by mapping the Pediatric Quality of Life inventory data onto the Child Health Utility Index-9 Dimension using a published mapping algorithm. Future costs and benefits were discounted at 1.5% per annum.
Results
Compared with IFN β-1a, fingolimod led to an increase in quality-adjusted life-years (QALYs) (0.125) with incremental costs (Canadian dollars [CAD] 2,977) and to an incremental cost-effectiveness ratio (ICER) of CAD 23,886/QALY over a time horizon of two years representing patients followed up to mean age of 18 years. The monetary benefits of fingolimod treatment versus IFN β-1a at a willingness-to-pay (WTP) threshold of CAD 50,000 per QALY gained were higher than the costs. One-way sensitivity analysis and probabilistic sensitivity analysis (PSA) both confirmed the robustness of the results.
Limitations
The main limitations of this analysis primarily stem from the limited data availability in POMS.
Conclusions
Fingolimod is cost effective compared with IFN β-1a for the treatment of POMS over a time horizon of two years representing patients followed up to a mean age of 18 years in Canada.
Introduction
Multiple sclerosis (MS) is a chronic, immune-mediated neurodegenerative disorder of the central nervous system (CNS), characterized by inflammation, demyelination, and axonal/neuronal destruction. Although MS mostly presents in young adults, it can also present in childhood and adolescence. The estimated prevalence of pediatric-onset multiple sclerosis (POMS) is low, ranging from 0.07 to 2.9 per 100,000 of the population under 18 years of ageCitation1–4. The incidence of POMS in Canadians under 18 years of age is estimated to be 0.9 per 100,000Citation5.
In more than 98% of patients, the initial course of POMS is relapsing multiple sclerosis (RMS)Citation6, while it is observed in approximately 85% of the patients in adult-onset MS (AOMS)Citation4. Patients with POMS present with a higher relapse rate, and convert to secondary progressive multiple sclerosis (SPMS) at a much younger age than patients with AOMSCitation4,Citation7. Although patients with POMS have a slower accumulation of disability compared with AOMS patients, they develop irreversible disability at a median 10 years younger ageCitation4. Compared with AOMS, headache and fatigue are more common symptoms in POMS, and patients also face several physical limitationsCitation8. Patients with POMS have a worse prognosis than those with AOMS in terms of magnetic resonance imaging (MRI) changes and cognitive impairment, and they are more prone to psychological problems and difficulties with social adjustmentCitation9,Citation10.
The diagnosis of MS during childhood is associated with lower health-related quality of life (HRQoL) in parents, and can place financial burden on health care systems and patients’ families, both directly and indirectlyCitation11–13. In 90% of patients with POMS, the number of school days missed is high because of medical appointments, relapses, and side effects of therapyCitation14. Parents encounter indirect costs associated with travel to appointments and other activities associated with the child’s care, such as lost wages, reduced work productivity, and career decisions associated with the child’s illnessCitation13.
NationalCitation15–17 and internationalCitation18,Citation19 clinical practice guidelines recommend first-line treatment with disease-modifying therapies (DMTs) at an early stage in POMS to prevent relapses, progressive CNS damage, and accumulation of disability. First-line therapies suggested by consensus statements for the treatment of MS in the pediatric age were intramuscular or subcutaneous interferon (IFN) β-1a, IFN β-1b, or glatiramer acetateCitation15–18. In case of inadequate treatment response, cycling between first-line therapies or switching to a second-line agent has been recommendedCitation15,Citation16,Citation18. These guidelines are based on the efficacy and safety data from observational studies or small retrospective case reports and series, and none of the currently recommended DMT therapies have completed randomized controlled trials in a pediatric population. IFN-β and glatiramer acetate have been the most frequently used agents for the treatment of POMSCitation20–22. The results of observational studies suggest that treatment with IFN-β and glatiramer acetate in POMS is associated with a reduction in the relapse rate and stabilization of Expanded Disability Status Scale (EDSS)Citation23,Citation24. However, these effects have not yet been confirmed in studies with a long-term follow-upCitation25,Citation26.
Fingolimod is a sphingosine-1 receptor modulator that modulates trafficking of T cells in the CNS. PARADIGMS was the first successfully completed Phase III, randomized, controlled, double-blind clinical trial in patients with POMS between 10 and 18 years of age. The objective of the PARADIGMS study was to compare fingolimod versus IFN β-1a for the treatment of patients with POMS. Fingolimod, administered orally, is currently the first and only approved DMT by the Food and Drug Administration (FDA), European Medicines Agency (EMA), and Health Canada for POMS to reduce the frequency of clinical exacerbations. It was approved based on data from the PARADIGMS studyCitation27.
Compared with IFN β-1a at a dose of 30 μg per week, fingolimod reduced the annualized relapse rate (ARR) by 81.9%, decreased the number of new or newly enlarged T2 lesions by 52.6%, reduced the risk of 3-month confirmed disability progression by 77.2%, decreased the annual rate of brain atrophy, and improved several other measures of disease progression at the 2-year follow-upCitation27 Fingolimod is an effective treatment for both treatment-naïve and treatment-experienced patients with POMS, with a safety profile consistent with that of its trials in AOMSCitation27, and it may improve compliance compared with injections, particularly in the younger population. As the first analysis of its kind, our objective was to report the incremental cost-effectiveness of fingolimod versus IFN β-1a for the treatment of pediatric patients aged 10 years and above with RMS in Canada.
Methods
Patient population and interventions
Individual patient baseline characteristics and their initial EDSS distribution were obtained from the PARADIGMS trialCitation27 Dosing options based on body weight were available for the pediatric population on fingolimod treatment: (i) pediatric patients >40 kg, fingolimod 0.5 mg capsule administered orally once daily, and (ii) pediatric patients ≤40 kg, fingolimod 0.25 mg capsule administered orally once daily. The disease characteristics of the initial population are summarized in . The primary intervention in the model was fingolimod, which was compared with IFN β-1a for the treatment of pediatric patients aged 10 years and above with RMS.
Table 1. Patient baseline characteristics in the PARADIGMS clinical trial.
Model structure
A discrete-time Markov cohort model with annual cycle length was chosen to account for individual patient history as an important driver of future outcomes. The concept of this model was based on previously published pharmacoeconomic evaluationsCitation28–30. Additionally, this model provides payers with more accurate information on which to base resource allocation considering the variations in individual disease course and health resource requirementsCitation31. The model was developed in Microsoft Excel to simulate the disease course of patients with POMS receiving treatment with fingolimod versus IFN β-1a. The multi-state Markov model based on the 10-point Kurtzke EDSS scores with 21 states (10 for RMS, 10 for SPMS, and the “Death” state) was considered ().
Figure 1. Model concept. Abbreviations. RMS, relapsing multiple sclerosis; BSC, best supportive care; SPMS, secondary progressive multiple sclerosis; white colour in RMS indicates patients on BSC; dark grey indicates RMS and light grey indicates SPMS health states; white colour in SPMS indicates no patients in these health states due to the nature of disease.
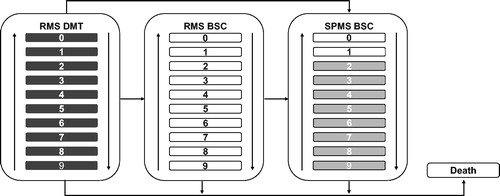
A hypothetical cohort of patients with RMS was tracked as they progressed through different defined health states. At the time of entry in the model, the cohort was classified into the EDSS states according to the baseline EDSS distribution in the PARADIGMS clinical trialCitation27. Patients in health states with EDSS scores 0–6 were considered as on-treatment and received DMTs. During each cycle of the model, patients experienced the following: (i) disability progression (move to a higher EDSS state) or improvement in the disability status (move to a lower EDSS state) or remain at their current level of disability (same EDSS state) or transit from RMS to SPMS; (ii) patients with EDSS scores ≥6.5 and who transitioned to SPMS were discontinued from DMT administration owing to the lack of efficacy and were moved to the off-treatment group and received best supportive care (BSC); (iii) relapse events; and (iv) mortality events and move to the death state. Patients who discontinued treatment were assumed to retain the cumulative benefits of the DMT up to the point of discontinuation; therefore, no waning effect was considered either for fingolimod or its comparators. On discontinuation, patients’ progression and relapse rates were based on the natural history model. A time horizon of two years, in-line with the PARADIGMS clinical study duration, was explored in the analysis.
Clinical inputs
Disability progression
The natural history disability progression defines the rate of transition between the EDSS states. The transition probability data for patients with POMS were not available in the existing evidence. However, a population-based study from the UK including 111 patients with POMS reported the difference in the rate of disability progression between AOMS and POMSCitation7. To estimate the POMS transition matrix, the rate difference was applied on the transition probabilities for adult patients with RMS from the British Columbia Multiple Sclerosis (BCMS) population-based databaseCitation32, and on AOMS for IFN β-1a as estimated in CADTH MS therapeutic reviewCitation33. Established in 1980, the BCMS database captures approximately 80% of the MS population in CanadaCitation27,Citation32. The derived transition probability matrix was used for pediatric MS patients up to 18 years of age. The relative risk for 3-month confirmed disability progression in patients with POMS treated with fingolimod was estimated from the PARADIGMS study versus IFN β-1a ()Citation27.
Table 2. Efficacy estimates from the PARADIGMS trial.
Annualized relapse rate
The ARR per EDSS state was derived by multiplying the relapse rates by disease duration with EDSS distribution by disease duration. Natural history ARRs for pediatric patients (age <18 years) was estimated using adult natural history ARRs multiplied by 2.3 in-line with a published estimate that reports ARR data for patients with POMS over 6 years of diseaseCitation34. For IFN β-1a, treatment specific ARRs were estimated from the PARADIGMS study till EDSS 5, and for EDSS 6 and above it was estimated using the rate difference between EDSS states as observed in the natural history ARR. The proportion of relapses requiring hospitalization and those not requiring hospitalization for both fingolimod and IFN β-1a was estimated from the PARADIGMS clinical trial.
Discontinuation probability and adverse events
Data on discontinuation of DMTs because of AEs or lack of efficacy were obtained from the PARADIGMS clinical studyCitation27.
Mortality
The probability of death was considered as a function of time to account for the increasing risk of death associated with the increasing age of the cohort. The annual probability of death for MS patients in Canada was estimated by multiplying the mortality risk of the general population obtained from Statistic Canada with the mortality risk for MS obtained from published standardized mortality ratios. An excess mortality adjustment factor was estimated from published studiesCitation35,Citation36. The study by Pokorski et al.Citation35 reported the excess death rate for age at onset of <20 as 8.6, and for age at onset >20 (assumed to be same as excess death rate for all ages) as 13. Therefore, the adjustment factor is calculated as follows: adjustment factor = excess death rate for age <20/excess death rate for all ages.
Cost inputs
Costs were included for each EDSS state; drug acquisition, administration, and monitoring; AEs; and relapses. Only two studies from Canada were identified that reported direct costs associated with EDSS health states up to 6Citation37,Citation38, and the costs for health states above 6 were estimated using the assumption from Patwardhan et al.Citation39 (). Relapse costs requiring hospitalization (severe cases) and non-hospitalization (mild/moderate cases) were derived from published studiesCitation37,Citation39. The drug acquisition costs were obtained from the online database of the Ontario drug benefit formulary exceptional access program listCitation40 (). We used the cost of 0.5 mg fingolimod in the model since this is the most frequently used dose in patients with POMS. The drug administration, monitoring requirements, and AE costs for pediatric patients were assumed to be similar to that of adult patientsCitation33, and were estimated using the Ontario schedule of benefits for physician servicesCitation41 and Ontario schedule of benefits for laboratory servicesCitation42 (). Pediatric tariffs were used wherever applicable. For consistency, all costs including drug acquisition costs were based on 2018 data.
Table 3. Annual MS disease management costs (CAD).
Table 4. Drug acquisition costs.
Table 5. Administration and monitoring costs.
Utility inputs
The PARADIGMS trial assessed the QoL of patients with POMS and their parents by using the Pediatric Quality of Life Inventory (PedsQL)Citation43. The PedsQL does not summarize QoL as a utility that can be used directly in the cost-effectiveness analysis. Therefore, utilities were estimated by mapping PedsQL data onto the Child Health Utility Index-9 Dimension (CHU9D) using a published mapping algorithmCitation44. Mapped CHU9D short form (15 items) utility values provided meaningful insights in terms of the correlation between PedsQL and utility values. Therefore, mapping from PedsQL to CHU9D short form was considered in the modelCitation44. None of the published studies reported the disutility of caregivers who managed pediatric patients with MS. The caregivers of children with MS are expected to have worse disutility than the caregivers of adults. Because of the lack of available data, caregiver disutility in the model was assumed to be same for managing pediatric and adult patients with MS, and was obtained from a published study on caregivers of people with adult MSCitation45 ().
Table 6. Utility estimates used in the analyses.
Analysis
This analysis evaluated the cost-effectiveness of fingolimod versus IFN β-1a for the treatment of POMS. The perspective of the analysis was that of the Canadian health care system over a time horizon of two years representing patients followed up to mean age of 18 years which is in-line with the PARADIGMS clinical trial follow-up. Annual cycle length was employed in the model, in-line with previous HTA submissions. Future costs and benefits were discounted at 1.5% per annum in-line with the CADTH guidelines for economic evaluations. A willingness-to-pay (WTP) threshold of Canadian dollars (CAD) 50,000 per quality-adjusted life-year (QALY) was considered as cost effective for new medicines, although CADTH does not formally state such a thresholdCitation46.
Sensitivity analyses
Sensitivity analyses (probabilistic, deterministic, and alternative scenario analyses) assessed the robustness of results and how changes in the input parameters affect the results. Probabilistic sensitivity analysis (PSA) was conducted where values from all input parameters were sampled from appropriate distributions (Monte Carlo simulation) to simulate a range of plausible incremental cost-effectiveness ratio (ICER) values. The results of the PSA were reported in terms of net monetary benefit (NMB), representing the value of a treatment in monetary terms at a given WTP threshold. In the deterministic one-way sensitivity analysis, the model input parameters were changed (one at a time) to assess the impact of each variable on the model results. The inputs that were included in the sensitivity analysis are presented in the Supplementary Material (Table S1). A cost-effectiveness acceptability curve was generated by estimating the NMB statistic for fingolimod versus IFN β-1a across a wide range of WTP thresholds within each simulation (), which was calculated by assuming a WTP threshold, and then converting the health benefits (QALYs) into the common metric of dollars. The cost associated with fingolimod and IFN β-1 was then subtracted (NMB = [E × WTP] − C; E = effectiveness and C = cost)Citation47. The treatment regimen with the greatest NMB at each specific WTP threshold was considered the most cost-effective option. In addition, analysis was also conducted based on subgroups including treatment-naïve and treatment-experienced patients.
Results
Results indicated that the QALYs gained with fingolimod in the childhood/adolescence phase were 1.500 compared with 1.376 with IFN β-1a. Compared with IFN β-1a, fingolimod yielded 0.125 more QALYs (total discounted) over a time horizon of two years representing patients followed up to 18 years of age. Because fingolimod was estimated to provide 0.125 QALYs at CAD 2,977, the fingolimod ICER was CAD 23,886/QALY over this time horizon ().
Table 7. Cost-effectiveness of fingolimod versus IFN β-1a.
Sensitivity analyses
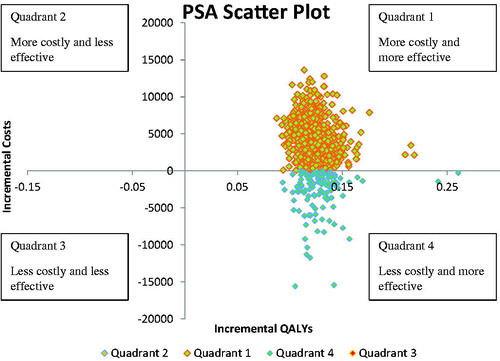
The results of the PSA were summarized using a cost-effectiveness scatter plot (), and a cost-effectiveness acceptability curve (). In the scatter plot, the north-east quadrant included simulations in which fingolimod was more effective and more costly than IFN β-1a, and the south-east quadrant included simulations in which fingolimod was more effective and less costly than IFN β-1a. Compared with IFN β-1a, fingolimod was projected to yield higher QALYs at higher costs in 83% of the simulations, and higher QALYs at lower costs in 17% of simulations. In different simulations, if the calculated ICERs for fingolimod compared with IFN β-1 were lower than the specified WTP threshold, situations in which fingolimod would be selected over IFN β-1a were indicated. The probability of fingolimod to be cost-effective versus IFN β-1a was estimated to be 78% at a WTP threshold of CAD 50,000.
Figure 2. Cost-effectiveness acceptability curve. Abbreviations. IFN, interferon; WTP, willingness-to-pay.
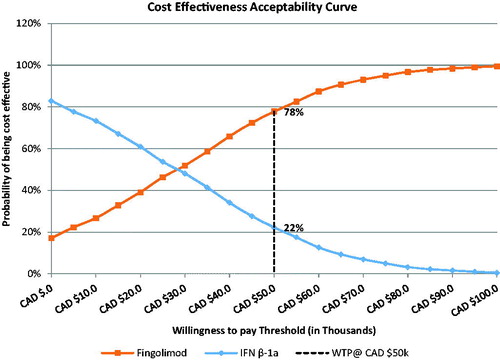
Figure 3. Cost-effectiveness PSA scatter plot. Abbreviations. CAD, Canadian dollar; PSA, probabilistic sensitivity analysis; QALY, quality-adjusted life-year; WTP, willingness-to-pay.
In deterministic sensitivity analyses, the NMB for fingolimod versus IFN β-1a was most sensitive to assumptions regarding treatment discontinuation (with no discontinuation favoring fingolimod treatment), perspective of analysis, and treatment efficacy.
The subgroup analysis results based on treatment-naïve or treatment-experienced patients were consistent with the base case results (), and were more favorable in treatment-experienced patients.
Discussion
Fingolimod is the first approved DMT indicated for the treatment of children and adolescents with RMS aged 10 to less than 18 years. Fingolimod was granted “breakthrough therapy” designation by the FDA in December 2017 for this pediatric indication. The focus of this study was to evaluate the cost-effectiveness of fingolimod versus IFN β-1a as a treatment option for POMS; the results suggest that fingolimod is projected to yield higher QALYs at a higher cost versus IFN β-1a over a time horizon of two years representing patients followed up to a mean age of 18 years. A lifetime time horizon would better reflect the anticipated course of the disease from childhood to adulthood but would be associated with significant uncertainty from a modelling perspective. The results using a lifetime horizon are presented in the Supplementary Material for illustrative purposes (Supplementary Material, Table S2). The findings also highlight the sensitivity of the results to treatment discontinuation (with no discontinuation favoring fingolimod treatment), perspective of the analysis and treatment efficacy. Cost of the DMTs is one of the major drivers of overall cost for the management of MS. Furthermore, the acquisition cost of fingolimod is higher in comparison to IFN β-1a, therefore upon discontinuation, the cost outweighs the benefits associated with the treatment resulting in favorable outcome. With reference to treatment efficacy, fingolimod reduced the risk of confirmed disability progression by 77.2% over 24 months compared with IFN β-1a in the PARADIGMS clinical trialCitation27. Due to the delay in disability progression, patients spend more time in the lower EDSS states, which is associated with lower cost of management; therefore, the results of our analysis are sensitive to treatment efficacy. Furthermore, there are additional costs associated with more severe health states when the analysis is conducted from a societal perspective, thus influencing the results. PSA suggested a higher likelihood of fingolimod being a cost-effective treatment option compared with IFN β-1a. Results of the deterministic sensitivity analysis suggested that the findings of base case analyses are robust to changes in specific parameter estimates.
Disability progression in MS is measured in terms of EDSS irrespective of the onset and type, and EDSS is routinely used in clinical practice in both adults as well as pediatric patients with MSCitation48,Citation49. The recent evaluations of the cost-effectiveness of DMTs in adult-onset RMS include a model structure based on EDSS, and this indicates that an EDSS based Markov model is appropriate for use in MS economic models irrespective of the patient age.
As there is limited literature available on resource use and utilities in patients with POMS, the resource use in patients with POMS was assumed to be similar to those with AOMS. This is likely to be a conservative assumption since it is anticipated that resource use may be higher in patients with POMS, considering the high number of relapsesCitation4,Citation7 and worse prognosis than AOMS in terms of MRI changes and cognitive impairmentCitation9,Citation10. Furthermore, to derive utilities, four algorithms were available to map PedsQL onto EuroQol-5D (EQ-5D)Citation50, CHU9DCitation44,Citation51, and health utilities index (HUI) 3Citation52. Of the four algorithms, one of the algorithmsCitation51 was excluded from the analysis since the population included in the study was aged between 6 and 12 years, and was not similar to the PARADIGMS study populationCitation51. Another algorithm included patients with autism spectrum disorders with an average age of 8.4 years (standard deviation [SD] 3.5 years); this was also excluded based on the differences in the age group of patients in this study and the PARADIGMS populationCitation52. Of the algorithms mapping PedsQL to CHU9D, one of them mapped onto CHU9D full form (23 items), while another one mapped onto CHU9D short form (15 items).
The estimated higher total cost of fingolimod was largely attributable to higher costs of fingolimod acquisition and management of side effects compared with IFN β-1a. However, the estimated differences in costs diminished because of higher relapses and disease progression costs in IFN β-1a.
In common with many other studies in pediatric diseases, the main limitations of this analysis primarily stem from the limited data availability in pediatric patients with MS. There are very few publications, which provide data for inputs used in our model such as the natural history of disability progression, utilities, cost, and resource use. To derive the transition probability matrix of disability progression, the natural history data were obtained from a study by Harding et alCitation7. Approximately, one-third of patients were receiving treatment at the time of the studyCitation7, while the natural history progression defines the transition of patients in the absence of treatment. In the absence of other data, this was used in the model. Furthermore, the assumptions related to estimation of transition probability matrices may need to be validated using long-term epidemiological data, which is currently not available. Secondly, the PARADIGMS study provides efficacy and safety data for fingolimod over a 2-year period, and the long-term efficacy and safety of fingolimod is yet to be established in pediatric patients with MS. The results from the PARADIGMS study proves the treatment benefits of fingolimod in the POMS population. The observed efficacy estimates for fingolimod versus IFN β-1a from the PARADIGMS study were better than what is observed in AOMSCitation53. Considering the observed efficacy of fingolimod in patients with pediatric MS, this data when used over a longer time horizon further improve the cost-effectiveness of the fingolimod treatment. However, these estimates need to be interpreted with caution considering the uncertainty due to limited long-term data for POMS patients. Therefore, the model was run for a time horizon of two years representing patients followed up to mean age of 18 years which is a significantly shorter time horizon and reduces the uncertainty associated with the model. Finally, there were very few patients with a body weight of ≤40 kg in the PARADIGMS study, hence it was not feasible to conduct the analysis for this patient group.
Conclusions
This cost-effectiveness analyses showed that fingolimod was more costly than IFN β-1a, both in the overall patient population and in the subgroup of patients who were either treatment naïve or treatment experienced. However, fingolimod was more effective than IFN β-1a, yielding an ICER of CAD 23,886 for a time horizon of two years representing patients followed up to an age of 18 years. The subsequent PSA confirmed the robustness of these results. The results of the PARADIGMS study together with these analyses and the respective risk–benefit profile of these DMTs should help guide clinical decision making in order to optimize disease management of patients with POMS.
Transparency
Declaration of funding
This study was funded by Novartis Pharmaceuticals Canada Inc., Dorval, Quebec, Canada.
Declaration of financial/other relationships
HRN, UV, VK, RS, and NA are employees of Novartis.
DP reports personal fees from Novartis outside the submitted work. JKM reports research grants from Novartis, during the conduct of the study.
GS has nothing to disclose.
JME peer reviewers on this manuscript have received an honorarium from JME for their review work, but have no other relevant financial relationships to disclose.
Author contributions
HRN, UV, VK, RS, NA were involved in involved in the conception and design, or analysis and interpretation of the data; the drafting of the paper or revising it critically for intellectual content; and the final approval of the version to be published
DP, JM, GM were involved in analysis and interpretation of the data; the drafting of the paper or revising it critically for intellectual content; and the final approval of the version to be published
All authors agree to be accountable for all aspects of the work.
Previous presentation
This has been previously presented at the 71st Annual meeting of the American Academy of Neurology, 4–10 May 2019, Philadelphia, USA.
Supplemental Material
Download MS Word (67.9 KB)Acknowledgements
No assistance in the preparation of this article is to be declared.
References
- Chitnis T, Glanz B, Jaffin S, et al. Demographics of pediatric-onset multiple sclerosis in an MS center population from the Northeastern United States. Mult Scler. 2009;15(5):627–631.
- Gadoth N. Multiple sclerosis in children. Brain Dev. 2003;25(4):229–232.
- Pohl D, Hennemuth I, von Kries R, et al. Paediatric multiple sclerosis and acute disseminated encephalomyelitis in Germany: results of a nationwide survey. Eur J Pediatr. 2007;166(5):405–412.
- Renoux C, Vukusic S, Mikaeloff Y, et al. Natural history of multiple sclerosis with childhood onset. N Engl J Med. 2007;356(25):2603–2613.
- Banwell B, Kennedy J, Sadovnick D, et al. Incidence of acquired demyelination of the CNS in Canadian children. Neurology. 2009;72(3):232–239.
- Waldman A, Ness J, Pohl D, et al. Pediatric multiple sclerosis: clinical features and outcome. Neurology. 2016;87(9 Suppl 2):S74–S81.
- Harding KE, Liang K, Cossburn MD, et al. Long-term outcome of paediatric-onset multiple sclerosis: a population-based study. J Neurol Neurosurg Psychiatry. 2013;84(2):141–147.
- Singh I, Wu E, Mar S. Multiple sclerosis: association between radiological burden and headache severity. Ann Neurol. 2016;80(s20):S333–S334.
- Amato MP, Krupp LB, Charvet LE, et al. Pediatric multiple sclerosis: cognition and mood. Neurology. 2016;87(9 Suppl 2):S82–S87.
- Baruch NF, O’Donnell EH, Glanz BI, et al. Cognitive and patient-reported outcomes in adults with pediatric-onset multiple sclerosis. Mult Scler. 2016;22(3):354–361.
- Ketelslegers IA, Catsman-Berrevoets CE, Boon M, et al. Fatigue and depression in children with multiple sclerosis and monophasic variants. Eur J Paediatr Neurol. 2010;14(4):320–325.
- Lavery AM, Banwell BL, Liu G, et al. Hospital admission rates for pediatric multiple sclerosis in the United States using the Pediatric Health Information System (PHIS). Mult Scler Relat Disord. 2016;9:5–10.
- Wright MA, Korgenski EK, Bardsley T, et al. Comprehensive population-based determination of pediatric multiple sclerosis health care costs. Neurol Neuroimmunol Neuroinflamm. 2017;4(1):e314.
- Amato MP, Goretti B, Ghezzi A, et al. Neuropsychological features in childhood and juvenile multiple sclerosis: five-year follow-up. Neurology. 2014;83(16):1432–1438.
- Ghezzi A, Banwell B, Boyko A, et al. The management of multiple sclerosis in children: a European view. Mult Scler. 2010;16(10):1258–1267.
- Govender R. Guideline for the diagnosis and management of multiple sclerosis in children. S Afr Med J. 2013;103(9 Suppl 3):692–695.
- Waldman AT, Gorman MP, Rensel MR, et al. Management of pediatric central nervous system demyelinating disorders: consensus of United States neurologists. J Child Neurol. 2011;26(6):675–682.
- Chitnis T, Tenembaum S, Banwell B, et al. Consensus statement: evaluation of new and existing therapeutics for pediatric multiple sclerosis. Mult Scler. 2012;18(1):116–127.
- Snowden JA, Saccardi R, Allez M, et al. Haematopoietic SCT in severe autoimmune diseases: updated guidelines of the European Group for Blood and Marrow Transplantation. Bone Marrow Transplant. 2012;47(6):770–790.
- Correia A, Augusto L, Meireles J, et al. Pediatric multiple sclerosis in Portugal: a multicentre study. Acta Med Port. 2016;29(7–8):425–431.
- Greene N, Greene M. PND4 – health care resource utilization associated with pediatric patients diagnosed with relapsing remitting multiple sclerosis. Value Health. 2015;18(7):A878.
- Yeh EA, Waubant E, Krupp LB, et al. Multiple sclerosis therapies in pediatric patients with refractory multiple sclerosis. Arch Neurol. 2011;68(4):437–444.
- Ghezzi A, Amato MP, Annovazzi P, et al. Long-term results of immunomodulatory treatment in children and adolescents with multiple sclerosis: the Italian experience. Neurol Sci. 2009;30(3):193–199.
- Mikaeloff Y, Moreau T, Debouverie M, et al. Interferon-beta treatment in patients with childhood-onset multiple sclerosis. J Pediatr. 2001;139(3):443–446.
- Kornek B, Bernert G, Balassy C, et al. Glatiramer acetate treatment in patients with childhood and juvenile onset multiple sclerosis. Neuropediatrics. 2003;34(3):120–126.
- Mikaeloff Y, Caridade G, Tardieu M, et al. Effectiveness of early beta interferon on the first attack after confirmed multiple sclerosis: a comparative cohort study. Eur J Paediatr Neurol. 2008;12(3):205–209.
- Chitnis T, Arnold DL, Banwell B, et al. Trial of fingolimod versus interferon beta-1a in pediatric multiple sclerosis. N Engl J Med. 2018;379(11):1017–1027.
- Lee S, Baxter DC, Limone B, et al. Cost-effectiveness of fingolimod versus interferon beta-1a for relapsing remitting multiple sclerosis in the United States. J Med Econ. 2012;15(6):1088–1096.
- Mauskopf J, Fay M, Iyer R, et al. Cost-effectiveness of delayed-release dimethyl fumarate for the treatment of relapsing forms of multiple sclerosis in the United States. J Med Econ. 2016;19(4):432–442.
- Chevalier J, Chamoux C, Hammès F, et al. Cost-effectiveness of treatments for relapsing remitting multiple sclerosis: a French societal perspective. PloS One. 2016;11(3):e0150703.
- Standfield L, Comans T, Scuffham P. Markov modeling and discrete event simulation in health care: a systematic comparison. Int J Technol Assess Health Care. 2014;30(2):165–172.
- Palace J, Bregenzer T, Tremlett H, et al. UK multiple sclerosis risk-sharing scheme: a new natural history dataset and an improved Markov model [Research Support, Non-U.S. Gov't]. BMJ Open. 2014;4(1):e004073.
- Comparative clinical and cost-effectiveness of drug therapies for relapsing-remitting multiple sclerosis. [Internet]. CADTH Therapeutic Review. Vol. 1(2B). Ottawa (ON): Canadian Agency for Drugs and Technologies in Health; 2013.
- Benson LA, Healy BC, Gorman MP, et al. Elevated relapse rates in pediatric compared to adult MS persist for at least 6 years. Mult Scler Relat Disord. 2014;3(2):186–193.
- Pokorski RJ. Long-term survival experience of patients with multiple sclerosis. J Insurance Med (New York, NY). 1997;29(2):101–106.
- Smestad C, Sandvik L, Celius EG. Excess mortality and cause of death in a cohort of Norwegian multiple sclerosis patients. Mult Scler. 2009;15(11):1263–1270.
- Grima DT, Torrance GW, Francis G, et al. Cost and health related quality of life consequences of multiple sclerosis. Mult Scler. 2000;6(2):91–98.
- Karampampa K, Gustavsson A, Miltenburger C, et al. Treatment experience, burden, and unmet needs (TRIBUNE) in multiple sclerosis: the costs and utilities of MS patients in Canada. J Popul Therap Clin Pharmacol. 2012;19(1):e11–e25.
- Patwardhan MB, Matchar DB, Samsa GP, et al. Cost of multiple sclerosis by level of disability: a review of literature. Mult Scler. 2005;11(2):232–239.
- Drug Programs Policy and Strategy Branch Ontario Public Drug Programs Ministry of Health and Long-Term Care Ontario: Minisrtry of Health; 2018. [updated 2018 Dec 31; cited 2019 Nov 1]; 43. Available from: http://www.health.gov.on.ca/en/pro/programs/drugs/formulary43/summary_edition43_20180524.pdf.
- Ontario Health Insurance Plan Schedule of Benefits: Physician Services Under the Health Insurance Act, 552, 2017.
- Ontario Health Insurance Plan, Laboratories and Genetics Branch, Schedule of Benefits for Laboratory Services, 552, 2017.
- Varni JW, Seid M, Rode CA. The PedsQL: measurement model for the pediatric quality of life inventory. Med Care. 1999;37(2):126–139.
- Mpundu-Kaambwa C, Chen G, Russo R, et al. Mapping CHU9D utility scores from the PedsQLTM 4.0 SF-15 . Pharmacoeconomics. 2017;35(4):453–467.
- Acaster S, Perard R, Chauhan D, et al. A forgotten aspect of the NICE reference case: an observational study of the health related quality of life impact on caregivers of people with multiple sclerosis. BMC Health Serv Res. 2013;13(1):346.
- Griffiths EA, Vadlamudi NK. PHP278 – Cadth’s $50,000 cost-effectiveness threshold: fact or fiction? Value Health. 2016;19(7):A488–A489.
- Drummond MF, Sculpher MJ, Claxton K, et al. Methods for the economic evaluation of health care programmes. 4th ed. Oxford: Oxford University Press; 2015.
- Alroughani R, Ahmed S, Al-Hashel J. Demographics and clinical characteristics of pediatric onset multiple sclerosis. Mult Scler Relat Disord. 2014;3(6):739.
- McKay KA, Hillert J, Manouchehrinia A. Long-term disability progression of pediatric-onset multiple sclerosis. Neurology. 2019;92(24):e2764–e2773.
- Khan KA, Petrou S, Rivero-Arias O, et al. Mapping EQ-5D utility scores from the PedsQL generic core scales. Pharmacoeconomics. 2014;32(7):693–706.
- Lambe T, Frew E, Ives NJ, et al. Mapping the paediatric quality of life inventory (PedsQL) generic core scales onto the child health utility index-9 dimension (CHU-9D) score for economic evaluation in children. Pharmacoeconomics. 2018;36(4):451–465.
- Payakachat N, Tilford JM, Kuhlthau KA, et al. Predicting health utilities for children with autism spectrum disorders. Autism Res. 2014;7(6):649–663.
- Cohen JA, Barkhof F, Comi G, et al. Oral fingolimod or intramuscular interferon for relapsing multiple sclerosis. N Engl J Med. 2010;362(5):402–415.
- Hawton A, Green C. Health utilities for multiple sclerosis. Value Health. 2016;19(4):460–468.
- Orme M, Kerrigan J, Tyas D, et al. The effect of disease, functional status, and relapses on the utility of people with multiple sclerosis in the UK. Value Health. 2007;10(1):54–60.