
Abstract
Aims
In clinical trials, disability progression in multiple sclerosis (MS) is measured by the Kurtzke expanded disability status scale (EDSS), which is not captured in routine clinical care in the U.S. This study developed a claims-based disability score (CDS) based on the EDSS for assigning MS disability level in a U.S. claims database.
Methods
This retrospective cohort study of patients with MS in the U.S., utilized adjudicated health plan claims data linked to electronic medical records (EMRs) data. Patients were identified between 1 January 2012 and 31 December 2016 and indexed on the first date of MS diagnosis. The CDS was developed to assign disability level at baseline using claims and ambulatory EMR records observed over the 1-year baseline period. All-cause healthcare costs were assessed by baseline disability level to validate the CDS.
Results
In total, 45,687 patients were identified in claims (full sample) and 1,599 linked to EMR (core sample). Over half of patients in both samples were classified with mild disability at baseline. Adjusted healthcare costs in patients with moderate and severe disability were 15% (p<.0001) and 20% higher, respectively, than in patients with mild disability at baseline in the full sample. Disease-modifying therapy (DMT) costs accounted for 89%, 82%, and 78% of outpatient pharmacy costs in patients with mild, moderate, and severe disability, respectively.
Conclusions
The CDS is the first claims-based measure of MS disability utilizing data from EMR. This novel measure advances the opportunity to examine outcomes by disability accumulation in the absence of standard markers of disease progression. Although formal validation of the CDS was not possible due to lack of available EDSS in the EMR, the economic burden results align with prior publications and show that healthcare costs increase with increasing disability. Future validation studies of the CDS are warranted.
Background
Multiple sclerosis (MS) is the most common cause of neurological disability in adults of working age, and is characterized by inflammation, demyelination, gliosis, and axonal destruction throughout the central nervous systemCitation1,Citation2. In 2016, an estimated 2.2 million people worldwide had MS, corresponding to a prevalence of 30.1 cases per 100,000 populationCitation3. In the U.S., the incidence of MS is estimated to be 2.0 cases per 100,000 person-years in men and 3.6 in womenCitation4. MS is a very costly chronic disease based on prior analyses using privately insured claims databases, with direct and indirect costs (including costs of disease-related absences from work, short- and long-term disability) that approximately comprised 77% (range 64–91%) and 23% (range 9–36%) of total healthcare costs, respectivelyCitation5,Citation6.
MS disability progression is most commonly measured by the expanded disability status scale (EDSS) in clinical trialsCitation7. The EDSS is a clinician-based instrument that includes assessment of seven functional systems (plus “other”) including pyramidal, cerebellar, brainstem, bowel and bladder, sensory, visual, and cerebral. The score is reported in half point increments from 0 (with no disability due to MS) to 10 (death due to MS) based on neurological and physical examinationsCitation8. Other important EDSS cut-offs include: 6 (requires a walking aid such as a cane or crutch), 7 (restricted to wheelchair), 8 (restricted to bed/chair), and 9 (confined to bed). Even while the EDSS is the gold standard in measuring disability in the clinical trial setting, it is not typically used in routine clinical care in the US. As such, it is not reliably found in secondary data sources used for health-outcomes research, such as EHRs or administrative claims, making it difficult to capture the economic burden of advancing MS disease. As such, this is still an evidence gap, with limited literature on methods to assign or approximate MS disability levels in administrative healthcare claims data. A prior study by Munsell et al. developed a claims-based measure as an indicator of disease status based on healthcare costsCitation9, however, the results were not corroborated with clinical measures of disability, such as the EDSS.
Establishing the level of MS disability progression in real-world evidence studies presents researchers with a challenge, as the majority of available claims and electronic medical record (EMR) databases do not routinely contain EDSS score. Indeed, per our initial estimate, less than 1% of EMR records contained the EDSS number. To overcome this limitation, this study developed a claims-based disability score (CDS) to characterize disability status using the eight functional systems that comprise the EDSS using EMR data linked to adjudicated healthcare claims, with the guidance of physicians who specialize in the treatment of MS. This methodology leverages both claims and narrative EMR information to enhance prior efforts that have used claims only and allows MS patients characterization by disability level in real world settings.
Methods
This was a retrospective cohort study of patients with MS in the U.S. identified between 1 January 2012 and 31 December 2016. Disability level was characterized by observation of proxies for ambulation/functional status in claims (e.g. wheelchair claim, diagnosis of urinary incontinence), and vitals/problem lists in the EMR (e.g. visual disturbance, tactile sensation). Patients were stratified into approximate disability levels, consistent with their observed characteristics during the 1-year pre-index period and as aligned with the underlying continuum of disability as represented in the EDSS. Demographic information was collected at index date, and included age, sex, geographic region, and payer type. Clinical characteristics were collected during the 1-year pre-index period, and included the Charlson comorbidity index (CCI), common comorbidities, MS-related medication use, MS relapse, and MS-related symptoms and secondary conditions. MS relapse was defined as having an inpatient hospitalization with a primary diagnosis of MS or having a claim for an oral or intravenous corticosteroid within seven days after an MS-related outpatient visitCitation10. The study utilized secondary data from the IQVIA PharMetrics PlusFootnotei database which was linked to IQVIA’s Ambulatory EMR (AEMR) data.
Patient selection
The study consisted of two main study cohorts: the full sample, which comprised all eligible MS patients identified in PharMetrics Plus; and the core sample, which included MS patients identified in PharMetrics Plus who linked to AEMR data.
The full sample included patients with at least two outpatient claims (≥30 days apart) with a diagnosis code for MS or ≥1 inpatient claim with a primary diagnosis of MS observed between 1 January 2012 and 31 December 2016. The date of the first MS diagnosis occurring during this window was the index date. Patients had ≥1 year of continuous health plan enrollment with pharmacy and medical benefits prior to and after the index date, were ≥20 years of age on the index date and had no data quality issues in the claims database. The core sample consisted of a subset of patients from the full sample who linked to the AEMR database and had at least one diagnosis record of MS or evidence of disease-modifying therapy (DMT) in the AEMR between 1 January 2011 and 31 December 2017. Patients in the core sample were also required to have at least one visit record in the AEMR database within one year prior to the index date to assess pre-index disability.
Development of EDSS-based disability criteria
The CDS was developed in a series of steps, with guidance from four medical experts (MEs); three of whom are physicians specializing in MS treatment, and one of whom is a medical director at the sponsoring institution. As a first step, an initial list of broad terms related to MS symptomology and the EDSS criteria was developed. These terms were then searched for in two tables of the AEMR database: the problem list and the vitals tables and the list was further refined based on the data. The problem list table contains all diagnoses recorded by a physician during a clinical encounter, while the vitals table contains data on patient vitals, timed walk results, and orders for durable medical equipment (DME).
After finalizing the list, terms were mapped to EDSS and functional system score (FSS) categories which included: bowel and bladder, brainstem, cerebellar, cerebral, pyramidal, sensory, visual function, other. Three MEs then independently assigned a severity score to each term, based on their clinical opinion. Scores ranged from 1 (mild) to 3 (severe). In cases of disagreement between MEs, the final severity score for a term was established based on a majority ruling.
Next, terms for diagnoses were mapped to International Classification of Diseases, Ninth Revision, Clinical Modification (ICD-9-CM), International Classification of Diseases, Tenth Revision, Clinical Modification (ICD-10-CM), terms related to procedures and DME were mapped to Current Procedural Terminology (CPT). Three MEs independently assigned a severity score to each clinical code, based on code descriptions and their clinical opinion. As previously, a majority ruling determined the final score for each code in cases of disagreement.
After identifying the two study populations, the AEMR records and claims for each patient were assessed for the occurrence of the terms/billing codes occurring during the 1-year pre-index period. The CDS at baseline was defined using the following hierarchy:
Severe: Defined as having ≥1 EDSS-related symptom with severity score = 3 in any functional system;
Moderate: Defined as having ≥1 EDSS-related symptom with severity score = 2 in any functional system, or having ≥2 functional systems with severity score = 1;
Mild: Defined as having only one EDSS-related symptom with severity score = 1 or having no EDSS-related symptoms observed during the measurement period.
For patients with additional years of follow-up available, the disability level was re-assessed at year 1 and year 2 post-index. Values could not regress to a lower disability level. In other words, if a patient’s disability level was considered moderate at baseline, the patient could not be considered mild at year one.
Finally, as an informal validation of the CDS, total healthcare costs accrued during the 1-year post-index period was calculated for each patient in the full sample to assess whether the expected trend of cost increasing with increasing disability level was observed. Total healthcare costs included medical and outpatient pharmacy costs, including DMT infusions. The proportion of outpatient pharmacy costs attributable to DMTs was also assessed. In patients with additional years of follow-up, healthcare costs were calculated in each year after disability level was established. Unadjusted costs were calculated by summing the allowed amount on all claims occurring during the 1-year post-index period. All costs were adjusted to 2018 dollars using the healthcare component of the Consumer Price Index.
Statistical methods
Chi-square tests were used to compare categorical demographic and clinical variables by disease severity. For continuous measures, t-test and analysis of variance (ANOVA) were used to make comparisons by disease severity.
A generalized linear model with gamma distribution and log link functionCitation11,Citation12 was developed to assess differences in cost by disability level. The outcome was total all-cause healthcare costs accrued over the fixed one-year post-index period. Independent variables in the model included: baseline disability level, age category, sex, region, CCI, pre-index use of DMTs, pre-index occurrence of MS relapse, and the log of pre-index total all-cause healthcare cost. Wald chi-square tests were used to compare costs between patients with mild versus moderate or severe disability. The adjusted mean healthcare costs in patients with mild, moderate, and severe MS disability were estimated using the recycle prediction methodCitation13 and the standard error of the means were calculated using bootstrapping with 1,000 repetitionsCitation14.
Results
A total of 45,687 and 1,599 eligible patients were included in the full sample and core sample, respectively (). Patients in the full sample had a mean age of 49 and 76% of the study population was female (). Most reflected mild disability at index (mild: 66%, moderate: 22%, severe: 13%). The core sample had similar baseline characteristics as the full sample (mean age: 49 years; 78% female) with a slightly higher proportion of patients having moderate disability per the CDS (28%) and lower proportion having mild disability (58%) (). The remaining results reported are for the full sample.
Figure 1. Patient attrition.
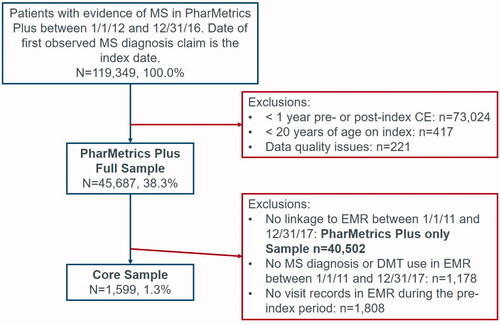
Table 1. Characteristics of the full sample.
Table 2. Characteristics of the core sample.
The mean (standard deviation (SD)) 1-year total unadjusted all-cause healthcare costs ranged from $45,574 (39,908) in patients with mild disability to $60,567 (61,880) in patients with severe disability at baseline, with a significant associated observed between cost and disability level (p<.0001). Healthcare costs were largely driven by outpatient pharmacy costs, most of which was due to the cost of DMTs. In patients with mild disability, 89% of outpatient pharmacy costs were due to DMTs (DMT costs: $30,555 (27,984)). In patients with moderate disability, DMTs accounted for 82% of outpatient pharmacy costs (DMT costs: $30,212 (28,320)). Finally, DMT costs accounted for 78% of outpatient pharmacy costs in patients with severe disability at baseline (DMT costs: $27,251 (28,968)).
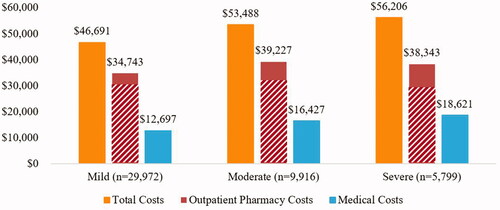
Adjusted total annual healthcare costs (mean ± SE) were highest among severe patients: $56,206 ± 87, followed by moderate: $53,488 ± 83, and mild: $46,691 ± 72 (). Comparison across disability level showed that adjusted total annual healthcare costs were 15% (p≤.0001) and 20% (p<.0001) higher in moderate and severe than mild patients, respectively.
Figure 2. Adjusted healthcare costs by baseline disability level in the full sample (n = 45,687). The patterned portion of the pharmacy costs indicates costs associated with DMT use.
Discussion
To our knowledge, this is the first published study to develop a measure of MS disability in claims data that proxies the EDSS, which is considered the gold standard disability assessment and endpoint in clinical trials. Key medical expertise in using EMR narrative and claims data to approximate disability level was central in this process including alignment on potential proxy indicators, a priori, followed by rigorous review of the resulting groupings by internal and external MEs. Overall, higher disability level per the CDS was associated with increased total all-cause 1-year post-index healthcare cost, for both unadjusted and adjusted cost analyses. The increase in total cost at higher disability levels was due to increases in both medical and outpatient pharmacy costs.
While pharmacy costs increased between patients with mild and moderate disability and leveled-off, medical costs increased steadily from one disability level to the next. Jones et al. which quantified the relationship between increased disability and health care resource utilization, quality of life, work productivity, and health care costs in patients with MS also found increased disability was associated with increased health care resource utilization and costs. The finding of this study using the proxy measure of MS disability was consistent with finding from the study by Jones et al. in which EDSS score was used to measure disabilityCitation15. Similarly, Kobelt et al. reported that costs for severely disabled individuals were more than twice those for persons with relatively mild diseaseCitation16. Compared to an individual with an EDSS score of 2, costs for an individual with an EDSS score of 8 are almost three times as highCitation17. In addition, an observational, cross-sectional multi-country study which collected information on 16,808 patients’ characteristics, disease type, use of resources and loss of resource and used EDSS to stratify patients by disease level also showed the relationship between costs and disability, that costs increased on average fivefold between mild and severe MSCitation18.
While total healthcare costs increased, the proportion of pharmacy costs attributed to DMTs decreased with increasing CDS, indicating a need for more treatment options in patients with severe disability. Studies have shown that current DMTs are not clinically effective in patients with EDSS ≥ 6.5Citation19. A survey of 26 neurologists with expert knowledge of MS in Europe, North America and New Zealand found that nearly 60% of surveyed neurologists preferred to stop DMTs at an EDSS between 6.0 and 8.0. Some indicated that third-party reimbursement is a factor in discontinuing DMTs at certain levels of EDSSCitation20. Most recently, a consensus paper by the MS coalition concluded that access to DMTs should not be limited by level of disabilityCitation21, which is a shift from prior recommendations, possibly due to the approval of newer therapies indicated for a more progressed patient populationCitation22.
In summary, this is the first published US study using claims in combination with EMR data to develop a score measuring MS disability level, an important indicator of MS progression, using all eight functional systems of the EDSS. In alignment with prior research, healthcare costs steadily increase with increasing CDS level. The CDS advances the opportunity to examine treatment patterns and outcomes by disability accumulation in the absence of standard markers of disease progression. However, this study has several limitations. First, while EDSS is routinely used in clinical trials, it is not typically collected in clinical practice; therefore, it was only available in a small portion of patients in the EMR database. Only four patients (0.3%) in the core sample had an EDSS available, thus formal validation of the CDS was not conducted. The level of disability for study patients was estimated using proxies for ambulation/functional status in claims or vitals/problem lists in the EMR. While the claims coding was expected to be specific, the use of relevant codes may not confer sensitivity in the grouping approach used in this study. Thus, these proxies and the final determination of accuracy of the disability designation were established in conjunction with clinical ME input and review. These proxies were intended to categorize patients solely for the research purposes in this study. They do not represent a clinical designation and may be challenged by external stakeholders. The CDS is a static measure of patient disability and may inaccurately designate a severity level to patients who are in the midst of a relapse during the CDS measurement period. Despite these limitations, we believe this methodology captured our intention to assess the viability of utilizing real-world data sources to identify patient disability level. Second, the ambulatory EMR includes only data captured from physicians contributing to the EMR network. Patients that have vitals measurements (e.g. visual disturbance, tactile sensation) taken by health care providers outside of the network are not captured. This could lead to a limitation of generalizability of our findings. Third, PharMetrics Plus data are sourced primarily from employer-sponsored commercial and self-insured plans, and as such underrepresent patients older than 65 years of age, specifically those with fee-for-service Medicare, thus limiting the generalizability of the study in older adults. This is an important limitation since MS is a chronic condition that is typically diagnosed in working-age adults, and ultimately leads to disability, which may then invoke Medicare coverage. Fourth, this analysis is retrospective in nature and relies upon existing coding in claims data and narrative text in EMR that were not collected for research purposes to approximate disability level. In addition, the IQVIA patient claims and EMR datasets apply a proprietary linkage methodology and as such cannot be made fully transparent. As a result, complete verification of the linkage cannot be ascertained and the possibility of error in linkage may exist. Lastly, indirect costs and direct non-medical costs associated with MS were not captured in the databases. Prior studies have found that while direct medical costs are important contributors in the earlier stages of MS, indirect costs outweigh direct medical costs in later stagesCitation5,Citation6. Future studies validating the CDS are warranted.
Transparency
Declaration of funding
This study was sponsored by Novartis Pharmaceuticals Corporation.
Declaration of financial/other relationships
RB, EF, and AO provide consulting services to Novartis. MG and RLW are employees of IQVIA, which received consulting fees to conduct research on this study. YD was an employee of IQVIA at the time the study was completed. LB was a postdoctoral research fellow at Novartis at the time the study was completed. WS and KJ are employees of Novartis. PR was an employee of Novartis at the time the study was completed. A peer reviewer on this manuscript has disclosed that they have previously been, and are currently, involved in research to assess the severity of MS patients using claims data (but not in EMR/EHR data). A peer reviewer on this manuscript has disclosed that they have been a speaker for several MS medication companies. The peer reviewers on this manuscript have no other relevant financial relationships or otherwise to disclose.
Author contributions
RB, EF, AO, and WS were involved in the study design and provided clinical guidance. MG, RLW, and YD designed the study, provided interpretation of the results, and drafted the manuscript. LB, PR, and KJ were involved in the study design, interpretation of results, and manuscript editing.
Previous presentations
Results from this study were presented at the 35th Congress of the European Committee for Treatment and Research in Multiple Sclerosis.
Acknowledgements
The authors thank Hsiu-Ching Chang for conducting the programming and statistical analysis.
Notes
i PharMetrics Plus is a registered trademark of IQVIA, Plymouth Meeting, PA, USA.
References
- Hempel S, Estrada E, Chen A, et al. Modifiable risk factors in the progression of multiple sclerosis: a systematic review of the epidemiology and treatment. VA evidence-based synthesis program reports. Washington (DC): Department of Veterans Affairs (US); 2015.
- Bansi J, Bloch W, Gamper U, et al. Training in MS: influence of two different endurance training protocols (aquatic versus overland) on cytokine and neurotrophin concentrations during three week randomized controlled trial. Mult Scler. 2013;19(5):613–621.
- Wallin MT, Culpepper WJ, Nichols E, et al. (GBD 2016 Multiple Sclerosis Collaborators). Global, regional, and national burden of multiple sclerosis 1990–2016: a systematic analysis for the Global Burden of Disease Study 2016. Lancet Neurol. 2019;18(3):269–285.
- Alonso A, Hernan MA. Temporal trends in the incidence of multiple sclerosis: a systematic review. Neurology. 2008;71(2):129–135.
- Adelman G, Rane SG, Villa KF, et al. The cost burden of multiple sclerosis in the United States: a systematic review of the literature. J Med Econ. 2013;16(5):639–647.
- Ivanova JI, Birnbaum HG, Samuels S, et al. The cost of disability and medically related absenteeism among employees with multiple sclerosis in the US. Pharmacoeconomics. 2009;27(8):681–691.
- Goldman MD, Motl RW, Rudick RA. Possible clinical outcome measures for clinical trials in patients with multiple sclerosis. Ther Adv Neurol Disord. 2010;3(4):229–239.
- Kurtzke JF. Rating neurologic impairment in multiple sclerosis: an expanded disability status scale (EDSS). Neurology. 1983;33(11):1444–1452.
- Munsell M, Frean M, Menzin J, et al. Development and validation of a claims-based measure as an indicator for disease status in patients with multiple sclerosis treated with disease-modifying drugs. BMC Neurol. 2017;17(1):106.
- Chastek BJ, Oleen-Burkey M, Lopez-Bresnahan MV. Medical chart validation of an algorithm for identifying multiple sclerosis relapse in health care claims. J Med Econ. 2010;13(4):616–625.
- Moran JL, Solomon PJ, Peisach AR, et al. New models for old questions: generalized linear models for cost prediction. J Eval Clin Pract. 2007;13(3):381–389.
- Barber J, Thompson S. Multiple regression of cost data: use of generalised linear models. J Health Serv Res Policy. 2004;9(4):197–204.
- Li Z, Mahendra G. Using ‘recycled predictions’ for computing marginal effects. Proceedings of the SAS® Global Forum 2010 Conference. Cary, NC: SAS Institute, Inc.; 2010.
- Guan W. From the help desk: bootstrapped standard errors. Stata J. 2003;3(1):71–80.
- Jones E, Pike J, Marshall T, et al. Quantifying the relationship between increased disability and health care resource utilization, quality of life, work productivity, health care costs in patients with multiple sclerosis in the US. BMC Health Serv Res. 2016;16(1):294.
- Kobelt G, Berg J, Atherley D, et al. Costs and quality of life in multiple sclerosis. SSE/EFI Working Paper Series in Economics and Finance No. 594; 2004. p. 1–34.
- Lipsy RJ, Schapiro RT, Prostko CR. Current and future directions in MS management: key considerations for managed care pharmacists. J Manag Care Pharm. 2009;15(9 Suppl. A):S2–S15.
- Kobelt G, Thompson A, Berg J, et al. New insights into the burden and costs of multiple sclerosis in Europe. Mult Scler J. 2017;23(8):1123–1136.
- Goodin DS, Frohman EM, Garmany GP, et al. Disease modifying therapies in multiple sclerosis: report of the Therapeutics and Technology Assessment Subcommittee of the American Academy of Neurology and the MS Council for Clinical Practice Guidelines. Neurology. 2002;58(2):169–178.
- Lonergan R, Kinsella K, Duggan M, et al. Discontinuing disease-modifying therapy in progressive multiple sclerosis: can we stop what we have started? Mult Scler. 2009;15(12):1528–1531.
- Costello K, Halper J, Kalb R, et al. The use of disease-modifying therapies in multiple sclerosis: principles and current evidence; 2020; [cited 2020 Apr 24]. Available from: https://www.mscare.org/page/dmt
- Kappos L, Bar-Or A, Cree BAC, et al. Siponimod versus placebo in secondary progressive multiple sclerosis (EXPAND): a double-blind, randomized, phase 3 study. Lancet. 2018;391(10127):1263–1273.