
Abstract
Aims
To examine the impact of increasing multi-target stool DNA test (mt-sDNA [Cologuard]) utilization for colorectal cancer (CRC) screening in cohorts aged 50–75 and 45–75 years old with varying levels of adherence from the perspectives of integrated delivery networks (IDNs) and payers.
Materials and methods
We developed a budget impact model that simulates CRC screening with colonoscopy over a 10-year time horizon, fecal immunochemical test (FIT), and mt-sDNA according to the United States Preventive Services Task Force and American Cancer Society guidelines for average risk adults. We evaluated varying levels of screening adherence for a status quo scenario and for an increased mt-sDNA utilization scenario, from the IDN and payer perspectives. The IDN perspective included CRC screening program costs, whereas the payer perspective did not. Conversely, stool-based screening test and bowel preparation costs were unique to the payer perspective.
Results
The increased mt-sDNA scenarios yielded cost savings relative to the status quo under all adherence scenarios due to a decrease in screening and surveillance colonoscopies. For ages 50–75, in high and low adherence scenarios, savings were $19.8 M ($0.16 per-person-per-month (PPPM)) and $33.3 M ($0.28 PPPM) from the IDN perspective. From the payer perspective, savings were $4.2 M ($0.03 PPPM) and $6.7 M ($0.06 PPPM). For ages 45–75, in high and low adherence scenarios, cost savings were $19.3 M ($0.16 PPPM) and $33.0 M ($0.28 PPPM) from the IDN perspective and $3.9 M ($0.03 PPPM) and $6.2 M ($0.05 PPPM) from the payer perspective. In all imperfect adherence scenarios, the degree of cost-savings with increased mt-sDNA utilization correlated with the aggregate decrease in screening and surveillance colonoscopies.
Limitations
Estimates of real-world adherence levels were based on cross-sectional screening data from the literature, and assumptions were applied to individual screening modalities and screening scenarios.
Conclusions
Among all adherence scenarios, perspectives, and age ranges, increased mt-sDNA utilization yielded cost-savings.
Introduction
Colorectal cancer (CRC) is the third most common cancer diagnosed in the United States, encompassing 8.3% of all new cancer cases in 2019Citation1. CRC is also the second leading cause of cancer deaths in the United States, with 8.4% of cancer deaths attributed to CRC in 2019Citation1. Previous studies have demonstrated that CRC screening reduces mortalityCitation2–14, and that the majority of deaths from CRC are preventable by screening and early detectionCitation6. Although the proportion of adults up-to-date with CRC screening has increased, over one third of adults have not been screened as recommended by guidelinesCitation15. Multiple CRC screening modalities are available with different performance characteristics, risk of complications, screening intervals, and requirements for bowel preparation and sedation – all factors that may impact an individual’s screening preferences. Offering choices for CRC screening with informed decision-making or shared decision-making has been shown to improve screening uptakeCitation16,Citation17. The US Preventive Services Task Force (USPSTF) guidelines for CRC screening do not recommend any one modality over another; instead, the guidelines emphasize that all recommended screening methods can help save lives, and that “the best test is the test that gets done”Citation2,Citation8.
Cost-effectiveness models in the CRC screening space traditionally assume perfect adherence to estimate the health and economic outcomes of implementing different CRC screening modalities within the US health systemCitation4,Citation5. For example, the Cancer Intervention and Surveillance Modeling Network (CISNET-CRC) analyses, used to inform USPSTF and ACS guidelines, assumed perfect (100%) adherence with all CRC screening, follow-up, and surveillance proceduresCitation5,Citation18–20. Although perfect adherence is ideal, this assumption is unrealistic and models may be better informed by real-world adherence dataCitation6,Citation7,Citation21. A 2009 cost-effectiveness analysis based on the National Health Interview Survey (NHIS) and literature-based parameters found that increasing adherence not only improves health outcomes, but is also cost-effectiveCitation6.
Our previous health economic modeling study used imperfect cross-sectional adherence estimates from the literatureCitation22–26. That analysis demonstrated cost-savings for ages 50–75 and 45–75 from the integrated delivery network (IDN) and payer perspectives. IDNs consist of integrated provider networks, such as hospitals, urgent care centers, and laboratories. The aim of this study was to examine the impact of increasing multi-target stool DNA test (mt-sDNA [Cologuard]) utilization under low, high, and perfect levels of cross-sectional adherence. Analyses were conducted for the IDN and payer perspectives for screening 50- to 75-year-old and 45- to 75-year-old cohorts.
Methods
A Markov state-transition model was developed to examine the health economic impact of increasing mt-sDNA utilization relative to colonoscopy and FITCitation22. The model assessed the health and economic consequences pertinent to IDNs and payers over a 10-year time horizon, which aligns with the longest recommended screening interval of the modalities being evaluated. In the status quo scenario, screening modality utilization remains constant throughout the time horizon at 83, 11, and 6% for colonoscopy, fecal immunochemical test (FIT), and mt-sDNA modalities among eligible screenersCitation25. The status quo scenario was compared to an increased mt-sDNA scenario, in which all modalities begin at the corresponding status quo utilization percentages in year one, but the mt-sDNA utilization increases from 6 to 28% over 10 years whereas colonoscopy and FIT decrease to 63 and 9%, respectively.
The screening algorithm and intervals for each modality were developed according to the 2016 USPSTF and 2018 ACS CRC screening guidelinesCitation2,Citation8. Eligible individuals in the model are screened with mt-sDNA, FIT, or colonoscopy. If the test is negative, mt-sDNA screeners enter a tunnel (non-screening) state and are eligible for screening again in 3 years. Negative FIT screeners are eligible for rescreening annually, and colonoscopy screeners with negative results enter a tunnel state for the remainder of the time horizon, as guidelines recommend rescreening at 10 years. In the primary analysis, the model simulated a hypothetical population of 1 million covered adult lives, of which 302,000 adults at average risk for CRC and between 50 and 75 years of age are eligible for screening according to the USPSTF guidelinesCitation2,Citation8. We also modeled a 45- to 75-year-old cohort, of whom 368,000 are eligible based on the ACS’s qualified recommendation to initiate screening at age 45 (). Each cohort is divided into 5-year age bands. Age-specific risk profiles for CRC incidence, prevalence of adenomas, and death are allocated to each age bandCitation5,Citation30,Citation31.
Table 1. Population and adherence estimates.
In the analysis of 50–75-year olds, we assumed that 50% of 50–54-year olds (the youngest age band in the model) had been screened. Therefore, 50% of 50–54-year olds enter the screening eligible pool in the first year of the time horizon whereas the other 50% gradually enter the screening eligible pool according to recommended screening intervals. In the analysis of the 45–75-year-old cohort, we assumed that all 45–49-year olds are screening-naïve and therefore eligible in the first year of the time horizon (see ).
Figure 1. Screening mix and adherence.
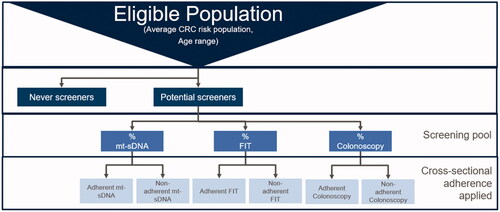
For both screening scenarios (status quo and increased mt-sDNA), we implemented three distinct screening adherence scenarios (low, high, and perfect). Each adherence scenario reflects both initial cross-sectional adherence, i.e. the proportion of eligible screeners who initially screen with their prescribed modality, as well as subsequent cross-sectional adherence, i.e. the proportion of the screening pool that continues to screen with their initial modality at the prescribed frequency after the initial screenCitation2. Also included in the screening adherence scenarios was cross-sectional diagnostic colonoscopy adherence, i.e. the proportion of individuals screened with a positive stool-based screening test (FIT or mt-sDNA) who undergo a follow-up diagnostic colonoscopy.
For each screening and adherence scenario, the model was used to calculate health-care costs over a 10-year time horizon, as well as clinical outcomes including the number of each type of test performed and the number of CRC cases detected. Additionally, the model estimated longitudinal screening adherence, defined as the proportion of eligible patients screened according to guidelines over a period of 10 yearsCitation2.
Imperfect cross-sectional adherence scenarios
To reflect real-world adherence, we modeled low and high cross-sectional adherence scenarios that included values based on a targeted literature review of adherence for mt-sDNA, FIT, and colonoscopy (). In these imperfect cross-sectional adherence scenarios, it was assumed that a percentage of individuals would remain screening naïve throughout the time horizonCitation23, which created more realistic utilization patterns by averting 100% screening uptake in the model. Individuals who remain unscreened throughout the time horizon are considered “never-screeners”, whereas those who screen at least once are considered “potential screeners” ( and ). When potential screeners initially enter the screening pool, the screening utilization mix is applied. Subsequently, adherence estimates by modality are applied in order to determine how many individuals are screened. Each time an individual screens, the IDN and payer incur costs. Never-screeners do not enter the screening pool, so they do not incur screening-related costs; however, some never-screeners are diagnosed with CRC due to symptomatic disease, and, therefore, treatment costs are incurredCitation22.
When individuals screen negative, they remain at average CRC risk and re-enter the screening pool in subsequent cycles when due for screening again. Utilization of stool-based screening tests results in more screening events throughout the time horizon because of shorter screening intervals compared with colonoscopy. For example, individuals determined to be at average CRC risk after a negative FIT screening re-enter the screening pool the following year, as annual screening is recommended, whereas mt-sDNA screeners re-enter in three years. People who are screened via colonoscopy, however, do not re-enter the screening pool, as the recommended screening interval is 10 years, the length of the model’s time horizonCitation2. Patients who test positive with the stool-based tests are subjected to a diagnostic colonoscopy, where benign, pre-cancerous, and cancerous lesions may be removed via polypectomy. Within the model, patients who have polypectomy are assumed to receive surveillance colonoscopy every three or five years if an advanced adenoma is detected, depending on adenoma size and histology. People who are non-adherent to screening in an annual cycle, and who remain at average CRC risk, re-enter the screening pool in the following cycle, during which the cohort is redistributed among that cycle’s screening utilization mix. This modeling strategy differs from CISNET-CRC analyses, in which screening is simulated via one modality at a timeCitation5.
The presence of the never-screener cohort affects not only the size of the screening pool, but also modeled CRC incidence. Never-screeners experience greater CRC incidence, which also serves as the baseline incidence to which literature-based CRC incidence reductions are applied. The employed incidence reductions are based on CISNET (81% for colonoscopy, 67% for FIT, and 63% for mt-sDNA), which assumed 100% adherence.Citation5 In order to adjust for imperfect adherence, we weighted the reductions according to cross-sectional adherence and applied the calculated values per modality to potential screeners. Additional details about this methodology have previously been describedCitation22.
In the low adherence scenario, initial cross-sectional adherence for colonoscopy, FIT, and mt-sDNA were assumed to be 38Citation16, 48Citation26, 67.5%Citation25, respectively, and subsequent cross-sectional adherence was assumed to be 54% for FITCitation28 and mt-sDNA. Follow-up diagnostic colonoscopy adherence was assumed to be 55.6% for both stool-based testsCitation29. In the high adherence scenario, initial cross-sectional screening adherence was assumed to be 64Citation23, 64.7Citation24, and 71.1%Citation27 for colonoscopy, FIT, and mt-sDNA, respectively. Subsequent cross-sectional screening adherence was assumed to be 86.1% for FITCitation26 and mt-sDNA. Cross-sectional diagnostic colonoscopy adherence for positive stool-based screening (98.6%) was assumed to be the same for FIT and mt-sDNA ()Citation24. The low adherence scenario entails disproportionately lower cross-sectional screening adherence with FIT and colonoscopy, reflecting real-world data for adherenceCitation16,Citation23–27,Citation29,Citation32.
Perfect adherence scenario
In order to assess the potential differences in results when modeling real-world adherence compared to perfect adherence, a perfect adherence scenario was modeled. All cross-sectional adherence estimates were assumed to be 100%. By definition, a perfect adherence scenario requires that all eligible screeners become potential screeners. Thus, the perfect adherence scenario includes a larger screening pool in the 1st year compared to the imperfect adherence scenarios (). Furthermore, the exclusion of a never-screener cohort from the perfect adherence scenario permitted CRC reductions to be applied to all potential screeners, reducing overall CRC incidence compared to imperfect adherence scenarios. See , the supplement, and a previous publicationCitation22 for key clinical parameters.
Table 2. Key clinical parameters.
Cost data
Cost components for both the IDN and payer perspectives incorporated screening, diagnostic, and surveillance colonoscopies, adverse events (AEs), and CRC treatment costs. Colonoscopy procedure and AE costs were based on Centers for Medicare and Medicaid Services (CMS) CPT codesCitation30 and the Health Cost and Utilization Project (HCUP)Citation18, respectively. CRC treatment costs were based on literature estimatesCitation4.
FIT and mt-sDNA costs were $18.05 and $508.87, based on CPT codes (G0328 and 81528) from the Centers for Medicare & Medicaid Lab Fee ScheduleCitation32. The bowel preparation cost was $78.83, a weighted average from branded and generic bowel preparations from the literatureCitation35. As a non-payer owned delivery system, an IDN is assumed to incur neither bowel preparation nor stool-based screening test costs since these healthcare resources are not paid for by the IDNCitation6. Hence, these costs were unique to the payer perspective and were based on the literature and CMS 2019 laboratory fee scheduleCitation32,Citation35.
To assess the costs of screening programs, the IDN perspective uniquely includes direct non-medical costs (such as navigation services for individuals and provider supportCitation36) and indirect costs (such as screening program management and administration servicesCitation36). Each time an individual screens, the IDN incurs screening program costs for the modality used. Colonoscopy and FIT screening program costs were derived from the literatureCitation37, whereas mt-sDNA costs are based on assumptions associated with costs estimated to be in addition to those services provided by the manufacturer’s laboratoryCitation25. Total CRC screening program costs are a composite of direct non-medical and indirect costs. In the primary analysis, the total direct non-medical costs per person are $296.89, $217.73, and $40.63 for colonoscopy, FIT, and mt-sDNA. Several cost categories, such as patient navigation, were assumed to be $0 for mt-sDNA, as these costs are already included in the cost of the test. The total indirect costs for colonoscopy, FIT, and mt-sDNA are $632.32, $792.74, and $463.97Citation22. Costs of some of these items, such as program management for mt-sDNA, were assumed to be the average of the corresponding costs for FIT and colonoscopy. The resulting total CRC screening program costs per individual per screening event are $929.21, $1,010.47, and $504.20 for colonoscopy, FIT, and mt-sDNA. Further details on the line item costs for screening programs have been previously reportedCitation22.
All costs were derived from 2019 data or were updated to 2019 USD according to the medical component of the consumer price index (CPI)Citation38. Cost indices were calculated and utilized to estimate Commercial and Medicaid costs from published Medicare estimates and vice versa. The Medicare-to-Commercial cost index was 1.27, based on data from Medicare Payment Advisory Commission (MedPAC)Citation39. The Medicare-to-Medicaid cost index was 0.72, based on data from the Henry J. Kaiser Family FoundationCitation40. For each perspective, the per-person-per-month (PPPM) cost was calculated as a metric that is applicable to both the payer and the IDN perspectives.
Deterministic sensitivity analysis (DSA)
To understand which model parameters have the largest impact on the results, we conducted a deterministic sensitivity analysis (DSA) on the imperfect adherence scenarios for ages 50–75 from the payer perspective. Clinical inputs related to proportions of AEs, advanced and non-advanced adenomas present during screening, and death rates were individually varied according to 95% confidence intervals from published estimates while keeping all other variables constant.
Stool-based cost-saving threshold analysis for the IDN perspective
Given that providing choices of CRC screening modalities to patients has been shown to increase screening uptakeCitation16, IDNs may want to directly compare scenarios offering less invasive screening modalities. As such, a threshold analysis was run in order to determine the total screening program cost per person screening with FIT that would result in a $0 budget impact when directly comparing FIT to mt-sDNA in high and low adherence scenarios. The threshold analysis was run by simulating two modality utilization scenarios: one in which all potential screeners carried out screening with FIT and another in which all are screened with mt-sDNA.
Results
Clinical outcomes
With increased mt-sDNA utilization compared to the status quo, longitudinal adherence (adherence with repeat screening events) over the course of 10 years did not vary; however, it did change in accordance with the adherence scenarios modeled. Longitudinal adherence was 100% for all perfect adherence scenarios, 80% for high adherence scenarios, and 76% for low adherence scenarios.
The number of screening events conducted over the 10-year time horizon also varied with adherence scenarios (). When increasing mt-sDNA utilization among 50–75 year olds, the number of total colonoscopies was highest (414,770) in the perfect adherence scenario and lowest (336,958) in the high adherence scenario ( and S3). With increased mt-sDNA utilization for the 50–75 year old cohort, the numbers of stool-based tests were 104,321, 90,316, and 121,528 for the perfect, high, and low adherence scenarios.
Figure 2. Incremental number of screening events (increased mt-sDNA-status quo), ages 50–75.
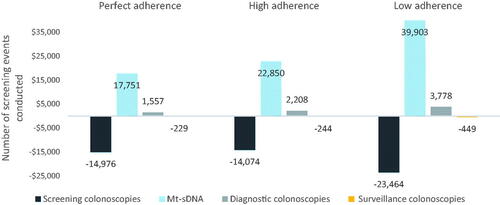
Table 3. Clinical outcomes per adherence scenario, ages 50–75 years.
With increased mt-sDNA utilization, the numbers of detected cancers were 127, 1,260, and 1,564 for perfect, high, and low adherence levels in ages 50–75, and the numbers of advanced adenomas were 9,095, 7,525, and 8,119 ( and S3). Greater prevention of CRC occurs with higher detection of advanced adenomas in the perfect adherence scenario compared to the high adherence scenario. There are two methodological reasons for the large difference in detected cancers between perfect and high adherence scenarios: 1) in the perfect adherence scenario, all eligible screeners experience CRC incidence reductions, whereas with imperfect adherence, the reductions are not applied to never-screeners; and 2) in the perfect adherence scenario, individuals who screen experience full literature-based CRC incidence reductions whereas in imperfect adherence scenarios, potential screeners experience weighted reductions based on adherence. When assessing the difference in number of cancers detected, 2, 4, and 1 more CRCs were detected among the 50–75-year-old cohort in the increased mt-sDNA utilization scenario compared to the status quo, with similar results to the 45–75-year-old cohort ( and S3). This is a result of the greater CRC incidence reduction applied to colonoscopy screeners (81%) compared to mt-sDNA (63%)Citation27. The incidence reduction between colonoscopy and mt-sDNA is attributable to the difference in test sensitivity of the two tests for pre-cancer and advanced adenomaCitation2,Citation33.
Cost outcomes
Increased mt-sDNA utilization yielded cost-savings among all adherence scenarios, cohorts, and perspectives. When comparing the same adherence scenarios and cohorts, the IDN perspective realized greater cost-savings than the payer perspective due to the cost components included. In the perfect, high, and low adherence scenarios from the IDN perspective, cost-savings were $26.7 M, $19.8 M, and $33.3 M (corresponding to PPPM savings of $0.22, $0.16, and $0.28, respectively). For ages 50–75 from the payer perspective, cost-savings were $9.9 M, $4.2 M, and $6.7 M (corresponding to PPPM savings of $0.08, $0.03, and $0.06) in the perfect, high, and low adherence scenarios. For ages 45–75, savings were $17.2 M ($0.14 PPPM), $19.3 M ($0.16 PPPM), and $33 M ($0.28 PPPM) from the IDN perspective and $3.7 M ($0.03 PPPM), $3.9 M ($0.03 PPPM), and $6.2 M ($0.05 PPPM) from the payer perspective in the perfect, high, and low adherence scenarios (). Cost savings were also seen after 3 years. Both 3-year and 10-year savings followed the same trend that the low adherence was associated with the highest savings for both perspectives (Figure S4).
Figure 3. (a) Cost-savings by adherence scenario, payer perspective. The non-monotonic direction of savings is due to the 100% screening naïve youngest age band of the 45–75-year-old cohort. (b) Cost-savings by adherence scenario, IDN perspective.
When keeping cohorts and utilization scenarios constant, the IDN perspective incurred the greatest costs in the lowest adherence scenario, followed by perfect adherence and finally high adherence, and the payer perspective incurred the greatest cost in the lowest adherence scenario, followed by high adherence and finally perfect adherence. For example, in the increased mt-sDNA scenario from the IDN perspective, total costs were $1.00 billion, $988.6 M, and $1.08 billion for perfect, high, and low adherence scenarios. The high adherence level produces the lowest total cost from the IDN perspective due to several factors; principally, it generates the lowest CRC screening costs (i.e., $403 M, $328 M, and $341 M for perfect, high, and low adherence scenarios) and the lowest CRC program costs (i.e., $477 M, $393 M, and $428 M for perfect, high, and low adherence scenarios). From the payer perspective, however, total costs were $594 M, $655M, and $729 M, principally driven by the combined cost of screening colonoscopies and stool-based tests (i.e., $469 M, $387 M, and $416 M for perfect, high and low adherence) ( and S1, and ). The low adherence level generates the highest total cost from both the IDN and payer perspectives primarily due to higher CRC treatment costs, as compared to the perfect and high adherence scenarios ( and ).
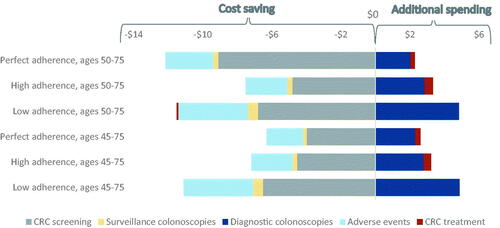
Figure 4. Incremental costs (in millions) per category (increased mt-sDNA-status quo), payer perspective.
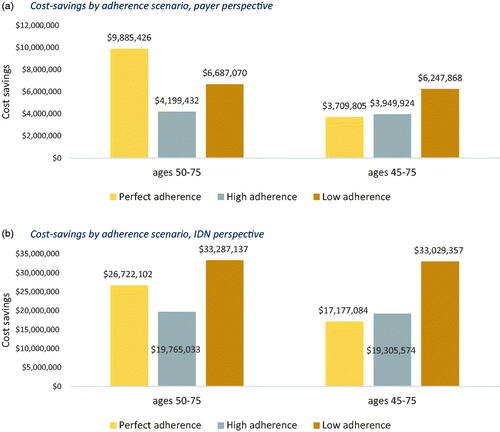
Table 4. Total costs for the IDN perspective, ages 50–75.
Table 5. Total costs for the payer perspective, ages 50–75.
Deterministic sensitivity analysis (DSA)
The DSA for ages 50–75 suggested that the model results were most sensitive to the specificity of mt-sDNA for various age groups, the specificity of colonoscopy, the fraction of colonoscopies requiring repeat screening, the proportion of never screeners, the sensitivity of colonoscopies for non-advanced adenomas, and the proportion of adverse events for colonoscopy (Figures S2 and S3). The DSA for ages 45–75 produced similar results (data not shown).
Discussion
CRC screening guidelines are informed by modeling studies (from CISNET) that conventionally incorporate perfect adherence. Although perfect screening uptake and adherence are ideal, such assumptions are impractical and do not represent screening programs in the real-world. Total cost-of-care modeling studies should aim to better inform decision makers by assessing the health and economic impacts of real-world screening uptake and adherence scenarios with uptake and adherence varied by screening modality. The results of this analysis demonstrate that by varying uptake of screening, cross-sectional adherence, and longitudinal adherence by screening modality, health outcomes and total cost-savings may be reflected in the context of real-world screening utilization.
Because it is known that improved CRC screening adherence results in reduced incidence and mortality due to CRCCitation2–14, stakeholders should focus on increasing on-time screening uptake and adherence. One potential solution to improving screening outcomes is shared or informed decision-makingCitation41– based on the patient’s risk for CRC, clinicians inform patients of their options including pros and cons of each CRC screening choice, and patients share their screening preferences and values so that barriers to screening can be overcome and uptake and adherence improvedCitation8,Citation42. If only one screening option is offered and an individual forgoes screening, the modality clearly offers no health benefits to that individual. Ultimately, the best screening modality is the guideline-recommended test that is actually completed by the patientCitation2,Citation8.
The literature demonstrates that increased CRC screening adherence improves health outcomesCitation2–14; however, assuming perfect adherence in modeling studies may lead to an overestimation of screening health benefits at a population level. As published previouslyCitation2–14, our study also demonstrates that screening adherence is negatively correlated with CRC incidence. This expected relationship between adherence and incidence is particularly prominent when comparing the number of detected pre-cancers and cancers for perfect and high adherence levels, with reductions in cancers detected ranging from 77 to 85% among ages included and modality utilization scenarios. This finding highlights not only the importance for health outcomes of screening adherence according to recommended frequencies, but also the importance of initiating screening at the age recommended in guidelines. In alignment with the ACS’s 2018 recommendation, the secondary analysis for the 45–75 age cohort also demonstrated cost-savings for the increased mt-sDNA utilization scenario.
In accordance with the literature, our analysis resulted in the lowest number of CRC cases detected among perfect adherence scenarios. A 2009 agent-based model analysis by Subramanian, Bobashev, Morris simulated three scenarios: 1) with 45% longitudinal adherence, 2) with 45% longitudinal adherence and 35% never-screeners and 3) 100% longitudinal adherence. Their analysis included different modalities, perspectives and cost components from our analysis, and did not differentiate among modality-specific cross-sectional adherence levels. As in our analysis, the greatest health benefit resulted from the 100% adherence scenarioCitation6. However, in their analysis, the 100% adherence level generated the highest costs, while our analysis had the highest costs for the low adherence level. This difference could be attributed to the different modalities and adherence levels between the two analyses.
Our modeling study results demonstrate that increased mt-sDNA utilization yields cost-savings over a 10-year time horizon for both the IDN and the payer by reducing the number of screening and surveillance colonoscopies irrespective of whether adherence is perfect, high, or low. The IDN perspective included CRC screening program costs not attributed to the payer and did not include the direct medical costs for stool-based screening tests. Therefore, as in the previous modeling studyCitation22, the IDN perspective yielded greater cost-savings compared to the payer perspective. The payer perspective demonstrates the greatest savings in the perfect adherence scenario, due to the savings in total screening costs (i.e., colonoscopy and stool-based tests). For ages 50–75 within a population of 1 million covered lives, the savings from increased mt-sDNA utilization would be $9.9 M, $4.2 M and $6.7 M for perfect, high, and low adherence. Because the payer perspective includes stool-based test costs and excludes screening program costs in the IDN perspective, the degree of savings among its adherence scenarios reflects the tradeoff between screening colonoscopies and stool-based tests when increasing mt-sDNA utilization. However, the IDN perspective results in the greatest savings in the low adherence scenario, which leads to the greatest reduction in colonoscopy screening ($17.5 M, $16.2 M and $26.9 M for perfect, high and low adherence). We calculated the cumulative cost savings for both IDN and payer perspectives after 3 and 10 years for the low and high adherence levels. The cumulative cost savings in all cases increased over time (Figure S4). Our model includes real-world estimates of adherence from the literature in support of the goal to better inform stakeholders of the health and economic consequences of increasing mt-sDNA utilization. Although the model does not capture numerous factors that add to the complexity of real-world screening decisions, including health insurance coverage, provider recommendations, socioeconomic status, and patient preferences and valuesCitation8,Citation43, it utilized the best available published data to assess the health and economic consequences of increasing mt-sDNA utilization relative to FIT and colonoscopy. The model suggests that increased mt-sDNA utilization is likely to result in cost-savings for the payer and IDN in pragmatic adherence scenarios, under both the current USPSTF (aged 50–75) and qualified ACS (aged 45–75) CRC screening recommendations.
Transparency
Declaration of funding
The funding source is Exact Sciences Corporation.
Declaration of financial/other relationships
JMH: An employee of PRECISIONheor, which provides consulting services to the pharma, biotech, and diagnostic industry including Exact Sciences. PRECISIONheor has received professional fees for the development of the economic model.
LAMW: Employment, Stock from Exact Sciences Corporation
ISJ: is an employee of PRECISIONheor, which provides consulting services to the pharma, biotech, and diagnostic industry including Exact Sciences Corporation. PRECISIONheor has received professional fees for the development of the economic model.
WY: An employee of PRECISIONheor, which provides consulting services to the pharma, biotech, and diagnostic industry, including Exact Sciences. PRECISIONheor has received professional fees for the development of the economic model.
MCW: Reports personal fees from PRECISIONheor, which provides consulting services to the pharma, biotech, and diagnostic industry including Exact Sciences, during the conduct of the study.
PDP: Employment, Stock from Exact Sciences Corporation
JME peer reviewers on this manuscript have no relevant financial or other relationships to disclose.
All authors were instrumental in drafting the manuscript and participated extensively in review and editing of the manuscript.
Supplemental Material
Download MS Word (113.7 KB)Acknowledgements
The authors acknowledge Burak Ozbay, PhD, MBA, Andrew Piscitello, PhD, and Phil L Cyr, MPH.
Notes
1 Assumption
2 Best of years 2, 3, and 4 (75.3%, 83.4%, and 86.1%)
3 Assumed to be the same as a screening colonoscopy from 5. Knudsen, A.B., et al., Estimation of Benefits, Burden, and Harms of Colorectal Cancer Screening Strategies: Modeling Study for the US Preventive Services Task Force. JAMA, 2016. 315(23): p. 2595-609.
4 Age-adjusted specificity for mt-sDNA and is related to increased shedding of methylated DNA in stool 45. Administration, U.S.F.D., FDA Summary of Safety and Effectiveness Data. 2018.
5 Assumed same as screening colonoscopy from 5. Knudsen, A.B., et al., Estimation of Benefits, Burden, and Harms of Colorectal Cancer Screening Strategies: Modeling Study for the US Preventive Services Task Force. JAMA, 2016. 315(23): p. 2595–609.
6 Colonoscopy screenings + stool-based tests
7 All colonoscopy type costs from the IDN perspective include anesthesia and the procedure
8 All colonoscopy type costs from the payer perspective include bowel preparation, anesthesia and the procedure
References
- National Cancer Institute. Cancer stat facts: colorectal cancer. 2020. [cited 2020 Apr 10]. Available from: https://seer.cancer.gov/statfacts/html/colorect.html
- Bibbins-Domingo K, Grossman DC, Curry SJ, et al. Screening for colorectal cancer: US preventive services task force recommendation statement. JAMA. 2016;315(23):2564–2575.
- Frazier AL, Colditz GA, Fuchs CS, et al. Cost-effectiveness of screening for colorectal cancer in the general population. JAMA. 2000;284(15):1954–1961.
- Goede SL, Kuntz KM, van Ballegooijen M, et al. Cost-savings to Medicare from pre-medicare colorectal cancer screening. Med Care. 2015;53(7):630–638.
- Knudsen AB, Zauber AG, Rutter CM, et al. Estimation of benefits, burden, and harms of colorectal cancer screening strategies: modeling study for the US preventive services task force. JAMA. 2016;315(23):2595–2609.
- Subramanian S, Bobashev G, Morris RJ. Modeling the cost-effectiveness of colorectal cancer screening: policy guidance based on patient preferences and compliance. Cancer Epidemiol Biomarkers Prev. 2009;18(7):1971–1978.
- Vijan S, Hwang EW, Hofer TP, et al. Which colon cancer screening test? A comparison of costs, effectiveness, and compliance. Am J Med. 2001;111(8):593–601.
- Wolf AMD, Fontham ETH, Church TR, et al. Colorectal cancer screening for average-risk adults: 2018 guideline update from the American Cancer Society. CA Cancer J Clin. 2018;68(4):250–281.
- Hewitson P, Glasziou P, Watson E, et al. Cochrane systematic review of colorectal cancer screening using the fecal occult blood test (hemoccult): an update. Am J Gastroenterol. 2008;103(6):1541–1549.
- Doubeni CA, Corley DA, Quinn VP, et al. Effectiveness of screening colonoscopy in reducing the risk of death from right and left colon cancer: a large community-based study. Gut. 2018;67(2):291–298.
- Nishihara R, Wu K, Lochhead P, et al. Long-term colorectal-cancer incidence and mortality after lower endoscopy. N Engl J Med. 2013;369(12):1095–1105.
- Schoen RE, Pinsky PF, Weissfeld JL, et al. Colorectal-cancer incidence and mortality with screening flexible sigmoidoscopy. N Engl J Med. 2012;366(25):2345–2357.
- Segnan N, Armaroli P, Bonelli L, et al. Once-only sigmoidoscopy in colorectal cancer screening: follow-up findings of the Italian Randomized Controlled Trial-SCORE. J Natl Cancer Inst. 2011;103(17):1310–1322.
- Atkin W, Wooldrage K, Parkin DM, et al. Long term effects of once-only flexible sigmoidoscopy screening after 17 years of follow-up: the UK Flexible Sigmoidoscopy Screening randomised controlled trial. Lancet. 2017;389(10076):1299–1311.
- American Cancer Society. Colorectal cancer facts & figures 2020–2022. [cited 2020 Apr 24]. Available from: https://www.cancer.org/content/dam/cancer-org/research/cancer-facts-and-statistics/colorectal-cancer-facts-and-figures/colorectal-cancer-facts-and-figures-2020-2022.pdf
- Inadomi JM, Vijan S, Janz NK, et al. Adherence to colorectal cancer screening: a randomized clinical trial of competing strategies. JAMA Int Med. 2012;172(7):575–582.
- Liang PS, Wheat CL, Abhat A, et al. Adherence to competing strategies for colorectal cancer screening over 3 years. Am J Gastroenterol. 2016;111(1):105–114.
- Zauber A, Knudsen AB, Rutter CM, et al. Evaluating the benefits and harms of colorectal cancer screening strategies: a collaborative modeling approach. Rockville (MD): Agency for Healthcare Research and Quality; 2015.
- Kuntz KM, Lansdorp-Vogelaar I, Rutter CM, et al. A systematic comparison of microsimulation models of colorectal cancer: the role of assumptions about adenoma progression. Med Decis Making. 2011;31(4):530–539.
- Arrospide A, Idigoras I, Mar J, et al. Cost-effectiveness and budget impact analyses of a colorectal cancer screening programme in a high adenoma prevalence scenario using MISCAN-Colon microsimulation model. BMC Cancer. 2018;18(1):464.
- Mannucci A, Zuppardo RA, Rosati R, et al. Colorectal cancer screening from 45 years of age: thesis, antithesis and synthesis. World J Gastroenterol. 2019;25(21):2565–2580.
- Hathway JM, Miller-Wilson LA, Jensen IS, et al. Projecting total costs and health consequences of increasing mt-sDNA utilization for colorectal cancer screening from the payer and integrated delivery network perspectives. J Med Econ. 2020;23(6):581–592.
- Chyhaniuk A, Coombes ME. Longitudinal adherence to colorectal cancer screening guidelines. Am J Manag Care. 2016;22(2):105–111.
- van Roon AHC, Goede SL, van Ballegooijen M, et al. Random comparison of repeated faecal immunochemical testing at different intervals for population-based colorectal cancer screening. Gut. 2013;62(3):409–415.
- Manufacturer data on file. Cologuard's compliance rate represents the cumulative completed tests from kits shipped to patients during the six-month period ending 12 months prior to the end of the 2019, excluding program orders. 2019.
- Jensen CD, Corley DA, Quinn VP, et al. Fecal immunochemical test program performance over 4 rounds of annual screening: a retrospective cohort study fecal immunochemical test performance characteristics. Ann Intern Med. 2016;164(7):456–463.
- Weiser E, Parks PD ,Swartz RK, et al. Cross-sectional adherence with the multi-target stool DNA test for colorectal cancer screening: Real-world data from a large cohort of older adults. J Med Screen. 2020. DOI:https://doi.org/10.1177/0969141320903756
- Parente F, Boemo C, Ardizzoia A, et al. Outcomes and cost evaluation of the first two rounds of a colorectal cancer screening program based on immunochemical fecal occult blood test in northern Italy. Endoscopy. 2013;45(1):27–34.
- Issaka RB, Singh MH ,Oshima SM, et al. Inadequate utilization of diagnostic colonoscopy following abnormal FIT results in an integrated safety-net system. Am J Gastroenterol. 2017;112(2):375–382.
- Rutter CM, Yu O, Miglioretti DL. A hierarchical non-homogenous Poisson model for meta-analysis of adenoma counts. Stat Med. 2007;26(1):98–109.
- National Center for Health Statistics. GMWK310, deaths by single years of age, race, and sex: United States, 1999–2007 [cited 2019 March]. Available from: https://www.cdc.gov/nchs/nvss/mortality/gmwk310.htm
- Centers for Medicare & Medicaid Services. Clinical laboratory fee schedule. 2019. [cited 2019 Jun 1]. Available from: https://www.cms.gov/Medicare/Medicare-Fee-for-Service-Payment/ClinicalLabFeeSched/Clinical-Laboratory-Fee-Schedule-Files.html
- Imperiale TFR, Itzkowitz DF, H S. Multitarget stool DNA testing for colorectal-cancer screening. New Eng J Med. 2014;371(2):184–188.
- Administration, U.S.F.D. FDA summary of safety and effectiveness data. 2018.
- Pyenson B, Scammell C, Broulette J. Costs and repeat rates associated with colonoscopy observed in medical claims for commercial and Medicare populations. BMC Health Serv Res. 2014;14:92.
- Zauber AG, et al. AHRQ technology assessments. Cost-effectiveness of DNA stool testing to screen for colorectal cancer. Rockville (MD): Agency for Healthcare Research and Quality (US); 2007.
- Subramanian S, Tangka FKL, Hoover S, et al. Costs of colorectal cancer screening provision in CDC’s Colorectal Cancer Control Program: comparisons of colonoscopy and FOBT/FIT based screening. Eval Program Plann. 2017;62:73–80.
- Healthcare Cost and Utilization Project (HCUP). HCUP CCS - services and procedures. 2018. [2018 Dec 1]. Available from: https://hcupnet.ahrq.gov/#setup
- Medicare Payment Advisory Commission (MedPAC). Report to the congress: medicare payment policy. 2015. [cited 2019 Jul 30]. Available from: http://www.medpac.gov/docs/default-source/reports/mar2015_entirereport_revised.pdf
- Henry J Kaiser Family Foundation. Medicaid-to-Medicare fee index. 2016. [2019 Mar 1]. Available from: https://www.kff.org/medicaid/state-indicator/medicaid-to-medicare-fee-index/?currentTimeframe=0&sortModel=%7B%22colId%22:%22Location%22,%22sort%22:%22asc%22%7D
- Sheridan SL, Harris RP, Woolf SH, et al. Shared decision making about screening and chemoprevention. a suggested approach from the U.S. Preventive Services Task Force. Am J Prev Med. 2004;26(1):56–66.
- Volk RJ, Linder SK, Lopez-Olivo MA, et al. Patient decision aids for colorectal cancer screening: a systematic review and meta-analysis. Am J Prev Med. 2016;51(5):779–791.
- Jones RM, Devers KJ, Kuzel AJ, et al. Patient-reported barriers to colorectal cancer screening: a mixed-methods analysis. Am J Prev Med. 2010;38(5):508–516.