
Abstract
Background and objectives
As facilities are being prepared for the implementation of National Health Insurance (NHI) in South Africa, there is a pressing need to understand how the public equates the provision of health services at Primary Health Care (PHC) centres with monetary value. Accordingly, this exploratory study was designed to ascertain the willingness to pay (WTP) for public primary healthcare services in South Africa and to identify factors that influence the WTP.
Methods
The study was conducted in Cape Town, South Africa, among 453 persons presenting at two public primary health care centres, namely Bothasig Community Day Centre (CDC) and Goodwood CDC. The study used the contingent valuation range methodology. Descriptive statistics, multiple logistic and tobit regression analyses were conducted to assess demographics, socio-economic, and health access factors that influence WTP.
Results
Overall, 60% of participants were willing to pay for services offered at the PHC facilities. The average willingness to pay for all participants was 49.44 ZAR, with a median of 25 ZAR. The multiple logistic regression for grouped facilities showed unemployment, public transport, and the facility attended to be significant while public transport, facility visits, and facility attended were the only significant variables in the tobit model. There was less willingness to pay for those unemployed in comparison with students, those using public transport rather than walking, those frequenting the facilities more than first-time visitors and those attending Goodwood facility in comparison with Bothasig.
Conclusion
This study revealed factors related to the participants’ WTP and to their willingness to contribute towards the health service, though at very low amounts. Understanding the economic value placed upon a service provided in a facility is essential in decision-making for quality care improvements, especially as the South African health system is making the facilities ready for NHI.
JEL CLASSIFICATION CODES:
Introduction
South Africa’s health sector is a two-tier system with a public and private sector. Payment structures separate the two systems. The public sector’s primary health care (PHC) is based on a no-fee for service platform while government funds subsidize the secondary and tertiary services. However, private providers of health care are for-profit at all levels of care and require payment for services. These are mostly reimbursements in the form of pooled funds from medical insurance and a voluntary prepayment system for those who can afford it. The public health system caters for an estimated 84% of the population who do not have medical insuranceCitation1. As a result, public health facilities are under pressure to service most of the population with limited resources.
When it comes to health care systems in South Africa, willingness to pay (WTP) has often been discussed in the realm of private health care and only rarely in public health care due to the nature of the public health system that allows no fee at the point of service. The perceived disparities in the provision of care between public and private providers in terms of patient experience such as quality of care, waiting times, staff attitudes, and environmental comforts, have resulted in those who can afford it opt to invest in private health care through medical health insuranceCitation2–4.
The South African Government (SAG) has noted that the only way to achieve universal health coverage in the face of 29% unemployment ratesCitation5 and 84% uninsured citizensCitation1, is to offer no-fees at point of service for all levels through a National Health Insurance (NHI)Citation6. Solutions brought forward includes a mandatory NHI, which will see every person accessing adequate health care when needed without worrying about user-fees or out-of-pocket paymentsCitation6. The Competition Commission’s inquiry into the private healthcare sector identified the lack of a national system to monitor the quality of health care being offered to the public and the high costs of private health careCitation7, another motivator for the government’s proposed NHI. On the opposite side is a group advocating for their right to private healthcare for fear of what is seen as a failed public health systemCitation7. These clients are willing to pay for access to what they perceive as quality health care. The National Department of Health has, through its Health Establishment Service Delivery Improvement Plan, established a way to measure patient satisfaction with an emphasis on access to services; availability and use of medicines; patient safety; cleanliness and infection control; staff values and attitudes and waiting timeCitation8. The factors noted in measuring patient satisfaction are likely to affect their willingness to pay for services. There is a consensus that the quality of care in all forms needs improving if NHI is to succeedCitation6. The value of health care services can be more fully understood by clients when a monetary figure is applied. A survey by African Barometer found 41% of South Africans willing to pay user fees or higher taxes for health spending as a way to increase spending on public health careCitation9.
Evidence suggests that common factors associated with WTP for health care services include age, gender, marital status, education, household size, health status, treatment preferences, hospital visit or stay, satisfaction with the quality of care, perceptions of health care financing, distance from the facility, travel time, urban/rural setting amongst othersCitation10–13. Examples include WTP in MalaysiaCitation11 and NigerianCitation14, studies, which note the households with more educated heads or persons who had higher education were found to be more WTP. In Nigeria, Ogundeji et al.Citation14 report less WTP amongst those with post-secondary education for social health insurance. The effect of health status, specifically chronic illness, was explored in studies by Basaza et al.,Citation13 Babatunde et al.,Citation12 and OyakaleCitation15, and the results were contradictory. Studies in Hong Kong and Spain revealed that older people were less likely WTP for health services.
The objective of this study was to ascertain the willingness to pay towards PHC visits services in South Africa’s public sector. Furthermore, we aimed to identify factors associated with WTP.
Methods
Design
The study used the contingent valuation (CV) range methodology in eliciting the amounts participants would be willing to pay for health care. The contingent valuation method is well-grounded in economic theory, and using it for assessing health services makes it possible to review monetary value placed upon products/goods, services, and the trade-offs individuals or groups are willing to make, especially where no market existsCitation16. It allows the valuation of products/goods or services that may not previously exist by creating hypothetical markets and clarifying price estimates when there is uncertaintyCitation16. The researcher provides the participants with hypothetical questions and uses the responses to conclude their choices. Valuation is based on survey techniques such as bidding games, open-ended questions, and dichotomous choicesCitation17. We followed the range method used by Hanley et al.Citation18 which allowed for the participant to choose within a range rather than a point estimate. Their results showed participants to be more favorable to the range methodology; this was assumed to reduce hypothetical biasCitation19. The ex – post perspective was adopted as most participants were assumed to have experienced the service under review.
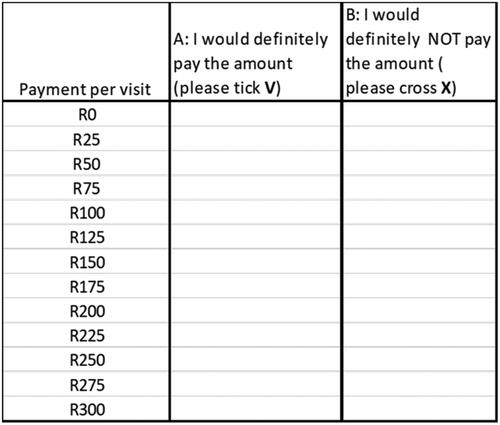
The researcher provided background information on the study, which included choosing the WTP amount per visit, assuming service improvements to the status quo in areas such as waiting time, confidentiality during treatment, staff attitude, availability of medication, and whatever they perceived needed improvement. The participants were then asked the following question, “How much are you definitely and definitely not willing to pay for the services in the facility which you requires?” The range method gives the participant a range of values to choose from for bounded ranges in pricing instead of open-ended questions and the dichotomous method. Two focus group discussions, one with six and the other with four participants were conducted for compiling a range of monetary values, including the highest and lowest number of which participants were willing to pay. The range of zero to 300 ZAR was ascertained and used in the questionnaire with 25 ZAR intervals. For more details, refer to Appendix 1. The SAG minimum wage for employees for the year 2020 was noted to be 20.76 ZAR per hour, which amounts to 3 566 ZAR per monthCitation20. During the period of data collection, which was the most convenient time for the facilities (September 2018), the exchange rate for 1 USD was 13.73 ZAR. The exchange with the 1 Euro was 16.54 ZAR. The threshold of 300 ZAR was 21.85 USD and 18.14 Euro. A pilot study was conducted to ascertain the reliability of the questionnaire before it was implemented in the full study. The participants were asked to rank the questionnaire from 1 (extremely easy) to 7 (extremely difficult), and 5 participants ranked it 4. Minor changes were made to allow for an easy understanding of some questions, and it was reiterated that the data collector should explain the task clearly. The main study was implemented thereafter. During the survey, patients were first asked to indicate how much they would definitely pay, starting with the lowest amount and stopping at the highest (refer to ). The next stage was to select from listed amounts those they were definitely not willing to pay.
Figure 1. Monetary range for participants to ascertain WTP ZAR (R, currency).
Additional characteristics of the participants were included in the questionnaire; these were demographic (gender, age, marital status), socio-economic factors (education and employment), health-related (facility visit, the reason for visit), and access factors (transport used, travel time, and residence).
Study population and data sampling
The study was conducted among persons presenting at two public health primary care facilities in Cape Town, South Africa, in 2018. The target population was clientele attending primary health facilities in the Community Day Centres (CDCs). A CDC is a primary health care center providing a range of ambulatory services including care for acute and chronic illnesses, preventive care such as immunizations, screening such as pap smears and tuberculosis symptom screening, and reproductive care such as family planning. The facilities have a Family Medicine doctor, but the system works in a way that one may only experience a nurse driven service (be treated by a clinical nurse) or be seen by a doctor. If medication is prescribed, the patient will see a pharmacist (but not for a consultation). As noted by Honda et al.Citation21 the South African PHC is mostly nurse-driven, although most patients would prefer to be treated by a doctor.
The WCG: Health service has six districts, of which one is metro (urban) and five rural. The metro has four sub-structures, each sub-divided into two sub-districts. For this study, the Northern-Tygerberg sub-structure was selected, comprised of the Northern and Tygerberg sub-districts, for conducting the focus group discussions. The study population and health facilities were identified through consultation with the Northern-Tygerberg sub-structure team, which was comprised of the sub-structure Director and Primary Health Care managers. The sample included participants who came from within an 8.2 km radius from Bothasig Community Day Centre (CDC) and of Goodwood CDC. Facilities were recruited through convenience sampling as recommended by local management to represent two facilities with different communities, to cover better generalizability of the study.
The facilities are meant to offer services to clients from the Bothasig and Goodwood area. According to Statistics South Africa (Stats S.A.), the total population of the two communities was approximately 62 075 in 2011, with 51% females and 49% malesCitation22. The number will have changed by now, and the next full census may reflect a new population. The figures discussed in the profile are all from the 2011 census from Statistics S.A. Bothasig residence has a 60.8% employment rate while Goodwood has 63.1% employed. The majority of the total population is English speaking (53%), followed by Afrikaans speakers (32%), and the remaining are Xhosa speakers and other languages. In terms of racial composition, Bothasig has 77% whites, 14% Colored (mixed race), 6% Blacks, and 3% other. Goodwood is comprised of 38% Colored, 38% Whites, 18% Blacks, and 6% other.
Convenience sampling was used to select participants who were aged 18 years and above. Trained university students were tasked with interviewing the participants. They students requested participation from to those waiting in the queue at for facility reception, or for consultation with either the nurse, doctor, or pharmacist. The study purpose and objectives were communicated, and consent was requested for participation; and only those who consented were enrolled. The participants were made aware of the option to stop participation at any time during the interview/study.
Ethical considerations
Ethics approval was given by the Health Research Ethics Committee of Stellenbosch University, Reference number S17/10/208. Approval was then sought from the Western Cape Government: Health’s Provincial Health Research Committee for facility access. The study adheres to the principles set out in the Declaration of Helsinki. The participants were not offered any financial incentives, and consent was sought before participation.
Data analysis
Data cleaning and analysis was done using Microsoft Excel and Stata. Participants below the age of 18 years and those who did not complete the WTP section were excluded. First, patient characteristics were analyzed using frequencies and chi2 analysis. The mean and median of WTP was then calculated and included the frequencies for the WTP and not WTP within the identified demographic and socio-economic factors. A range analysis was performed to evaluate the range of differences in WTP by the participants. This was followed by a bivariate analysis/cross tabular analysis with chi2 of possible factors associated with willingness to pay for service.
Furthermore, multiple regression models were conducted to assess the association between demographic, socio-economic, health-related, and access factors with WTP. First, univariable logistic regression analysis was applied using the dichotomous variable (WTP = 0 or WTP >0) as outcome to check for possible predictors for the WTP model. Significant variables obtained in this first step were then included in a multiple logistic regression analysis. The effects were expressed in terms of odds ratios with corresponding 95% confidence intervals (CI). Additionally, linear regression analysis was performed to assess the association of the aforementioned variables with WTP measured on a numerical scale. As a sensitivity analysis, a tobit regression was conducted using the numerical WTP variable as a dependent variable, assuming it is censored at a lower limit of 0, and the same independent variables. Tobit regression was used to replace linear regression analysis (marginal effects model), due to the large number of zero WTP responses. The tobit regression model is used when many dependent variables are true zeros chosen by the participants (not missing values), which would result in using OLSunsuitableCitation23. Using tobit regression allows for censoring of the true zero values. The corrected effect (estimated regression coefficient) is reported together with the 95% CI.
Results
Participants characteristics
The demographics showed a total of 462 participants included in the study. However, 13 ofthese were excluded from the study for incomplete questionnaires. Of the excluded participants, 9 (69%) were female, and 4 (31%) were male. In total, 449 participant responses were analyzed, of whom 60% were female, a breakdown similar to the excluded participants. The catchment area or geographic area of service showed the total population to be comprised of 51% females and 49% males, slightly different from the sample of 60% female and 40% male. Participants were predominantly in the youth category (as per the Statistics South African category), i.e. 18–34 years old. The smallest cohort was that of senior citizens (65 and above). A more significant number were married or in a partnership, followed by those who were single. Only 48% of the sample were employed. Most of the respondents in the sample studied up to Grade 12, the highest grade before starting university. includes all participants’ characteristics. The health-related characteristics showed a slight majority for facility visits that were one-off, and the majority of participants were frequent clients. In terms of access variables, 86% of the participants declared a 0–30 min’ travel time, suggesting that the facilities are serving participants within their geographic catchment areas.
Table 1. Characteristics of respondents.
Willingness to pay
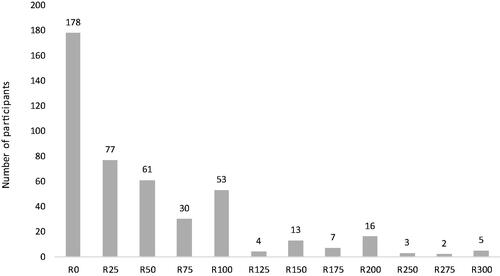
Of the overall participants, 60% were willing to pay for healthcare services. The mean (S.D.) that participants were willing to pay and not to pay was 49.44 ZAR (63.38) with a median of 25 ZAR. When considering only the willingness to pay participants, the mean WTP was 81.92 ZAR (63.21) and the median 50 ZAR. The highest amount for WTP was 300 ZAR and selected by 5 participants, which were the last listed amount on the 0–300 ZAR range of choices given to participants.
The nominal figures for the facilities showed that 74% of participants from Bothasig were willing to pay, while only 46% at Goodwood were willing to pay ().
Figure 2. Willingness to pay for access to primary health care, ZAR (R, currency).
The range observed was mostly a 25 ZAR difference (equivalent to the minimum difference between two levels) between amount people were definitely WTP and the amount they were definitely NWTP. For more details, refer to Appendix 2. Unaffordability was the major reason for not being willing to pay, followed by the sentiment that providing health carewas the government’s responsibility and poor service provision hindered the WTP. Some respondents decided not to provide the reason (12%), and some felt it was the government’s responsibility (19%) to provide the service. shows a bivariate analysis of WTP against demographics, socio-economic, health-related, and access factors.
Table 2. A Bivariate analysis of possible factors affecting willingness to pay for services.
Multiple logistic and tobit regression
Univariable logistic regression analyses revealed age, marital status employment, education, facility visit history, the reason for visit, transport, and the facility to be significantly associated with WTP. These significant variables were included in a multiple logistic regression model, which showed a good fit based on the Hosmer–Lemeshow goodness-of-fit test (p = .204).
The multiple logistic regression for each facility separately showed that only unemployment was significant at Goodwood CDC and public transport was the only significant variable at Bothasig CDC. For the Goodwood model, the unemployed were less likely to be willing to pay in comparison to students (OR 0.20, 95% CI 0.05–0.77). Bothasig CDC model showed that those using public transport were less likely to be willing to pay in comparison to those who walked to the facility (OR 0.35, 95% CI 0.13–0.97).
The analysis for grouped facilities using, the multiple logistic regression showed unemployment, public transport and the facility attended to be significant (refer to ). The unemployed were less likely to be willing to pay in comparison to students (OR 0.36, 95% CI 0.13–0.94). Those using public transport to reach the facility were less likely to be willing to pay compared to those walking (OR 0.47, 95% CI 0.25–0.86). Lastly, those attending Goodwood were less likely to be willing to pay compared to Bothasig attendees (OR 0.32, 95% CI 0.20–0.52).
Table 3. Multiple logistic regression modeling for willingness to pay (grouped facilities).
shows the tobit regression model results. Public transport, facility visits, and facility attended were the only significant variables in the tobit and linear regression models. Employment which was significant in the multiple logistic regression analysis took the same direction of a negative relationship for the unemployed and a positive relationship for the employed in comparison to students in the tobit regression analysis.
Table 4. Tobit regression modeling for willingness to pay (grouped facilities).
The WTP was − 29.32 ZAR (C.I 95%: −53.48 to −5.15) lower in those using of public transport than for those walking to the facility. The WTP was −24.67 ZAR (C.I 95%: −53.69 to 4.35) lower in those whose facility history ranged between 0 and 12 months and ZAR −23.51 (C.I 95%: −50.85 to 3.83) lower for more frequent users (more than 12 months) in comparison with the first-time visitors. Goodwood attendees WTP was lower by −31.40 ZAR (C.I 95%: −50.32 to −12.48) compared to those attending Bothasig.
Discussion
Decision-makers need to understand the value placed upon the services offered as this can also be a reflection of patient satisfaction and users’ preferencesCitation24. There are critical gaps in South Africa and Sub-Saharan Africa studies focusing on in WTP for public health facility visits, which could provide a greater understanding of patients’ perceived economic value on services. Stated preferences WTP studies for public health services are mostly on national and social health insuranceCitation10–13, a concentration on higher-level financing. This study explores the gap as it focusses on the WTP in public health facilities, which have no-fee at point of service policy, without pointing towards national health insurance. The study asked for WTP for a visit in general. WTP could potentially differ according to the type of services (preventive care or acute illness). There is a potential to do research work on individual services offered in the PHC environment.
The status of the health facilities and the health care system as a whole affects the individual WTP. Several studies have included factors similar to those this study in analyzing WTP, namely, socio-economic status and the existing health serviceCitation25. There was an expectation that most of the participants may not be WTP considering they were already seeking care at non-paying facilities as opposed to visiting private general practitioners. However, our results demonstrated that 60% of the participants were willing to pay for visits to a public health institution, assuming improvement in services offered at the facilities. This is an indication of how persons attach economic value to the service that has no charge at the moment of use. The findings are contrary to a larger population sample of 2400 surveyed by African Barometer, in which 41% of South Africans were willing to pay user fees or higher taxes for health spending as a way to increase spending on public health careCitation9. The latter alluded to mostly correlation between public perception, care experiences, and confidence in the government running the system. A DCE by Honda et al. in the Eastern and Western Cape provinces of South Africa, concluded that WTP increased with improvements in overall servicesCitation21. Studies on WTP for health services, mostly centered around national or social health insurances found more than half of the participants were willing to pay under different circumstancesCitation11,Citation13,Citation14,Citation26. The mean (49.44 ZAR) and median (25 ZAR) were low in comparison to the 300 ZAR private general practitioners’ fees being charged in the same communities during the data collection period. It becomes an issue of affordability or refusal to pay for unsatisfactory service in the facility provided services.
Considering that 52% of the participants were students and unemployed, it is reasonable that the mean and median WTP is very low. The population of 2011 showed an employment rate of approximately 60% employment rate in the community under assessment. It is plausible that the students and unemployed were overrepresented due to the no-fee service offered at PHCs by the government. Some of the participants, who were not WTP (18.5%), stated that government responsibility was the reason. There is a possibility this sentiment may be gaining tractionCitation2 since the beginning of NHI policy discussion, taking into consideration the Governments’ commitment to providing health for a long and healthy life for all South African in the National Development Plan (2030)Citation27.
Our study explored the use of multiple logistic (MLRM) and tobit regression modeling (TRM). The results from both models were similar, with only a few differences giving us confidence in both methodologies. The MLRM found unemployment to be significant contrary to the TRM. However, they were both similar in direction, a negative sign. Being unemployed resulted in a lower willingness to pay in comparison with students and employed counterparts. This result aligns with economic theory and evidence, which notes that lack of income results in diminished ability to pay and the possibility of lower WTP. A study in Nigeria found employed women more willing to pay than the unemployed when seeking maternal health careCitation28. Using employment as a proxy for income, the findings were contrary to a study in South Sudan by Bosaza et al., where income was not significantCitation13. A study in Nigeria found income and WTP for social health insurance to be positively associatedCitation14.
The mode of transport used by participants correlates with WTP in both models, with those using public transport having a lower WTP than did other transport types. Transport type and distance traveled is a key component to accessing health care and has been used to determine the location of healthcare facilities in South Africa. This influences the National Department of Health’s norm of having a facility with a maximum of 5 km radius or at most 2–5 km walking distance of the communityCitation3. The World Health Organisation rightfully notes that a fully capacitated health facility should be supported by access in its catchment area, and consider logistical constraintsCitation29. Most of the reviewed studies on WTP did not include this variable except in SudanCitation13, which used a similar variable of distance to the facility. The majority of participants walked, suggesting their proximity to the facilities, as noted in their sub-district. The catchment areas for the facilities include Northern and Tygerberg sub-districts as per the structuring of the district health service in the Western Cape Province. According to the findings, the majority of the participants (82%) resided in the sub-districts mentioned above. However, 18% of the participants resided in the Western sub-district, not considered a catchment area for the CDCs. Therefore, we can assume their willingness to travel and pay for transport to access health services at the CDCs under study.
Furthermore, there was a negative relationship between WTP, and the facility attended in the MLRM and TRM. Those attending Goodwood were less likely to be willing to pay in comparison with the Bothasig CDC attendees. This is despite Goodwood having a higher employment rate than Bothasig suburbsCitation22. A perusal of the facilities showed that Bothasig has better infrastructure given the recent upgrades, lower waiting times due to fewer clients, and is situated in a more affluent area compared to Goodwood. The population in Bothasig was 11,790 compared to Goodwood’s 50,285, according to the 2011 censusCitation22.
The TRM findings also showed the number of facility visits to be a significant factor of in WTP. Those who visited the facility frequently were less willing to pay in comparison to the first-time visitor. The same finding is seen in Nigerian studies, which concentrated on national health insurancesCitation12,Citation15 It is plausible that experience at the facility affected the perceptions of frequenters.
Age, gender, marital status, education, health status (chronic/once-off visit), facility visits, and travel time were found to be insignificant in this study. The finding on education contradicted MalaysianCitation11, and NigerianCitation14 studies. The effect of health status, specifically, chronic illness, was found to be insignificant by Basaza et alCitation13. and Oyakale,Citation15 whereas Babatunde et alCitation12. found it to affect WTP. The same applied to age with the studies noted. A study in Hong Kong and Spain revealed that older people were less WTPCitation24,Citation30. This is most likely due to most people becoming less active economically the older they become. Findings in a study in BangladeshCitation31 demonstrated that the more educated one becomes, the more likely one is willing to pay to ensure good health, contrast to Nigeria, where Ogundeji et alCitation14. report that those with post-secondary education are less WTP for social health insurance. The results from other studies also appear to be context-driven and do not necessarily follow the same direction.
The use of the range method in evaluating WTP raises questions about, ‘the measurement and management of WTP ranges and the relevant theoretical foundations’Citation32. This study used the range methodology to limit the possible, realistic amounts and avoid having too many outliers. The amounts used as the upper range were the going fees for a consultation with a general practitioner in the respective communities at the time of the study. WTP studies are affected by problems which include compliance bias related to participants wanting to please the interviewers by choosing low or high WTP valuesCitation25,Citation26, outliers, and too many zero responses, even, when they are provided with a starting and ending bid. Other possible problems include strategic bias where there is a misrepresentation to influence the final resultCitation33, and hypothetical bias where there is uncertainty in the value of the goods, resulting in over-valuation of the goodsCitation34. The range method was, however, not very successful in this study, as most participants selected the next amount for non-willing to pay. The study showed that 60% of the participants chose above zero, and a few chose the ending bid, which gives us the confidence less or no compliance bias. Thus, the use of TRM for left-censoring the zero responses allowed for better estimation. There seems to be no standard way of analyzing and reporting results in WTP, as some studies use one or more models to find the best model estimation.
It would be worthwhile to expand the research with a bigger sample to evaluate the WTP as a proxy for contributing towards the NHI. The medical scheme membership increased by 2% annually from 2006 to 2014Citation35. The increase has been ascribed to the growth in the Government Employees Medical Scheme (GEMS). It is also an indication of increased WTP for health services though at a lower per capita rate. During the years 2015 to and 2019, there was negative economic growth and an increase in unemployment (24.5% in 2015 to 29.1% in 2019)Citation35.
Moreover, inflation in medical insurance contributions has continuously surpassed the consumer price index, which was 4.9% and 1.5% above the consumer price index (CPI) in 2017 and 2018, respectively. It can only be assumed that the medical insurance drop-outs end up in the public health system. There has been an increasing emergence of South Africans using the private sector for PHC and gravitating towards public health service provision for specialized servicesCitation21, which are heavily subsidized by the government. A study in South Africa revealed that some participants without medical insurance saw the benefits of the NHICitation2 and similarly felt it would reduce poverty within their households. The private sector is perceived to offer quality health careCitation36 because users pay and are under the impression, they get value for money. It begs the question, would public PHCs be perceived to operate in a satisfactory manner if one was to make a monetary contribution towards NHI service, and would clients feel they are treated any better than the current status quo. Not with-standing that the public health system would raise much-needed revenue at point-of-service.
A study in Vietnam on WTP for health insurance recommended using public sensitization, following their discovery that lack of information correlates to negative attitudes towards possible monetary contributionsCitation25. The lack of public knowledge of the possible benefits of contributions may influence the attitude towards any form of contribution, be it a fee per visit or a tax deduction for national health insurance. In a South African study, most participants did not fully understand NHI and the standard payment mechanisms for health care receivedCitation37. The reasons expressed by public servants in Juba City, South Sudan, revealed their WTP for health insurance resulted from understanding the benefits like “cost-sharing, development of healthcare infrastructure, risk protection, and reduction of poverty”Citation13.
There are potential limitations to this study. First, the study did not explore the association between WTP and the improvement of services. This aspect was in the Discrete Choice Experiment (DCE) part of the study, which will be analyzed separately. Second, using employment as a proxy for affordability may have restricted us from being able to have meaningful comparisons with other studies that elicited actual amounts of income from participants. The questionnaire did not include income in the socio-economic questions. The decision not to include income came from the expectation that most of the participants may not be employed and we wanted to avoid causing discomfort amongst participants. Self-reported income is likely to be inaccurate, flawed, and plagued with non-response resulting in errors in measurementCitation38–40. The study concentrated on understanding willingness to pay rather than the ability to pay. The lack of similar studies using the revealed preference methodology in private and public health care limited the ability to compare the stated preference WTP monetary values provided by participants within South Africa. Thirdly, the study was conducted in the same sub-district and is context-specific to participants in that geographical area, which limits the generalizability unless replicated across other similar population/economic groups. Furthermore, that characteristics of participants who declined were not systematically collected and we were not able to do a comparison with those who participated. It would be valuable to replicate the study in other provinces within the country to fully understand the magnitude of the population’s willingness to pay. However, some other countries with similar patients and healthcare system characteristics could have similar findings.
Conclusion
In summary, the study reflects that about 60% of the participants are willing to pay an average of ZAR 49.44 amongst primary care attendees show the economic value placed upon the public health facilities. However, the average amount is very low. Factors influencing the willingness to pay included employment, the facility providing care, the mode of transport, and the frequency of facility visits. Understanding the value placed upon a service provided in a facility is essential in decision-making for improving the quality of care, especially now when the South African health system is making the facilities ready for NHI.
Transparency
Declaration of funding
The study was self-funded, and no sponsors were involved.
Declaration of financial/other relationships
The authors have no relevant affiliations or financial involvement with any organization or entity with a financial interest in or financial conflict with the subject matter or materials discussed in the manuscript. This includes employment, consultancies, honoraria, stock ownership or options, expert testimony, grants or patents received or pending, or royalties.
Author contributions
Study design: P. Chiwire, S. M. Evers, H. Mahomed and M. Hiligsmann; Data analysis: P. Chiwire; Data interpretation: P. Chiwire, S. M. Evers, H. Mahomed and M. Hiligsmann; Manuscript drafting: P. Chiwire; Manuscript review and approval: P. Chiwire, S. M. Evers, H. Mahomed and M. Hiligsmann.
Acknowledgements
The authors would like to thank the Western Cape Government: Health for allowing us access to the facilities. Secondly, the facility managers at the two sites for data collection made easy. We would like to acknowledge the Statistician Assistant Professor Bjorn Winkens from Maastricht University and Nesbert Zinyakatira, University of Cape Town for providing advice.
References
- Republic of South Africa National Department of Health. Socio-economic impact assessment system (SEIAS) initial impact assessment: National Health Insurance fund. Pretoria; 2017.
- Booysen F, Hongoro C. Perceptions of and support for national health insurance in South Africa’s public and private healthcare sectors. Pan Afr Med J. 2018;30:277.
- Burger R, Christian C. Access to health care in post-apartheid South Africa: availability, affordability, acceptability. Heal Econ Policy Law. 2020;15(1):43–55.
- Harris RD, Marks WM, Settings L. Compact ultrasound for improving maternal and perinatal care in low-resource settings: review of the potential benefits, implementation challenges, and public health issues. J Ultrasound Med. 2009;28(8):1067–1076.
- Statistics South Africa. Quarterly Labour Force Survey (QLFS) Quarter 3 2019. 2019. [cited 2020 Jan 21]. Available from: http://www.statssa.gov.za/?s=unemployment.rate&sitem=statisticsbytheme
- Republic of South Africa National Department of Health. White Paper for National Health Insurance for South Africa. 2015. [cited 2020 January 21]. Available from: https://www.gov.za/sites/default/files/gcis_document/201512/39506gon1230.pdf
- Competition Commission. Health Market Inquiry: provisional findings and recommendations. 2018. [cited 2020 March 6]. Available from: http://www.compcom.co.za/wp-content/uploads/2020/01/Final-Findings-and-recommendations-report-Health-Market-Inquiry.pdf
- Republic of South Africa National Department of Health. National Guideline on conducting patient experience of care survey in public health establishments. 2017. [cited 2020 March 6]. Available from: http://www.health.gov.za/index.php/2014-08-15-12-53-24?download=2665.pec-survey-14-feb-2018-w
- Isbell T. Are Africans willing to pay higher taxes or user fees for better health care? Afrobarometer. 2016;37:1–18.
- Ataguba J, Ichoku EH, Fonta W. Estimating the willingness to pay for community healthcare insurance in rural Nigeria. 2008. [cited 2020 March 16]. Available from: https://ssrn.com/abstract=3171544.
- Azhar A, Rahman MM, Arif MT. Willingness to pay for health insurance in Sarawak, Malaysia: a contingent valuation method. Bangladesh J Med Sci. 2018;17(2):230–237.
- Babatunde OA, Akande TM, Salaudeen AG, et al. Willingness to pay for community health insurance and its determinants among household heads in rural communities in north-central Nigeria. Int Rev Soc Sci Humanit. 2014;2:133–142.
- Basaza R, Alier PK, Kirabira P, et al. Willingness to pay for National Health Insurance Fund among public servants in Juba City, South Sudan: a contingent evaluation. Int J Equity Health. 2017;16(1):110–158.
- Ogundeji YK, Akomolafe B, Ohiri K, et al. Factors influencing willingness and ability to pay for social health insurance in Nigeria. PLOS One. 2019;14(8):e0220558.
- Oyekale AS. Factors influencing households’ willingness to pay for National Health Insurance Scheme (NHIS) in Osun State, Nigeria. Stud Ethno-Med. 2012;6(3):167–172.
- Carson RT. Contingent valuation: a practical alternative when prices aren’t available. J Econ Perspect. 2012;26(4):27–42.
- Klose K, Kreimeier S, Tangermann U, et al. Patient- and person-reports on healthcare: preferences, outcomes, experiences, and satisfaction – an essay. Health Econ Rev. 2016;6(1):11–18.
- Hanley N, Kriström B, Shogren JF. Coherent Arbitrariness: on value uncertainty for environmental goods. Land Econ. 2009;85(1):41–50.
- Akter S, Bennett J. Preference uncertainty in stated preference studies: facts and artefacts. Appl Econ. 2013;45(15):2107–2115.
- Republic of South Africa Labour Department. Employment and Labour on new National Minimum Wage rate. 2020. [cited 2020 March 21]. Available from: https://www.gov.za/speeches/new-nmw-base-rate-come-effect-march-–-department-employment-and-labour-24-feb-2020-0000#:∼:text=
- Honda A, Ryan M, Van Niekerk R, et al. Improving the public health sector in South Africa: eliciting public preferences using a Discrete Choice Experiment. Health Policy Plan. 2015;30(5):600–611.
- Statistics South Africa. 2011 Census. 2011. [cited 2020 August 19]. Available from: http://www.statssa.gov.za/?page_id=3955.
- Amore MD, Murtinu S. Tobit models in strategy research: critical issues and applications. Glob Strateg J. 2019. DOI:https://doi.org/10.1002/gsj.1363
- Liu S, Yam CHK, Huang OHY, et al. Willingness to pay for private primary care services in Hong Kong: are elderly ready to move from the public sector? Health Policy Plan. 2013;28(7):717–729.
- Nosratnejad S, Rashidian A, Dror DM. Systematic review of willingness to pay for health insurance in low- and middle-income countries. PLoSOne. 2016;11(6):e0157470.
- Lofgren C, Thanh NX, Chuc NTK, et al. People’ s willingness to pay for health insurance in rural Vietnam. BioMed Cent. 2008;16:1–16.
- South Africa’s National Planning Commission. National Development Plan 2030 our future-make it work. 2012. [cited 2020 April 9]. Available from: https://www.gov.za/sites/default/files/gcis_document/201409/ndp-2030-our-future-make-it-workr.pdf
- Yahya MB, Pumpaibool T. Factors affecting women-willingness to pay for maternal, neonatal and child health services (MNCH) in Gombe State, Nigeria. J Women’s Heal Care. 2017;06:404.
- World Health Organization. Monitoring the building blocks of health systems: a handbook of indicators and their measurement strategies. Geneva: World Health Organization; 2010.
- Martín-Fernández J, del Cura-González MI, Rodríguez-Martínez G, et al. Economic valuation of health care services in Public Health Systems: a study about willingness to pay (WTP) for nursing consultations. PLoS One. 2013;8(4):e62840.
- Pavel S, Chakrabarty S, Gow J. Assessing willingness to pay for health care quality improvements. BMC Health Serv Res. 2015;15:43.
- Dost F, Wilken R. Measuring willingness to pay as a range, revisited: when should we care? Int J Res Mark. 2012;29(2):148–166.
- Throsby CD, Withers GA. Strategic bias and demand for public goods- theory and an application to the arts. J Public Econ. 1986;30(3):307–327.
- Bobinac A. Mitigating hypothetical bias in willingness to pay studies: post-estimation uncertainty and anchoring on irrelevant information. Eur J Health Econ. 2019;20(1):75–82.
- Council for Medical Schemes. Annual Report 2017–2018. 2018 [cited 2020. March 29]. Available from: https://www.medicalschemes.com/files/Annual%20Reports/CMS_AnnualReport2017-2018.pdf.
- Maseko L, Harris B. People-centeredness in health system reform- public perceptions of private and public hospitals in South Africa. S Afr j Occup Ther. 2018;48(1):22–27.
- Setswe G, Nyasulu P, Witthuhn J. Do South Africans really understand the National Health Insurance scheme? A survey of adults in three provinces. African J Phys Heal Educ Recreat Danc. 2014;S1:221–233.
- Geisen E, Strohm C, Stringer MC, et al. Examining the relationship between the accuracy of self-reported data and the availability of respondent financial records. 2003. [cited 2020 August 7]. Available from: https://www.rti.org/sites/default/files/resources/aapor12_geisen_paper.pdf.
- Cookson R. Willingness to pay methods in health care: a sceptical view. Health Econ. 2003;12(11):891–894.
- Moore J, Stinson L, Welniak E. Income measurement error in surveys: a review. J off Stat. 2000;16(4):331–362.
Appendices
Appendix 1. Questionnaire for willingness to pay
Questionnaire: Part 2 related to WTP questions
Part 2: Are questions relating to your willingness to pay on given alternative
You shall be given option to choose the WTP amount per visit, assuming improvements to the status quo in areas such as waiting time, confidentiality during treatment, staff attitude, availability of medication, and whatever they perceived needed improvement.
Part 2: Willingness to Pay
1) Please indicate how much you would definitely pay and how much you would definitely not pay for services in the facility
Instructions
You should start with column A and R0. If you are definitely willing to pay R0, then tick a V. Then go to R25, R50 until you are not willing to pay. Put an V at every amount that you are willing to pay.
Then, move to column B and start with the last row (R300). If you are definitely not willing to pay 300 then cross X; then move to 275. Put an X at every amount that you are not willing to pay. Remember to start from the last row (R300).
NB: Make sure you either have a V only or X in one row. You cannot have both X and V next to the same amount
2) NB: Only if you do not tick in column A or you ticked only R0, give a reason why you are not willing to pay
………………………………………………………………………………………………………………………………………………………………………………………………………
NB: It was orally explained to the participants that the WTP should be decided with the assumption of improvements to the status quo i.e. how much one is willing to pay if the service is improved.
Appendix 2: The range between definitely willing to pay and definitely not willing to pay