
Abstract
Multimorbidity is a defining challenge for health systems and requires coordination of care delivery and care management. Care management is a clinical service designed to remotely engage patients between visits and after discharge in order to support self-management of chronic and emergent conditions, encourage increased use of scheduled care and address the use of unscheduled care. Care management can be provided using digital technology - digital care management. A robust methodology to assess digital care management, or any traditional or digital primary care intervention aimed at longitudinal management of multimorbidity, does not exist outside of randomized controlled trials (RCTs). RCTs are not always generalizable and are also not feasible for most healthcare organizations. We describe here a novel and pragmatic methodology for the evaluation of digital care management that is generalizable to any longitudinal intervention for multimorbidity irrespective of its mode of delivery. This methodology implements propensity matching with bootstrapping to address some of the major challenges in evaluation including identification of robust outcome measures, selection of an appropriate control population, small sample sizes with class imbalances, and limitations of RCTs. We apply this methodology to the evaluation of digital care management at a U.S. payor and demonstrate a 9% reduction in ER utilization, a 17% reduction in inpatient admissions, and a 29% increase in the utilization of preventive medicine services. From these utilization outcomes, we drive forward an estimated cost saving that is specific to a single payor's payment structure for the study time period of $641 per-member-per-month at 3 months. We compare these results to those derived from existing observational approaches, 1:1 and 1:n propensity matching, and discuss the circumstances in which our methodology has advantages over existing techniques. Whilst our methodology focuses on cost and utilization and is applied in the U.S. context, it is applicable to other outcomes such as Patient Reported Outcome Measures (PROMS) or clinical biometrics and can be used in other health system contexts where the challenge of multimorbidity is prevalent.
Introduction
Multimorbidity is a defining challenge for all health systemsCitation1,Citation2. In the United States, where multimorbidity is “the Most Common Chronic ConditionCitation3,” the health system remains individual disease focusedCitation4. The American Geriatrics Society, The American College of Cardiology, and the United Kingdom’s National Institute for Health and Care Excellence advocate for longitudinal models of care with a supportive relationship spanning a patient’s clinical needs as a core tenet. To meet the needs of multimorbid patients, health plans in the United States, national health systems and risk bearing providers globally currently deploy care management for patients with multiple long-term conditionsCitation5,Citation6. Care management is defined as a clinical service, delivered by payers, providers, or national health systems that remotely engages patients between visits and after discharge in order to promote and assist in self-management of chronic and emergent conditions, encourage increased use of scheduled care and preventive services and reduce the use of unscheduled careCitation7. The use of digital technology to improve clinical processes through the use of cloud computing, mobile computing, internet connected devices and machine learning is increasing and has become known as Digital HealthCitation8. One of the benefits of Digital Health is that it has the potential to drastically reduce the cost of care delivery, meaning that care can be offered to more peopleCitation9. Digital Health has been used in disease management and has been shown to be feasible and associated with incremental cost impact and in care management – digital care managementCitation10–14.
However, does digital care management actually workCitation15? We have identified several major challenges in answering this question and we propose a new methodology by which to address these challenges. The key challenges are as follows: the choice of appropriate and robust outcome metrics, identification of a causal pathway, limitations of randomized control trials (RCT), identification of a comparative control populationCitation16, and small sample sizes in early evaluations ().
Table 1. Challenges in evaluating digital care management.
These concerns are not unique to digital care management but are representative of the challenges in evaluating longitudinal primary care interventions in the context of multimorbidityCitation17. Evaluation of the clinical impact of interventions for a single condition with known risk factors and clinical endpoints and without comorbidities is well established. The generalizability of these methods and results to multimorbid patients who are the principal drivers of demand in health systems, however, is not clearCitation3. Furthermore, health plans in the United States, national health systems and risk bearing provider organizations globally are faced with resource allocation decisions between competing interventions for multimorbidity. In making these decisions there are a variety of outcomes of interest including Patient Reported Outcome Measures (PROMS) and clinical biometrics, however as all health systems are moving to a value based orientation, cost is the common denominator in the pragmatic value calculus that clinical and financial decision makers faceCitation18,Citation19. There are concerns regarding the inherent bias in cost as an outcome measureCitation20 and the influence of contracting variability between different provider organizations reducing the ability to compare effectiveness between sites in terms of cost impact. In addition, cost is typically evaluated using a one-armed pre-post evaluation for the intervention group where the influence of regression to the mean cannot be excluded or a two-armed difference-in-difference approachCitation21,Citation22, where cost after receiving an intervention is compared to cost prior to receiving an intervention for a group of matched controls where the influence of unknown confounders cannot be excluded. This undermines the utility of evaluations of digital care management or other longitudinal supportive primary care interventions in the context of multimorbidity.
RCTs are considered the gold standard for examining the effectiveness of health interventionsCitation23–25 as they allow the influence of known and unknown confounders to be controlled for. A recent RCT of care management of “hot spotters”Citation26 revealed no impact, contrary to previous observational assessmentsCitation27. Shortly afterwards, another RCT revealed a positive impact on utilizationCitation28. While these findings could be explained by differences in the risk profile of the population involved in the studies, there are three concerns that limit the broader applicability of RCTs outside of the research context. First, the cost of conducting an RCT is prohibitive for routine use. Second, generalizability of RCT findings beyond the research setting remains a concernCitation29–31. Third, non-treatment is not necessarily appropriate if diseases urge treatment or development of a chronic disease(s) needs to be preventedCitation16.
A widely-used alternative to RCTs is observational studies, which have been conducted to establish the real world impact of drugsCitation32,Citation33, particularly with respect to healthcare costs. To identify a proper control population, observational studies typically employ a technique called propensity matchingCitation34–36. Propensity matching is a technique in which a “propensity score” is assigned to every individual who received an intervention as well as all candidate control individuals. This score indicates the likelihood (on a scale from 0 to 1) that an individual received the intervention, based on a set of features chosen by the experimenters. These features are chosen for two reasons: they may influence an individual’s likelihood to receive the intervention (e.g. extent of pre-intervention healthcare utilization or having a smartphone if the intervention is digital) and they may influence an individual’s likelihood to benefit from the intervention where “benefit” is defined by the experimenter (e.g. having an earlier stage of an index disease with fewer complications or at the other end of the spectrum, having a terminal illness may hinder an individual from benefitting in the sense of cost reduction). For digital care management, the specific mechanism of action is not known ex-ante. Additionally, there may be factors such as individuals’ internal motivation that impact health outcomes and can never be observed and measured. These issues pose major challenges for propensity matching as it is not possible to identify all of the factors that may both impact likelihood to receive and likelihood to benefit from an intervention.
A final major challenge in the evaluation of digital care management is that it tends to be implemented at a small scale initially and then expanded more broadly as feasibility, efficacy and value are establishedCitation37. In initial small-scale deployments large class imbalances are typically seen where each member of the intervention population may have tens or even hundreds of potential matches in the control population. While there are methods for dealing with such imbalances such as 1:n propensity matching rather than 1:1, n control individuals matched to a single intervention individual are still likely to be very different from each other due to unobserved variables that cannot be matched on. For example, if there are n control individuals with the same propensity score as a single intervention individual, and one of these control individuals is randomly chosen for the final comparison, the results could be highly different if a different one of the n match candidates had been chosen at random due to unobserved influences. In the near term, such class imbalance is an issue for digital care management where the vast majority of patients will still be managed using conventional means.
While taking the aforementioned challenges into consideration, we propose a pragmatic methodology for adapting the observational study approach and applying it to digital care management in a manner that can be replicated by health plans, national health systems and providers without the need for external research funding and repeated as program and population parameters necessarily change. In this methodology known confounders such as pre intervention co-morbidities and healthcare utilization are controlled for through propensity matching. However, as there is uncertainty over the precise values of unknown confounders such as social determinants of health or a patient’s preference for a specific mode of clinical intervention that are not always captured in available healthcare data, the methodology involves randomization through bootstrapping to control for their influence.
The method involved is applicable to the relatively small intervention populations that are typical of initial digital care management implementations (<5000 patients) but is extensible to much larger populations. To illustrate the method we apply it to a payor’s implementation of the Wellframe digital care management platform which consists of an app that includes a customized, interactive, daily health checklist displayed to patients on their smartphone or tablet as an augmentation to outpatient care. Responses and interactions from users are collected as actionable day-to-day-health information. The app serves to provide a sustained and supportive portal of communication between patients and their care teams. A built-in concierge service helps patients pursue their health goals, get their benefits questions answered and navigate the healthcare system - all through a single, direct channel of communication. The intervention population was onboarded onto the Wellframe digital care management platform and both patients and clinical teams received training on how to use all of its features.
We compare our methodology to traditional 1:1 propensity matching as well as 1:n propensity matching to demonstrate the increased stability of results with our method as a population grows larger over time, as well as with different sets of matching variables to demonstrate the stability of our results with more limited data.
Methods
We describe a general methodology for evaluating digital health platforms in care management for multimorbid populations (). These steps do not necessarily need to be performed in the order stated and can be logically grouped together. We apply this methodology to a specific implementation of the intervention with one health plan. Health insurance claims data were used from a commercially insured population. These data did not include zip code or patient address. The featured evaluation uses the methods proposed herein to demonstrate utilization and estimated cost outcomes in a group of individuals who received the digital care management intervention compared to a population that was deemed eligible for receiving care management but did not actually receive any intervention. Cost outcomes were calculated using allowed amounts from medical claims. When deriving utilization metrics, all non-inpatient medical claims, including outpatient and professional, were deemed as 'outpatient’.
Table 2. General framework for evaluating digital care management for multimorbid populations.
Define groups and time frame
Intervention group
Individuals were chosen to be included in the intervention group for our analysis if they met the following criteria:
Were deemed “complex” or “chronic” by the health plan according to criteria determined by The National Committee for Quality Assurance (NCQA). These were patients that the health plan had determined should be offered care management.
Had at least 12 months of medical claims data available preceding the day that they started the digital intervention (pre-intervention period).
Had at least 3 months of medical claims data available following the day that they started the digital intervention (post-intervention period).
Started the digital care management intervention between the dates 01/01/2018 and 07/30/2019.
Control group
Individuals were chosen to be included in the control group for our analysis if they met the following criteria:
Were deemed “complex” or “chronic” by the health plan according to criteria determine by The National Committee for Quality Assurance (NCQA). These were patients that the health plan had determined should be offered care management.
Had at least 12 months of medical claims data available preceding the day that they were deemed eligible for care management (pre-intervention period).
Had at least 3 months of medical claims data available following the day that they were deemed eligible for care management (post-intervention period).
Were first deemed eligible for care management between the dates 07/01/2018 and 04/30/2019.
Never engaged with care management (either in the study period or in the preceding 2 years).
A pre-intervention timeline of twelve months was chosen to capture a full-year cycle of members’ healthcare utilization to ensure that matching was conducted on holistic patient profiles, given the periodicity in certain types of utilization. A post-intervention timeline of three months was chosen because the typical length of engagement with care management in the chronic and complex populations is thirty to ninety days. We follow an intent-to-treat model for evaluation, and while all members of the intervention population demonstrated some level of engagement with the platform, a threshold was not specified for inclusion.
Randomized propensity matching
Define matching variables
Variables on which to match the intervention and control groups were chosen using a combination of input from clinical experts and examples from the literatureCitation33,Citation36,Citation39. Internal knowledge from the health plan was also valuable in understanding how members were deemed “chronic” or “complex” based on their diagnostic and utilization profiles. Propensity matching variables were chosen for two reasons. The first was that a variable may affect an individual’s likelihood to benefit from the intervention, and the second is that it may affect the individual’s likelihood to receive the intervention. Diagnostic variables such as the presence of a disease were chosen as they can have a strong impact on outcomes. The conditions listed are common in chronic and complex care management populations and are often associated with high costs.
It is well known that the chronic diseases that are prevalent in patients with multimorbidity have complex underlying mechanisms and have systemic effects and associations with other comorbidities. As such, for example, each patient with COPD is not the sameCitation40. For this reason clinical utilization variables were chosen as a proxy for disease severity, and also as proxy measures for self-efficacy. For example, utilization of preventive outpatient services can be viewed as a surrogate for an individual’s likelihood of engaging with other preventive services, and may affect whether or not that individual was willing to download and use a digital health app. The final set of matching variables was therefore age, gender, the presence or absence of all chronic conditions listed in , and the number of monthly pre-intervention visits (assessed over the full year prior to becoming eligible for the intervention) for: all inpatient visits, all ER visits, all outpatient preventive visits, and all other outpatient office visits.
Propensity matching
Propensity matching is performed using the variables listed above for the intervention group and the control group. This is an established technique that implements logistic regression to produce a likelihood value that a single individual came from the intervention groupCitation41,Citation42. All features chosen for matching are entered into the logistic regression model, and each individual in the population receives a propensity score. For each member of the intervention group, the member of the control group with the closest score is chosen using a method called nearest-neighbor (NN) caliper matchingCitation35,Citation43. The caliper, a number ranging from 0 to 1, can be adjusted for a more conservative or more liberal matching approach, with smaller values enforcing stricter matching requirementsCitation44. If there is more than one control member with the closest propensity score to a given intervention member, one of these controls is chosen at random. If a member of the intervention group cannot be matched to a member of the control population within the caliper distance, then that member of the intervention group is considered unmatchable and discarded from the analysis. The groups are matched one-to-one, resulting in two groups of the same size that are matched on propensity score.
Randomization
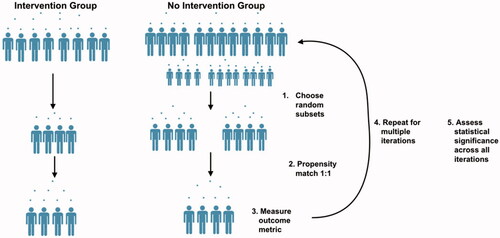
As alluded to above, it is often the case that a single intervention member has many “best matches” in the control population as the control population is significantly larger. To account for the large class imbalance and the inability to observe many variables that may impact an individual’s likelihood to receive the intervention, we perform a bootstrapped version of propensity matching. At each iteration of the randomization, a random subset of the intervention population and a random subset of the control population that is a factor larger than the intervention subset is chosen. From this subset, 1:1 propensity matching is performed. Propensity matching is validated by ensuring the standardized difference of the means is less than 0.2 between the two groups for each variable, at each iterationCitation35. This is performed for 100 iterations and the identifiers of the matched controls at each iteration is stored. For the case study included here, 1,000 members of the intervention population and 5,000 members of the control population were randomly selected at each iteration. The analyses were also conducted using random intervention subsamples of 500 and 800, as well as 500 and 1,000 iterations and results were unchanged from those shown below. This process is illustrated in .
Figure 1. Illustrative example of the randomized propensity matching technique.
Outcome assessment
Post-intervention average monthly utilization of inpatient, outpatient preventive, other outpatient visits, and emergency room (ER) services were selected as outcome metrics. At each iteration of the randomization process, the number of visits over the three months post-intervention (or post-eligibility date for the control population) in each category is counted across all individuals used in that iteration of matching in each group separately. After all iterations are performed, the number of visits across all iterations is compared between the intervention and control groups with a t-test to determine whether there is a significant difference between the means for the two groups.
While our primary outcomes are utilization metrics, our methodology allows for estimate cost impact to be assessed as well. We take the approach of estimating cost from a utilization-based starting point and then working backwards from these results which are less noisy than raw cost data as it allows for more robust reporting of cost data over time and is less sensitive to the nuances of changing health plan payment structures. For each of the four utilization categories assessed in our case study, the median cost-per-visit is derived from the health plan’s claims data comprising the study period. These values are then multiplied by utilization rates in each group:
Formula 1
Estimated Inpatient Spending per 1,000 Members = Median cost per day of stay * Average LOS *Number of Visits per 1,000 members
Formula 2
Estimated Non-Inpatient Spending per 1,000 Members = Median cost per utilization * Number of Visits per 1,000 members
Comparison to existing matching methods
To demonstrate the stability of our method over time as more members are introduced into a study population, we compare our method’s performance to existing methods’ performances over time. We chose three cut-off time points that were spaced apart by six months each. For each of these time points, we assessed the aforementioned outcomes using 1:1 propensity matching, 1:5 propensity matching, and our bootstrapped propensity matching method. We assessed whether results were significant at each time point, and how results changed over time within each method.
Results
Population demographics and propensity matching
shows demographics for the intervention and control populations at baseline (prior to matching), and for three different iterations of the random matching. In the intervention population, members had an average of 122 touchpoints within the digital care management platform over the 90 days following their enrollment. These touchpoints were comprised of both in-app messages with a clinical care management staff member and condition-related tasks included in the platform such as surveys, articles, and medication reminders. depicts the prevalence of multimorbid chronic conditions across the population, and shows the relationship between chronic condition multimorbidity and the utilization outcomes of interest in this study (annual inpatient utilization, ER utilization, outpatient non-preventive and preventive utilization).
Figure 2. Distribution of multi-morbidity of chronic conditions across the population. Of the Intervention population, 82% of individuals had two or more chronic conditions and 84% of the Control population had two or more chronic conditions. Note that this is the distribution prior to matching. shows distributions over specific chronic conditions for three sample matching iterations. Mental health diagnosis includes depression and anxiety disorders.
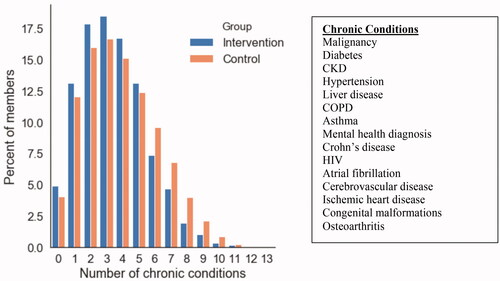
Figure 3. Relationship between number of comorbid chronic conditions and the number of inpatient visits in the year prior to intervention (A), number of ER visits (B), number of outpatient non-preventive visits (C), and number of preventive outpatient visits (D) in the combined Intervention and Control populations, prior to matching.
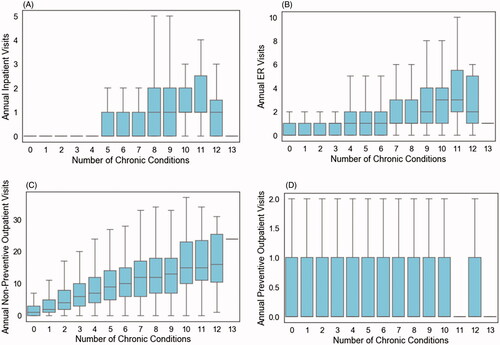
Table 3. Population demographics and utilization patterns at baseline and after three random matching iterations.
Prior to matching, the control population was roughly eight times the size of the intervention population, with significantly higher rates of chronic kidney disease (CKD), hypertension, and chronic obstructive pulmonary disease (COPD). The control population also had higher baseline rates of inpatient and ER utilization, and lower baseline rates of outpatient services. The three matching examples shown in demonstrate that at each iteration of randomized matching, both groups were the same size and had statistically similar diagnostic and baseline utilization profiles.
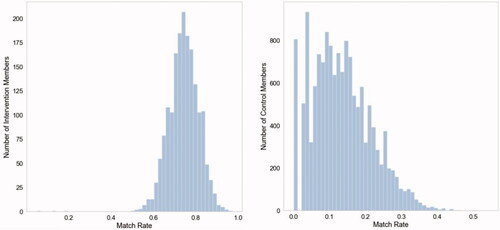
Sample size changes with each iteration but remains equal between groups. This is because out of the 1,000 members of the intervention population selected at every intervention, each is only kept for analysis if a match within the defined caliper can be found in the control population. Over the 100 iterations, each member of the intervention group was chosen 43 times on average as part of the random subsample of 1,000, and actually matched to a control 32 times on average. The average match-rate for an intervention member was 74%, and all intervention members were matched to a control at least once across all 100 iterations. The average match-rate for a control member was 13%, which is to be expected as larger subsamples of the control population are chosen at each iteration and matching is performed 1:1. Importantly, of all 14,596 members of the control population only 5% (n = 806) were never matched in a single iteration, indicating that only 5% of the control population were so different from the intervention population that a within-caliper match could never be found ().
Figure 4. Left: distribution of match rate across all 100 randomized bootstrap iterations in the intervention population. Right: distribution of match rate across all 100 randomized iterations in the control population.
Utilization outcomes
Results of the utilization analyses with randomized propensity matching are shown and described in and . Across 100 randomized iterations of propensity matching between the intervention and control group, a significant difference in ER utilization during the three months post-intervention (or in the three months after becoming eligible for intervention in the control group) is seen with 11 fewer visits per 1,000 members in the intervention population (). Significantly higher outpatient utilization was seen in the intervention group with 21 and 187 more visits per 1,000 members for preventive medicine and non-preventive outpatient visits, respectively (). There were significantly fewer inpatient visits seen in the intervention group, with a difference of 11 visits per 1,000 members from the control population ().
Figure 5. Distributions of outcomes in each group over 100 randomized iterations for (A) ER Visits per 1,000 members, (B) preventive medicine visits per 1,000 members, (C) non-preventive outpatient visits per 1,000 members, (D) inpatient visits per 1,000 members, over the 3 months following the initiation of the digital health platform intervention or the beginning of eligibility for the platform in the control population.
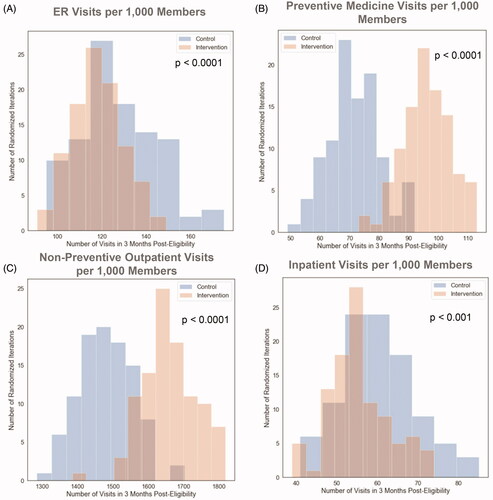
Table 4. Utilization outcomes.
Derived cost outcomes
Cost impact estimates were derived using a combination of the utilization outcomes shown above and median cost values derived from the health plan’s data during the time period of this analysis. The cost of the intervention itself was $473 per patient for the intervention period. The cost includes the software license for the Wellframe Digital Care Management platform and the direct cost of care management services provided with the technology by the health plan in question.
Estimated inpatient cost impact
Using Formula 1, total inpatient spending for the intervention population was estimated at $1,906,821 per 1,000 members over the three months following intervention, and $3,846,496 per 1,000 members in the control population over the same time period. Converting these values to per member per month (PMPM) and calculating the group differences results in an estimated $647 PMPM savings due to reduced inpatient utilization in the intervention population.
Estimated ER cost impact
The median cost of a single ER visit within this health plan’s medical claims data was $821. Using this and Formula 2, the total ER spending per 1,000 members in the intervention group was estimated at $97,699 over the three months following intervention, and $106,730 in the control population over the same time period. Converting these values to PMPM and calculating the group differences results in an estimated $3 PMPM savings due to reduced ER utilization in the intervention population.
Estimated outpatient cost impact
The median cost of a single preventive medicine visit in this health plan’s medical claims data was $154 and for a non-preventive outpatient office visit the median cost was $123. Using Formula 2 the total preventive outpatient spending per 1,000 members over three months was $14,322 and $11,088 in the intervention and control populations, respectively. Total spending for other outpatient office visits was $205,533 and $182,532 in the intervention and control populations, respectively. Combining these values, converting to PMPM, and calculating the group differences results in an estimated $9 PMPM spending increase due to increased outpatient utilization in the intervention population.
Comparison to existing methods
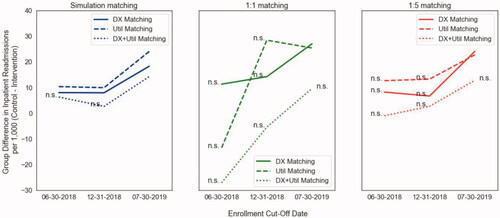
We chose to compare the output of our method when measuring post-intervention inpatient utilization to the output of traditional 1:1 propensity matching and 1:5 propensity matching. We used three different points in time as “enrollment cut-offs” to evaluate these methods as sample sizes grew in size over time. The first cut-off was June 30th, 2018, at which point 444 members had been enrolled into the intervention and 4,373 potential controls existed. The second cut-off was December 31st, 2018 at which point 917 members had been enrolled into the intervention and 8,055 potential controls existed. The third time point was July 31st, 2019 and reflects the sample sizes shown in the results above. We also used three different matching paradigms: all utilization variables listed in the 'Defining Matching Variables' section and diagnoses listed in (DX + Util); only age, gender and diagnoses listed in (DX); and only age, gender, and utilization variables listed in the 'Defining Matching Variables" section (Util). Results of these experiments are shown in .
Figure 6. Left: Inpatient utilization results of our propensity with bootstrapping methodology using three different matching criteria across three dates and sample sizes. Center: results using standard 1:1 propensity matching. Right: results using 1:5 propensity matching. (n.s. = not significant group difference at p < .05).
Discussion
Multimorbidity is an urgent challenge for all health systems necessitating the creation of novel interventions such as digital care management. However, evaluation of digital care management is subject to the same challenges as all supportive primary care interventions in the context of multimorbidity. We propose a methodology for evaluating digital care management in the context of multimorbidity in terms of its impact on healthcare utilization and cost. Our methods provide a framework for addressing some of the key issues outlined in . We use utilization as a proxy for matching individuals on disease severity. For example, two individuals with COPD and no ER utilization would be matched whereas two individuals with COPD, where one has ER and inpatient utilization would not be matched. We take an observational study approach in lieu of implementing an RCT and introduce both clinical expertise as well as novel statistical methodologies for choosing appropriate characteristics for matching an intervention population to a control population. Our usage of bootstrapping allows sampling as well as matching across the entire population despite the large class imbalances, and furthermore allows us to sample across the variance of potentially unobservable factors that may influence likelihood to receive or succeed with the intervention.
Our method continuously samples from the entire population rather than taking a single-shot matching approach where only a subset of the control population is chosen to compare to a smaller intervention population. By looking at the distributions of outcome values across all iterations of our randomization process (), one can see that with any given 1:1 matching, there can be a wide range of outcome values. For example, ER utilization ranged from roughly 110 to 170 visits per 1,000 members. Most traditional propensity matching methods are only performed in this single-shot manner, which, as demonstrated in our experiments, has the potential to provide a wide range of results. This is demonstrated in the second panel of , in which 1;1 matching produces wildly different results as the population of interest grows over time, which is not seen when using our methodology on the same set of data (panel 1, ). The other advantage of our methodology is seen in comparing our results (panel 1 of ) to the results of 1:n matching (panel 3 of ) performed on the same sets of data. While 1:n matching shows a similar robustness of results over time, the results do not reach statistical significance when performed using smaller subsets of the population. Taken together, our methodology demonstrates advantages when working with smaller datasets, and when trying to ensure robust outcomes over time in large populations that have many unobservable confounders that add noise to the analysis. We note that this is of particular value when assessing pilot interventions, where there is often a small sample size and high levels of uncertainty, but there is also an expectation that results will replicate in larger populations. A final note on our comparative analyses is that our method tends to produce similar results even when subsets of data are used for matching (DX vs. Util vs. DX + Util), superior to 1:1 and 1:n matching, indicating that it holds value also for analyses in which there is limited data available. The reason for the robustness of our methodology with limited data can be explained by the relationships shown in . There is a clear relationship between the number of multimorbid conditions and utilization of healthcare services. Our methodology can draw a strong enough signal from only one of these two dimensions to produce reliable results over time, whereas methods that do not implement randomization require both dimensions. We also note that the set of chronic conditions used in our approach may differ from sets used in other studies of multimorbidityCitation45. Given the robustness of our methodology when using only healthcare utilization metrics, we believe that a larger or different list of chronic conditions would not alter our results tremendously, but we note that the set of chronic conditions used for matching should be chosen based on their relevance to the population under consideration.
By randomly sampling from both groups over many populations, we ensure that each member of the whole population is included in the analysis at least once, and that they are not always matched to the same individual. This is particularly important when it comes to the issue of unobserved variables (such as the unmeasured social determinants of health) that may influence health outcomes. For example, suppose that there are five members of the control population who are within the same propensity score caliper of a given member of the intervention group, using the diagnosis and utilization matching characteristics implemented in this case study. There are a plethora of potential cofounders that cannot be seen but may significantly impact the outcome metrics, and therefore lead to very different final results depending on which of the five controls is chosen as a match. As evinced in , only 5% of the control population was unable to be matched across all iterations, indicating that 95% of the control population were appropriate for comparison to the intervention group, which would not have been captured with standard 1:1 single-shot matching. Our methodology allows for different pairs of members to be matched across different iterations so that this noise is accounted for in our final statistical analysis.
Another way that our method attempts to address the issue of unobservable variables is through proxy measures. A key concern in assessing a digital care management intervention is the inability to measure certain traits about an individual that may make them more or less likely to succeed – a concern applicable to previously published evaluations of digital health interventionsCitation46. For example, it would be ideal to create metrics for each individual that measure their levels of self-efficacy and engagement with their own health. Our method uses a proxy of monthly outpatient preventive visits to attempt to address this, but in reality, this is an intrinsic quality that cannot be measured in the control population who was never offered the intervention, and whose sole source of data is medical claims. For this reason, we choose the best proxies that we can create from claims data and then also implement randomization. The randomization component assumes that this unobservable intrinsic quality is normally distributed across the control population, and by sampling across it in its entirety we do not bias ourselves to a single segment that is matched on only observable features.
The derived cost savings demonstrated are of a different nature to a previous assessment of a digital health intervention in disease management where a retrospective observational analysis was performed using a difference in difference approach and known confounders were controlled for but unknown and unmeasured confounders were not accounted forCitation46. In this analysis a reduction in outpatient costs with no change in inpatient and emergency room costs was revealed. This difference may be due to the effect of unknown or unmeasured confounders, a difference in the risk profile of the population or difference in nature of the intervention - intended as a direct substitute for outpatient care rather than an augmentation thereof.
Limitations
The clinical variables upon which to propensity match groups in our methods were created using a subjective clinical definition. The conditions chosen were similar to common co-morbid conditions in other studies of multimorbidityCitation45,Citation47 with common cardiometabolic, respiratory, neoplastic and inflammatory conditions represented - the marginal variability likely determined by differences in population prevalence of the index conditions. This list, however is not intended to be an off-the-shelf prescription for matching variables. Instead local clinical and data science teams should determine the index conditions of interest for their populations. While the results in demonstrate that different combinations of matching variables produced relatively stable results, ongoing work is underway to perform a more objective data-driven set of matching variablesCitation48. Additionally, it has recently been highlighted that using healthcare utilization as a comparative metric carries racial and socioeconomic biasesCitation20. We believe, however, that utilization is still an important metric to take into consideration when matching and further work will be done to assess how using these metrics in the matching methodology change levels of bias. Although claims data were used in this paper, similar transactional data is available in most health systems, however this may be more difficult in some settings due to challenges in data infrastructure and data qualityCitation49 – a critical obstacle to any evaluation of the value of clinical interventions. The absolute values of cost presented are dependent on the local health economy in question with reimbursement rates being locally or nationally negotiated.
While cost and utilization are chosen as the outcomes of focus, any outcome for example Patient Reported Outcome Measures (PROMS) or biometrics of interest could be substituted based on an organization’s interests. However regrettably, these outcomes were not available in this instance and are typically not available at scale in administrative datasets for large populations particularly in non-intervention groups, hindering comparative analysis.
Conclusions
There is a known tension between needing to improve care and knowing how to do it in practiceCitation17. This tension is most keenly felt in situations where there is a heterogeneous group of patients and a heterogeneous group of interventions with a complex causal mechanism influencing the achievement of outcomes as is typical of multimorbidity in primary care. The methods proposed do not necessarily obviate the need for RCTs but rather propose a more cost effective and scalable means of repeated evaluation to inform quality improvement as patient and program parameters necessarily change. We are aware that costs of evaluation are high and for some organizations have been untenable, fundamentally limiting progress. Our intention is that armed with this methodology it will now be possible for national health systems, payors and risk bearing providers who are responsible for managing multimorbidity and incentivized to do so in an effective and efficient manner who might not have the resources for repeated RCTs or have concerns about the generalizability therein to use this method to evaluate digital and non-digital interventions in the context of multimorbidity, determine the mechanisms underlying revealed associations and use these inferences to inform the continuous improvement of clinical services for multimorbid populations.
Transparency
Declaration of funding
No funding was received to produce this article
Declaration of financial/other relationships
E.L., M.J., N.N., P.R., and T.P. are employees of Wellframe Inc. and hold Wellframe Inc. stock.
H.M. is a paid consultant of Wellframe Inc.
J.K.R. is an employee of Google LLC and owns Alphabet stock
Peer reviewers on this manuscript have no relevant financial or other relationships to disclose.
Author contributions
E.L. developed the methodology and E.L., M.J., N.N., P.R. and H.M. only had access to the data and performed the analysis. E.L. and T.P. conceived of and wrote the manuscript with the assistance and feedback of all other co-authors.
Acknowledgements
We would like to thank Jacob Sattelmair at Wellframe, Jeff Levin-Scherz at Harvard T.H. Chan School of Public Health, Leo Celi and Tom Pollard at Massachusetts Institute of Technology, Mike Howell at Google, Von Nguyen at Blue Cross Blue Shield North Carolina, Naim Munir at Premera Blue Cross and Joe Kimura at Atrius Health for reviewing earlier versions of the manuscript and generously providing feedback.
Data availability statement
The data that support the findings of this study are available from a Wellframe health plan customer, but restrictions apply to the availability of these data, which were used under license for the current study, and so are not publicly available. Data are however available from the authors upon reasonable request and with permission of the health plan in question.
References
- Pearson-Stuttard J, Ezzati M, Gregg EW. Multimorbidity – a defining challenge for health systems. Lancet Public Heal. 2019;4(12):e599–e600.
- Iaccarino G, Grassi G, Borghi C, et al. Age and multimorbidity predict death among COVID-19 patients: results of the SARS-RAS study of the italian society of hypertension. Hypertension. 2020;76(2):366–372.
- Tinetti ME, Fried TR, Boyd CM. Designing health care for the most common chronic condition – multimorbidity. JAMA. 2012;307(23):2493–2494.
- Boyd C, Smith CD, Masoudi FA, et al. Decision making for older adults with multiple chronic conditions: executive summary for the American Geriatrics Society guiding principles on the care of older adults with multimorbidity. J Am Geriatr Soc. 2019;67(4):665–673.
- Mattie H, et al. A framework for predicting impactability of digital care management using machine learning methods. Popul Heal Manag. 2019;23(4):319–325.
- Kastner M, Hayden L, Wong G, et al. Underlying mechanisms of complex interventions addressing the care of older adults with mulimorbidity: a realist review. BMJ Open. 2019;9(4):e025009.
- American College of Physicians. Chronic care management tool kit: what practices need to do to implement and bill CCM codes. 2015:1–8.
- “What is Digital Health?” U.S. Food and Drug Association. 2020. [cited 2021 Feb 6]. Available from: https://www.fda.gov/medical-devices/digital-health-center-excellence/what-digital-health.
- Kvedar JC, Fogel AL, Elenko E, et al. Digital medicine’s march on chronic disease. Nat Biotechnol. 2016;34(3):239–246.
- Downing J, Bollyky J, Schneider J. Use of a connected glucose meter and certified diabetes educator coaching to decrease the likelihood of abnormal blood glucose excursions: the Livongo for diabetes program. J Med Internet Res. 2017;19(7):e234.
- Bollyky J, Lu WEI, Schneider J, et al. Cost savings associated with usage and blood glucose control for members of the Livongo for diabetes program. Diabetes. 2018;67(Supplement 1):1330.
- Panch T, Goodman E. Technology, seniors, and sense making. Am J Manag Care. 2016;22(7):SP250–SP251.
- Mueller NE, Panch T, Macias C, et al. Using smartphone apps to promote psychiatric rehabilitation in a peer-led community support program: pilot study. JMIR Ment Health. 2018;5(3):e10092.
- Domenge N. Driving patient engagement through mobile care management. Healthc Inf Manag Syst Soc Conf Session. 2017.
- van Velthoven MH, Smith C. Some considerations on digital health validation. Npj Digit Med. 2019;2(1):843–844.
- Priebe JA, Toelle TR. Is there a right control condition in mHealth trials? A critical view on pain medicine. NPJ Digit Med. 2019;2:107.
- Auerbach AD, Landefeld CS, Shojania KG. The tension between needing to improve care and knowing how to do it. N Engl J Med. 2007;357(6):608–613.
- Dunbar-Rees R, Panch T, Dancy M. From volume to value? Can a value-based approach help deliver the ambitious aims of the NHS cardiovascular disease outcomes strategy? Heart. 2014;100(11):827–832.
- Porter M, Lee T. The strategy that will fix health care. Harvard Business Review; 2013.
- Obermeyer Z, Powers B, Vogeli C, et al. Dissecting racial bias in an algorithm used to manage the health of populations. Science. 2019;366(6464):447–453.
- Castro Sweet CM, Chiguluri V, Gumpina R, et al. Outcomes of a digital health program with human coaching for diabetes risk reduction in a medicare population. J Aging Health. 2018;30(5):692–710.
- Abadie A. Difference-in-difference estimators. In Microeconometrics. London: Palgrave Macmillan; 2010.
- Dorje T, Zhao G, Tso K, et al. Smartphone and social media-based cardiac rehabilitation and secondary prevention in China (SMART-CR/SP): a parallel-group, single-blind, randomised controlled trial. Lancet Digit Heal. 2019;1(7):e363–e374.
- Wennberg DE, Marr A, Lang L, et al. A randomized trial of a telephone care-management strategy. N Engl J Med. 2010;363(13):1245–1255.
- Brown R, Peikes D, Chen A, et al. 15-Site randomized trial of coordinated care in medicare FFS. Health Care Financ Rev. 2008;30(1):5–25.
- Finkelstein A, Zhou A, Taubman S, et al. Health care hotspotting - a randomized, controlled trial. N Engl J Med. 2020;382(2):152–162.
- Green SR, Singh V, O’Byrne W. Hope for New Jersey’s city hospitals: the Camden Initiative. Perspect Health Inf Manag. 2010;7:1d.
- Powers B, et al. Impact of complex care management on spending and utilization for high-need, high-cost medicaid patients. Am J Manag Care. 2020;26:e57–e63.
- Stuart E, Bradshaw C, Leaf P. Assessing the generalizability of randomized trial results to target populations. Prev Sci. 2015;16(3):475–485.
- Susukida R, Crum R, Ebnesajjad C, et al. Generalizability of findings from randomized controlled trials: application to the national institute of drug abuse clinical trials network. Addiction. 2017;112(7):1210–1219.
- Clay R. More than one way to measure. Monit Psychol. 2010;41:52–55.
- Glass TA, Goodman SN, Hernan MA, et al. Causal inference in public health. Annu Rev Public Health. 2013;34:61–75.
- Hall JA, Summers KH, Obenchain RL. Cost and utilization comparisons among propensity score-matched insulin lispro and regular insulin users. JMCP. 2003;9(3):263–268.
- Stuart EA, DuGof E, Abrams M, et al. Estimating causal effects in observational studies using electronic health data: challenges and (some) solutions. eGEMs. 2013;1(3):4.
- Stuart EA. Matching methods for causal inference: a review and a look forward. Stat Sci. 2010;25(1):1–21.
- Seeger JD, Williams PL, Walker AM. An application of propensity score matching using claims data. Pharmacoepidemiol Drug Saf. 2005;14(7):465–476.
- Atun R. Health systems, systems thinking and innovation. Health Policy Plan. 2012;27:4–8.
- Ranganathan P, Pramesh C, Aggarwal R. Common pitfalls in statistical analysis: intention-to-treat versus per-protocol analysis. Perspect Clin Res. 2016;7(3):144.
- Steiner PM, Cook TD, Shadish WR, et al. The importance of covariate selection in controlling for selection bias in observational studies. Psychol Methods. 2010;15(3):250–267.
- Roca J, Vargas C, Cano I, et al. Chronic obstructive pulmonary disease heterogeneity: challenges for health risk assessment, stratification and management. J Transl Med. 2014;12(Suppl 2):S3.
- Garrido MM, Kelley AS, Paris J, et al. Methods for constructing and assessing propensity scores. Health Serv Res. 2014;49(5):1701–1720.
- Rosenbaum PR, Rubin DB. The central role of the propensity score in observational studies for causal effects. Biometrika. 1983;70(1):41–55.
- Altman NS. An introduction to kernel and nearest-neighbor nonparametric regression. Am. Stat. 1992;46(3):175–185.
- Austin PC. Optimal caliper widths for propensity-score matching when estimating differences in means and differences in proportions in observational studies. Pharm Stat. 2011;10(2):150–161.
- Barnett K, Mercer SW, Norbury M, et al. Epidemiology of multimorbidity and implications for health care, research, and medical education: a cross-sectional study. The Lancet. 2012;380(9836):37–43.
- Whaley CM, Bollyky JB, Lu W, et al. Reduced medical spending associated with increased use of a remote diabetes management program and lower mean blood glucose values. J Med Econ. 2019;22(9):869–877.
- Vuik SI, Mayer E, Darzi A. Enhancing risk stratification for use in integrated care: a cluster analysis of high-risk patients in a retrospective cohort study. BMJ Open. 2016;6(12):e012903.
- Schneeweiss S, Rassen JA, Glynn RJ, et al. High-dimensional propensity score adjustment in studies of treatment effects using health care claims data. Epidemiology. 2009;20(4):512–522.
- Panch T, Mattie H, Celi LA. The “inconvenient truth” about AI in healthcare. NPJ Digit Med. 2019;2:77.