
Abstract
Background
Multiple studies have demonstrated the high economic burden related to the management of lower extremity peripheral artery disease (PAD). This is the first study to examine long-term PAD-related costs among unselected patients undergoing endovascular intervention, and to investigate how clinical and anatomic factors impact cost outcomes over time.
Methods and results
We performed a prospective health economic study alongside the LIBERTY 360° trial (ClinicalTrials.gov; identifier NCT01855412) – a prospective, multi-center study evaluating the long-term outcomes of endovascular revascularization to treat claudication or critical limb ischemia. Costs (2018) were calculated using a combination of standard “bottom-up” cost accounting methods (for index procedures), itemized hospital charges and department level cost-to-charge ratios (for non-procedural hospital resources), national Medicare Severity-Diagnosis Related Group-specific average reimbursements (for follow-up hospitalizations) and Medicare payments (for outpatient/chronic care). Methods for the analysis of censored cost data were used to adjust cost estimates for patients with incomplete follow-up. Independent predictors of cumulative 2-year costs were explored using generalized linear models. A total of 1,189 patients were included (500 Rutherford 2–3, 589 Rutherford 4–5, 100 Rutherford 6). Mean total costs associated with the index procedure hospitalization increased with Rutherford classification ($10,304, $11,418, and $19,403 for Rutherford 2–3, 4–5, and 6, respectively; p < 0.01 in all pairwise comparisons). Mean total 2-year follow-up costs were $11,416, $24,846, and $25,720 for Rutherford 2–3, 4–5, and 6, respectively (p < 0.001 comparing Rutherford 2–3 to the other 2 groups; p = 0.09 comparing Rutherford 4–5 and Rutherford 6). Key predictors of higher cumulative 2-year costs included female sex, pedal lesion location, severe lesion calcification, the presence of one or more chronic total occlusions, the number of wounds present on the target limb at baseline, and Rutherford classification.
Conclusions
Among patients with symptomatic lower extremity PAD undergoing endovascular revascularization, initial treatment costs and total 2-year costs vary significantly according to clinical and lesion-level characteristics, as well as symptom burden.
Introduction
Peripheral arterial disease (PAD) of the lower extremities is a progressive circulatory system disorder affecting approximately 8.5 million people in the US, including 12–20% of individuals over 60 years of ageCitation1. In addition to an increased risk of major cardiovascular events, lower extremity PAD is associated with high rates of morbidity and impairment in quality-of-life, and is thereby a major contributor to the public health burden of cardiovascular diseaseCitation2,Citation3. The Rutherford classification is used to categorize patients according to the clinical spectrum of symptomatic lower extremity PAD, with Rutherford 1, 2, and 3 corresponding to mild, moderate, and severe claudication, and Rutherford 4–6 corresponding to critical limb ischemia (CLI). Among the CLI categories, Rutherford 4 indicates ischemic rest pain, Rutherford 5 indicates minor tissue loss and Rutherford 6 indicates major tissue lossCitation4. For patients with critical limb ischemia (CLI), amputation is also a major source of morbidity and occurs in up to 2/3 of patients, depending on Rutherford classCitation5–7. Current American College of Cardiology/American Heart Association (ACC/AHA) guidelines for the management of lower extremity PAD recommend the evaluation for revascularization options by an interdisciplinary care team before amputation in patients with CLI (Class I) and consideration of revascularization for patients with lifestyle-limiting claudication and an inadequate response to medical management and supervised exercise (Class IIa)Citation8.
Notably, multiple studies have demonstrated the high economic burden related to the management of lower extremity peripheral artery disease (PAD)Citation5,Citation9,Citation10. While stable patients with asymptomatic PAD have high annual costs mainly due to frequent cardiovascular events and hospitalizations, costs increase in more symptomatic PAD patients owing to high rates of vascular-related hospitalizations and proceduresCitation10. Few studies, however, have examined long-term PAD-related costs among unselected patients undergoing endovascular intervention, nor investigated how clinical and anatomic factors impact economic outcomes over time.
LIBERTY 360° was a prospective, observational, multi-center study evaluating the procedural and long-term clinical outcomes of endovascular device interventions – including any FDA-approved technologies – to treat claudication or critical limb ischemiaCitation4,Citation11. One-year results from LIBERTY 360° revealed benefits of endovascular revascularization across the full spectrum of disease severity, with associated improvement in both Rutherford classification and disease-specific quality-of-lifeCitation12. In order to characterize the initial and long-term costs associated with peripheral revascularization, we performed a prospective health economic study alongside the LIBERTY 360° trial. The goals of this study were: (1) to examine 2 year costs across the full range of patients undergoing revascularization for symptomatic lower extremity PAD; and (2) to examine the relationship between symptomatic, clinical, and lesion-specific characteristics and long-term costs in the PAD population.
Methods
The LIBERTY 360° trial was registered on the National Institutes of Health website (ClinicalTrials.gov; identifier NCT01855412). The study protocol was approved by the institutional review board at each site. Signed written informed consent was obtained for each subject. The dataset used for this analysis was assembled from participant-level data collected as part of LIBERTY-360, hospital bills collected with the participant’s consent, and a variety of other sources and methods described in detail within the manuscript. The authors declare that all supporting methods and references to the data sources are available within the article (and its online Supplementary files). The final analytic dataset will not be made publicly available, however additional details may be provided upon reasonable request of the corresponding author.
LIBERTY 360° enrolled patients 18 years of age or older with clinical evidence of Rutherford classification of 2 to 6 PAD and requiring endovascular intervention in one or both limbs. Enrollment criteria required a target lesion in a native vessel located within or extending into 10 cm above the medial epicondyle to the digital arteries. The type of revascularization was determined by the treating physician, and all commercially available endovascular treatment options for lower extremity PAD were allowed. Patients were considered enrolled in the study once at least one target lesion was crossed and treated without conversion to peripheral vascular bypass surgery. By design, the study cohort was divided into three study arms according to the most severe clinical syndrome based on the Rutherford classification: Rutherford 2–3 (up to 500 subjects); Rutherford 4–5 (up to 600 subjects); and Rutherford 6 (at least 100 subjects). Following their index revascularization procedure, enrolled patients had follow-up office visits at 30 days, and 6, 12, and 24 months. At each follow-up visit, both inpatient and outpatient PAD-related healthcare resource use reported by the patient were recorded. In addition, the protocol included the collection of hospital bills for the index procedure and any PAD-related hospitalizations reported during follow-up.
Estimation of PAD-related healthcare costs
Costs for index revascularization procedures were calculated for each patient using standard “bottom-up” cost accounting methods based on detailed resources collected at the time of the procedure and 2018 acquisition costs. All other hospital costs were calculated based on hospital billing data, by converting itemized hospital charges to costs using department level cost-to-charge ratios. Costs from years before 2018 were converted to 2018 dollars using the medical care component of the Consumer Price Index. For index procedures with missing billing data (56% of index procedures; 30% of index procedures were carried out in an office-based laboratory setting for which hospital bills were not available), non-procedural costs were estimated from regression models developed from the available billing data (details in online Supplement).
Follow-up hospitalizations involving PAD-related revascularization procedures were assigned costs using the same methods as for the index procedure. PAD-related hospitalizations not involving revascularization procedures for which bills were unavailable were assigned a Medicare Severity-Diagnosis Related Group (MS-DRG) based on the primary reason for hospitalization and any other relevant clinical details reported, and costs were assigned using national MS-DRG-specific average hospital reimbursements for 2018. In addition to costs for hospitalizations revascularization procedures, costs were assessed for PAD-related physician fees, outpatient procedures, diagnostic tests, office visits and days in rehabilitation, skilled nursing and other chronic care facilities using the 2018 Medicare fee schedule. Further details relating to the costing methods are provided in the online Supplement.
Statistical analyses
Categorical patient and procedural characteristics are reported as frequencies, counts of resource use are reported as median (interquartile range), and costs are reported as mean ± SD. Categorical variables were compared across subgroups using Fisher’s exact test, index procedure length of stay [LOS], and procedure duration were compared across subgroups using the Kruskal-Wallis test with pairwise differences evaluated using the Dwass, Steel, Critchlow-Fligner multiple comparison procedure when the overall p-value <0.05. Index procedure costs were compared across subgroups using analysis of variance with pairwise differences evaluated using Tukey’s multiple comparisons test when the overall 3-way comparison p < 0.05. Costs for the index hospitalization and 1- and 2-year follow-up periods were calculated for the overall population, as well as subgroups according to Rutherford classification, TransAtlantic Inter-Society Consensus (TASC) lesion severityCitation13, distal extent of disease, lesion length (mm), presence or absence of a chronic total occlusion, and extent of lesion calcification (as defined by the Peripheral Academic Research Consortium [PARC] scaleCitation14). Methods for the analysis of censored cost data, involving use of an inverse probability-weighted estimator, were used to adjust total 2-year cost estimates for patients with incomplete follow-up. For each of the 1st and 2nd year follow-up periods, costs were estimated as the observed costs during the interval for patients with complete data, divided by the probability of not being censored within the intervalCitation15. Ninety-five percent confidence intervals and p-values for mean costs and cost differences were generated using the nonparametric bootstrapCitation16.
Independent predictors of cumulative 2-year costs (adjusted for censoring) were explored using generalized linear models (GLM; gamma error distribution, log-link function)Citation17. Covariates included in the model fitting process included all baseline and procedural variables shown in Supplementary Table S1, plus Rutherford classification and the five other categorizations relating to anatomical characteristics mentioned previously. A backwards elimination procedure was used with covariates with p < 0.10 retained in the final model. All analyses were performed using SAS version 9.4. A p-value < 0.05 was considered statistically significant for all comparisons.
A separate analysis of 2-year costs restricted to patients with complete data through 2 years, including patients who died within 2 years, was carried out to explore the potential sensitivity of the results to the handling of incomplete data (censored cost analysis). This analysis included the generation of cumulative cost estimates across different categories and for different Rutherford categories, and GLM models examining predictors of index hospitalization and cumulative 2-year costs.
Results
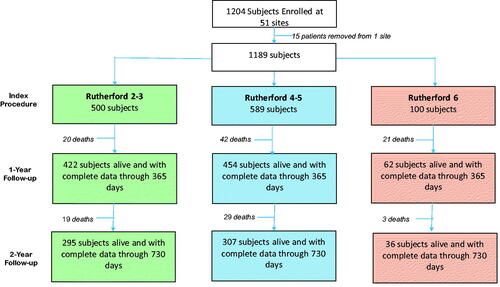
Between May 2013 and February 2016, LIBERTY 360° enrolled 1,204 patients from 51 US sites. For this economic study, 15 patients were excluded due to closure of the enrolling site, leaving 1,189 patients (500 Rutherford 2–3, 589 Rutherford 4–5, and 100 Rutherford 6). shows patient flow for the enrolled patients through the 2-year follow-up period. Overall, 7.0% of patients of the 1,189 patients in the economic study cohort died prior to the 1-year follow-up (4.0%, 7.1% and 21.0% for Rutherford 2–3, 4–5, and 6, respectively; three patients, all Rutherford 6, died prior to discharge from the index procedure hospitalization), and the cumulative mortality rate at 2-year follow-up was 11.3% (7.8%, 12.1%, and 24.0% for Rutherford 2–3, 4–5, and 6, respectively). Rates of complete follow-up data for surviving patients were 84.8% at 1 year and 60.5% at 2 years.
Figure 1. Consort diagram showing patient flow in the LIBERTY 360° registry through 2 years, separately according to Rutherford category.
Baseline demographic and clinical characteristics of the study population are summarized in Supplementary Table S1, both for the overall study population and for patients alive at the 2-year follow-up with vs without complete cost data. The median age of the population was 70 (IQR = 63–78), and 65% were male. Overall, 61% of the study population had diabetes mellitus, 68% were current or prior smokers, 61% had a history of coronary artery disease (CAD), and 51% had undergone previous peripheral endovascular treatment. Patients with incomplete 2-year data were more likely to be black, have chronic renal insufficiency and have had a prior stroke/TIA; they were less likely to have a history of CAD. The distribution of patients across different symptomatic, clinical, and lesion-specific characteristics is shown in Supplementary Figure S1.
Index procedure costs
Resource use and costs relating to the index procedure, both overall and stratified by Rutherford classification, are summarized in (with rates for more granular categories of resource use, and cost results in terms of median [IQR] presented in Supplementary Table S2). Excluding physician fees and facility costs, devices accounted for >60% of index procedure costs across all categories. Mean [median] total costs (including physician fees and facility costs) increased with Rutherford classification ($10,304 [$9,697], $11,418 [$9,973], and $19,403 [$13,705] for Rutherford 2/3, 4/5, and 6, respectively; p < 0.01 in all pairwise comparisons).
Table 1. Selected resource use (median, interquartile range) and costs (mean ± standard deviation) for the index procedure and hospitalization.
Follow-up PAD-related hospitalizations, procedures, and outpatient costs
Rates of different categories of PAD-related healthcare resource use during the 2-year follow-up period are summarized in and associated costs are summarized in and . (Supplementary Table S3 presents PAD-related resource use in terms of # and % of patients with >0 resource use within each category, and Supplementary Table S4 presents costs over the 2-year period, in terms of median [IQR]). Overall, post-procedure costs in each year were significantly higher for patients with CLI than for patients with claudication (for Rutherford 2–3 vs 4–5 and 2–3 vs 6 all p < 0.01 for both year 1 and year 2), whereas costs between CLI subcategories (Rutherford 4–5 vs 6) did not differ significantly during either year 1 or year 2. Costs associated with repeat endovascular procedures were highest for Rutherford 4–5 in each of years 1 and 2, and cumulatively, compared with Rutherford 2–3 and 6 (all p < 0.05). Within each Rutherford category, costs were lower in year 2 than year 1, driven by lower costs associated with endovascular procedures, surgical procedures, and other PAD-related hospitalizations.
Figure 2. Follow-up PAD-related costs during years 1 and 2 post-index procedure, according to Rutherford category. Stacked bar charts show costs associated with: endovascular procedures (red); non-endovascular procedures – including surgical revascularization, lower limb amputation, and limb salvage procedures (green); non-procedure PAD-related hospitalizations (yellow); and outpatient/chronic care (blue).
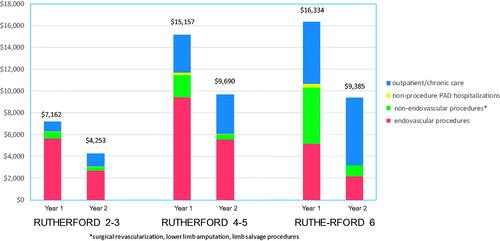
Table 2. Follow-up PAD-related resource utilization* over 2-years of follow-up.
Table 3. Mean (95% CI) PAD-related costs ($) up to 2 years following the index procedure, adjusted for censoring.
Cumulative 2-year costs associated with surgical procedures increased with more advanced Rutherford classification (p < 0.001 for all pairwise comparisons), primarily due to increasing rates of lower extremity amputation. Two-year costs associated with outpatient and chronic vascular care also increased significantly with increasing Rutherford class (all pairwise comparisons p < 0.05); this trend was driven primarily by increased costs associated with rehab/skilled nursing facility stays and wound care in patients with CLI at baseline. Mean [median] total 2-year follow-up costs were $11,416 [$11,407], $24,846 [$24,744], and $25,720 [$25,567] for Rutherford 2–3, 4–5, and 6, respectively (p < 0.001 comparing Rutherford 2–3 with each of the other 2 groups; p = 0.09 comparing Rutherford 4–5 and Rutherford 6).
Cumulative 2-year costs across clinical and anatomical subgroups
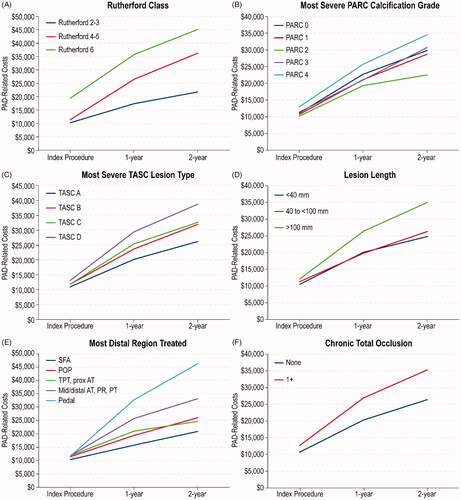
Cumulative 2-year costs, including costs associated with the index procedure, are summarized across Rutherford classification and five other vascular disease categorizations in , and over time in (means and confidence limits corresponding to are presented in Supplementary Table S5 and Supplementary Figure S2). For all classification systems, there was a stepwise increase in mean costs with increasing severity, except for PARC, for which mean costs were lowest for PARC grade 2. Follow-up PAD-related resource use and costs through the 2-year follow-up, according to specific devices used during index revascularization including drug-eluting stents, drug-coated balloons, and orbital atherectomy (non-mutually exclusive categories), are summarized in Supplementary Tables S6 and S7.
Figure 3. Cumulative 2-year PAD-related costs, adjusted for censoring of patients with incomplete follow-up, according to clinical and anatomic classifications. Stacked bar charts show costs associated with: index hospitalization (light blue); follow-up endovascular procedures (red), follow-up non-endovascular procedures – including surgical revascularization, lower limb amputation, and limb salvage procedures (green); non-procedure PAD-related hospitalizations (yellow); outpatient/chronic care (dark blue). Abbreviations. TASC, TransAtlantic Inter-Society Consensus; SFA, superficial femoral artery; POP, popliteal artery; TPT, tibio-peroneal trunk; Prox AT, proximal anterior tibial; Mid/Distal AT, Mid/Distal anterior tibial; PR, peroneal; PT, posterior tibial.
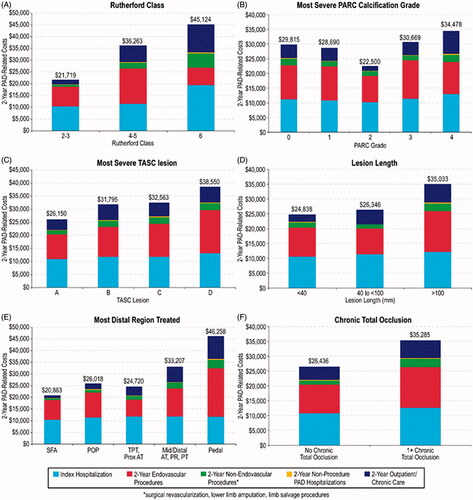
Figure 4. Cumulative PAD-related costs over time, adjusted for censoring, according to clinical and anatomic classifications. Abbreviations. TASC, TransAtlantic Inter-Society Consensus; SFA, superficial femoral artery; POP, popliteal artery; TPT, tibio-peroneal trunk; Prox AT, proximal anterior tibial; Mid/Distal AT, Mid/Distal anterior tibial; PR, peroneal; PT, posterior tibial.
2-Year cost prediction model
Estimates of the independent effect of baseline characteristics on index hospitalization costs and cumulative 2-year costs are presented in ; GLM coefficient estimates represent the estimated multiplicative impact on costs. Key predictors of higher index hospitalization costs include Rutherford category (53% increase in costs for Rutherford 6 vs Rutherford 2, 3), presence of ≥1 chronic total occlusion (12% increase in costs), and increasing number of wounds on target limb at baseline (8% increase in costs per 1-unit increase). For cumulative 2-year costs, key predictors include female sex (17% increase), Rutherford category (23% increase for Rutherford 4, 5 vs Rutherford 2, 3; 27% increase for Rutherford 6 vs Rutherford 2, 3), the presence of ≥1 chronic total occlusion at baseline (26% increase in costs), and number of wounds on target limb at baseline (18% increase per 1-unit increase). In addition, pedal lesion location was associated with a striking increase in 2-year costs (76% increase relative to SFA lesion location).
Table 4. Predictors of cumulative 2-year costs from generalized linear model.
Sensitivity analysis based on patients with complete data through 2 years
Results from the analysis of costs across Rutherford categories restricted to patients with complete data through 2 years (analogous to ) are presented in Supplementary Table S8, and estimates of the independent effect of baseline characteristics on index hospitalization and cumulative 2-year costs from the complete case analysis (analogous to ) are presented in Supplementary Table S9. The cost estimates presented in Supplementary Table S8 are qualitatively very similar to those from the main analysis, and estimates of the impact of key predictors of both index hospitalization and cumulative 2-year costs discussed above are quantitatively similar in the complete case analysis to those from the analysis of costs based on all available data, adjusted for censoring.
Discussion
This analysis provides detailed long-term costs of endovascular revascularization in unselected patients across the spectrum of symptomatic lower extremity PAD. Uniquely, this analysis included baseline measures of disease severity and details relating to outpatient and chronic care resource use not available in conventional administrative datasets often used in studies examining long-term healthcare costs. Results reveal how measures of symptom burden as well as clinical and lesion-level characteristics influence both initial treatment costs and total 2-year costs. For patients with critical limb ischemia involving major tissue loss (Rutherford 6), costs associated with the index endovascular revascularization procedure were significantly higher than for other Rutherford categories. Conversely, Rutherford 4–5 patients incurred higher costs during follow-up – primarily related to additional endovascular procedures. Not surprisingly, costs associated with lower extremity amputation were especially high for Rutherford 6 patients, and outpatient and chronic care costs during follow-up were also particularly high for CLI patients.
Previous studies have used administrative databases to examine hospitalization rates and associated costs following lower limb revascularization procedures, with a focus on hospital readmissions within 30 daysCitation18–20. These studies were motivated by the possibility that the Centers of Medicare and Medicaid Services (CMS) Hospital Readmissions Reduction Program (HRRP)Citation21, which uses 30 day readmission rates as a quality metric for other conditions such as myocardial infarction and heart failure, might be extended to peripheral artery revascularization procedures. Under HRRP, hospitals are penalized financially for higher than predicted 30-day readmission rates. While these studies identified factors associated with increased readmission rates and associated costs, their exclusive focus on inpatient care ignores the burden associated with outpatient and chronic care costs that can account for a substantial fraction of follow-up costs, especially for patients with CLI. In addition, these studies are limited by the relatively superficial disease-severity indicators available within administrative datasets. If bundled payment models are developed in an effort to control costs, our results suggest that they should include adjustment for differences in clinical syndrome and anatomic features associated with higher (or lower) long-term costs.
The high clinical and economic burden of CLI has led to several studies focusing on that population. Mustapha et al.Citation22 used Medicare claims data from 2010–2015 to estimate 4-year costs in patients with CLI following an initial endovascular revascularization, surgical revascularization, or lower limb amputation. Average 4-year costs, including inpatient, outpatient, and physician/supplier costs, for patients who underwent endovascular revascularization was $121,900, or $49,700 per patient-year. These annual cost estimates are somewhat higher than those suggested by our 2-year analysis, likely due to the inclusion of costs associated with non-PAD related healthcare and the higher mean age of the Medicare study population (74 years vs 70 years, for LIBERTY 360°). A focus of many previous studies has been the comparison of outcomes and costs in CLI patients undergoing surgical vs endovascular revascularization – an important issue that is beyond the scope of our study. Definitive insight into the optimal approach to such patients (considering both clinical and economic perspectives) awaits results from the ongoing Best Endovascular vs Best Surgical Therapy in Patients with Critical Limb Ischemia (BEST-CLI) trial expected within the next few yearsCitation23.
Our study contributes novel insight into the patterns of cost accrual in the 2 years following peripheral revascularization across Rutherford categories. Not surprisingly, for patients with severe critical limb ischemia (Rutherford 6), surgical procedures including limb salvage and amputation and chronic care (including rehabilitation facility days and wound care visits) comprise larger components of post-revascularization costs than for patients with less advanced disease. Alternatively, downstream costs for Rutherford 2–3 and 4–5 categories are driven mainly by follow-up endovascular procedures – particularly for patients with Rutherford 4–5, reflecting the focus on maintaining limb viability for such patients. As a result, the impact of Rutherford classification on cumulative 2-year costs was similar for Rutherford 4, 5 and Rutherford 6 relative to Rutherford 2, 3 (23% and 27% increase, respectively). Other factors that were independently associated with cumulative 2-year costs are female sex (↑17%), pedal artery revascularization (↑76% relative to SFA), ≥ 1 chronic total occlusion (↑26%), and number of wounds on target limb at baseline (↑18% per wound).
Comparison to other vascular conditions
A comparison of the cost estimates from this study to other peripheral vascular intervention populations shows them to be intermediate between costs in patients undergoing carotid endarterectomy and costs in patients undergoing open or endovascular aortic aneurysm repair (EVAR). As part of the Vascular Quality Initiative, costs associated with carotid endarterectomy were examined for patients with low, medium, and high predicted risk of 2-year death. Mean total hospitalization costs associated with the index procedure across these three groups were $7,500, $8,276, and $10,868, respectively, and cumulative 2-year costs for these same three groups were $8,801, $10,025, and $17,815, respectively. By comparison, mean index procedure and total 2-year costs for patients who underwent lower extremity endovascular revascularization in LIBERTY 360° were $10,304 and $21,720 for Rutherford 2–3, $11,418 and $36,265 for Rutherford 4–5, and $19,403 and $45,123 for Rutherford 6. A comparison of the results from LIBERTY 360° with those from the Vascular Quality Initiative cost study reveal how follow-up costs associated with PAD-related hospitalizations and outpatient/chronic care comprise a larger proportion of 2-year costs in patients undergoing peripheral intervention vs post-procedure care following carotid endarterectomy.
In the Open v Endovascular Repair (OVER) trial, which compared two methods of abdominal aortic aneurysm (AAA) repair, mean hospitalization costs for the AAA procedure were $37,068 and $42,970 for the endovascular repair and open repair groups, respectivelyCitation24. Cumulative 2-year costs including follow-up hospitalizations and outpatient/chronic care were $75,325 for EVAR and $80,344 for open repair. These costs from the OVER trial are substantially higher than costs in patients undergoing lower extremity endovascular revascularization from LIBERTY 360° (index hospitalization costs of $11,621, cumulative 2-year costs $30,491).
Limitations
While LIBERTY 360° included a broad patient population of patients undergoing peripheral endovascular procedures and included detailed clinical, functional, and anatomic data not available in administrative databases often used to evaluate cost outcomes, this economic study has limitations. There may be bias with respect to site and patient participation in LIBERTY 360°, given the degree of study-related oversight and more detailed follow-up than might be provided in the course of usual care. The relatively small sample size, especially within some of the functional and anatomic subgroups, in combination with loss to follow-up, led to uncertainty in our cost estimates and the extent to which they are representative of the overall population undergoing endovascular lower extremity revascularization. Statistical methods used in our analysis adjusted for loss to follow-up (under the missing-at-random assumption), however, and despite relatively small sample sizes, our results revealed trends and significant predictors of cost not reported in previous studies. Our study was also limited due to the lack of a surgical revascularization comparison group, as LIBERTY 360° was restricted to patients undergoing endovascular revascularization. While we expect these results to be generalizable within the US healthcare system, it is possible that generalizability may be limited due to the inclusion criteria which included extensive mandatory testing requirements, and potential biases in physician selection of orbital atherectomy which is manufactured by the study sponsor.
Conclusions
Among patients with symptomatic lower extremity PAD undergoing endovascular revascularization, initial treatment costs and total 2-year costs vary significantly according to symptom burden and both clinical and lesion-level characteristics. If validated in other studies, these data could be used to prospectively identify patients at risk for high follow-up costs who may be targets for novel approaches to medical therapy, wound care, and revascularization techniques. Finally, with increasing emphasis on alternative payment models (such as bundled payments and accountable care organizations), these findings may have important implications for health care resource allocation and reimbursement for patients with symptomatic PAD undergoing revascularization procedures.
Transparency
Declaration of funding
The study was funded by a grant from Cardiovascular Systems, Inc.
Declaration of financial/other relationships
Dr. Magnuson reports grant support from Abbott Vascular, Cardiovascular Systems, Inc, Corvia Medical, Edwards Lifesciences, and Svelte Medical Systems. Ms. Vilain and Ms. Li report no conflicts. Dr. Armstrong is a consultant to Abbott Vascular, Bostin Scientific, Cardiovascular Systems Inc, Medtronic, Philips, and PQ Bypass. Dr Secemsky reports grants and modest consulting fees from Medtronic. Dr. Giannopoulos reports no conflicts. Dr. Adams reports consulting fees from Bard Peripheral Vascular, Terumo Interventional Systems, Medtronic, Boston Scientific, Spectranetics, and Cardiovascular Systems, Inc. Dr. Mustapha reports consultancy with Bard Peripheral Vascular, Boston Scientific, Cardiovascular Systems Inc., Medtronic, Spectranetics, and Terumo. Dr. Cohen reports grant support from Abbott Vascular, Boston Scientific, Edwards Lifesciences, Medtronic, Svelte, and Corvia, and consulting fees from Abbott Vascular, Boston Scientific, Edwards Lifesciences, and Medtronic.
JME peer reviewers on this manuscript have received an honorarium from JME for their review work but have no other relevant financial relationships to disclose.
Supplemental Material
Download MS Word (438.5 KB)Acknowledgements
The authors wish to thank Ann Behrens and Brad J. Martinsen, PhD, of Cardiovascular Systems Inc., for their support of this study.
References
- Roger VL, Go AS, Lloyd-Jones DM, et al. Heart disease and stroke statistics–2011 update: a report from the american heart association. Circulation. 2011;123(4):e18–e209.
- Hirsch AT, Criqui MH, Treat-Jacobson D, et al. Peripheral arterial disease detection, awareness, and treatment in primary care. JAMA. 2001;286(11):1317–1324.
- Steg PG, Bhatt DL, Wilson PW, et al. One-year cardiovascular event rates in outpatients with atherothrombosis. JAMA. 2007;297(11):1197–1206.
- Rutherford RB, Baker JD, Ernst C, et al. Recommended standards for reports dealing with lower extremity ischemia: revised version. J Vasc Surg. 1997;26(3):517–538.
- Duff S, Mafilios MS, Bhounsule P, et al. The burden of critical limb ischemia: a review of recent literature. Vasc Health Risk Manag. 2019;15:187–208.
- O’Brien-Irr MS, Harris LM, Dosluoglu HH, et al. Procedural trends in the treatment of peripheral arterial disease by insurer status in new york state. J Am Coll Surg. 2012;215(3):311–321 e311.
- Reinecke H, Unrath M, Freisinger E, et al. Peripheral arterial disease and critical limb ischaemia: still poor outcomes and lack of guideline adherence. Eur Heart J. 2015;36(15):932–938.
- Gerhard-Herman MD, Gornik HL, Barrett C, et al. 2016 aha/acc guideline on the management of patients with lower extremity peripheral artery disease: a report of the American college of cardiology/American heart association task force on clinical practice guidelines. Circulation. 2017;135(12):e726–e779.
- Hasvold P, Nordanstig J, Kragsterman B, et al. Long-term cardiovascular outcome, use of resources, and healthcare costs in patients with peripheral artery disease: results from a nationwide swedish study. Eur Heart J Qual Care Clin Outcomes. 2018;4(1):10–17.
- Mahoney EM, Wang K, Keo HH et al. Reduction of Atherothrombosis for Continued Health Registry I. Vascular hospitalization rates and costs in patients with peripheral artery disease in the united states. Circ Cardiovasc Qual Outcomes. 2010;3(6):642–651.
- Adams GL, Mustapha J, Gray W, et al. The liberty study: design of a prospective, observational, multicenter trial to evaluate the acute and long-term clinical and economic outcomes of real-world endovascular device interventions in treating peripheral artery disease. Am Heart J. 2016;174:14–21.
- Mustapha J, Gray W, Martinsen BJ, et al. One-year results of the liberty 360 study: evaluation of acute and midterm clinical outcomes of peripheral endovascular device interventions. J Endovasc Ther. 2019;26(2):143–154.
- Jaff MR, White CJ, Hiatt WR, et al. An update on methods for revascularization and expansion of the tasc lesion classification to include below-the-knee arteries: a supplement to the inter-society consensus for the management of peripheral arterial disease (tasc ii): The tasc steering comittee(.). Ann Vasc Dis. 2015;8(4):343–357.
- Yin D, Maehara A, Shimshak TM, et al. Intravascular ultrasound validation of contemporary angiographic scores evaluating the severity of calcification in peripheral arteries. J Endovasc Ther. 2017;24(4):478–487.
- Bang H, Tsiatis AA. Estimating medical costs with censored data. Biometrika. 2000;87(2):329–343.
- Efron B. Better bootstrap confidence intervals. J Am Stat Assoc. 1987;82(397):171–185.
- McCullagh P, Nelder JA. Generlized linear models. London, UK: Chapman and Hall; 1989.
- Kolte D, Kennedy KF, Shishehbor MH, et al. Thirty-day readmissions after endovascular or surgical therapy for critical limb ischemia: analysis of the 2013 to 2014 nationwide readmissions databases. Circulation. 2017;136(2):167–176.
- Secemsky EA, Schermerhorn M, Carroll BJ, et al. Readmissions after revascularization procedures for peripheral arterial disease: a nationwide cohort study. Ann Intern Med. 2018;168(2):93–99.
- Martinez RA, Shnayder M, Parreco J, et al. Nationally representative readmission factors in patients with claudication and critical limb ischemia. Ann Vasc Surg. 2018;52:96–107.
- Centers for medicare & medicaid services 100% medpar inpatient hospital national data for fiscal year. 2008. short stay inpatient diagnosis related groups.
- Mustapha JA, Katzen BT, Neville RF, et al. Determinants of long-term outcomes and costs in the management of critical limb ischemia: a population-based cohort study. J Am Heart Assoc. 2018;7(16):e009724.
- Mills JL. Sr. Best-cli trial on the homestretch. J Vasc Surg. 2019;69(2):313–314.
- Stroupe KT, Lederle FA, Matsumura JS, et al. Open versus endovascular repair veterans affairs cooperative study G. cost-effectiveness of open versus endovascular repair of abdominal aortic aneurysm in the over trial. J Vasc Surg. 2012;56(4):901–909 e902.