
Abstract
Aims
Patients with cancer are at high risk of venous thromboembolism (VTE), which entails a high economic burden. The risk of cancer-associated VTE can be assessed using the Khorana score (KS), a validated VTE risk prediction algorithm. This study compared healthcare costs associated with different KS in a population of patients newly diagnosed with cancer.
Methods
The Optum Clinformatics DataMart database (01/01/2012–09/30/2017) was used to select adult patients with ≥1 hospitalization or ≥2 outpatient claims with a cancer diagnosis (index date) initiated on systemic therapy or radiation therapy. Patients were classified in mutually exclusive cohorts based on KS (i.e. KS = 0, 1, 2 or ≥3). The observation period spanned from index to the earliest among the end of data availability, death, end of insurance coverage, or 12 months.
Results
In total 6,194 patients (KS = 0: 2,488; KS = 1: 2,125; KS = 2: 1,074; KS ≥ 3: 507) were included. On average, patients were aged 68 years, 48–52% were female, and the Quan–Charlson comorbidity index ranged between 1.1 and 1.4. Over the observation period, all-cause total healthcare costs per patient per month (PPPM) were $8,826 (KS = 0), $11,598 (KS = 1), $14,028 (KS = 2), and $16,211 (KS ≥ 3). Using the KS = 0 cohort as a reference, adjusted PPPM costs were $2,506, $4,775, and $6,452 higher in the KS = 1, KS = 2, and KS ≥ 3 cohorts, respectively. Hospitalization and outpatient costs were the main drivers of these differences. Similar results were found for VTE-related costs, which represented 4–11% of the total all-cause cost difference between KS cohorts.
Limitations
Residual confounders; results may not be generalized to patients with other insurance plans or those who received treatments other than systemic therapy or radiation therapy.
Conclusions
This real-world analysis found that cancer patients at higher risk of VTE (based on KS) incurred significantly greater all-cause and VTE-related healthcare costs compared with cancer patients at lower risk of VTE.
Introduction
Cancer is a major risk factor for venous thromboembolism (VTE), which includes deep vein thrombosis and pulmonary embolismCitation1–3. Specifically, the risk of VTE is increased by four to seven-fold in patients with cancerCitation1,Citation3, and those with cancer and treated with systemic therapy are at even higher riskCitation2,Citation3. In addition to causing high morbidity and mortality, cancer-associated VTE imposes a substantial cost burden for healthcare systemsCitation4–9.
The Khorana score (KS) is a validated clinical risk assessment toolCitation10–24 endorsed by current guidelinesCitation25,Citation26 to predict the risk of VTE in patients with cancer. This score is derived from different risk factors for VTE, including the tumor’s primary site, pre-chemotherapy platelet count, hemoglobin levels <100 g/L or use of red blood cell growth factors, pre-chemotherapy leukocyte count >11 × 109/L, and body mass index (BMI) ≥35 kg/m2 Citation27. Several previous studies used this score to identify patients with cancer at high risk of VTE (i.e. KS ≥2 or ≥3) and assess the efficacy and safety of primary thromboprophylaxis in this subgroupCitation24,Citation28–31.
Patients with cancer at high risk of VTE may incur higher healthcare costs than those at lower risk due to increased risk of early mortality and cancer progressionCitation32–34, along with greater burden of VTE-related expenses and ensuing complications, including VTE recurrences, post-thrombotic syndrome, and pulmonary hypertensionCitation35. However, among studies that assessed the economic burden of cancer-associated VTE, none stratified patients into different VTE risk cohorts. Such information may provide preliminary insight into the economic impact that may ensue from VTE prophylaxis in patients at high risk of VTE. Therefore, this study sought to compare healthcare costs in newly diagnosed cancer patients treated with various cancer treatments stratified by risk of VTE using the KS clinical algorithm.
Methods
Data source
The Optum Clinformatics Data Mart database was used with data from January 2012 to September 2017. The database covers 12–14 million annual lives in all census regions of the United States. It contains more than 36 months of historical data on patients (claims from commercial and Medicare Advantage plans, including patients’ demographics, dates of eligibility, inpatient, outpatient, and pharmacy claims, laboratory tests and results, and date of death). Data from the Optum Clinformatics Data Mart database are de-identified and fully compliant with the confidentiality requirements of the Health Insurance Portability and Accountability Act.
Study design
This study used a retrospective cohort study design, with the index date defined as the date of the first diagnosis of cancer with at least six months of continuous eligibility before the index date (i.e. baseline period). Cancer treatment initiation was assessed during the 45 days following the index date to avoid including patients for whom treatment initiation was inappropriately delayed. Laboratory values required for the calculation of the KS were collected and assessed during the 28 days prior to the initiation of cancer treatment (i.e. the risk stratification period), and this period may overlap with the baseline period. The observation period covered the period from the index date up to the earliest among the end of data availability, death, 12 months post-index, or end of insurance coverage.
Study population
Patients were included if they met the following criteria: (1) ≥18 years of age on the index date; (2) ≥1 hospitalization or ≥2 outpatient visits with a diagnosis of cancer (i.e. International Classification of Diseases, Ninth Revision, Clinical Modification [ICD-9-CM]: 140‒209; ICD-10-CM: C00‒C7A); (3) treated with systemic therapy (based on the list from the National Cancer InstituteCitation36) or radiation therapy within 45 days post-index date (i.e. index cancer treatment); (4) ≥6 months of continuous eligibility during the baseline period; and (5) ≥1 laboratory test result for hemoglobin, platelet, and leukocyte counts during the 28-day risk stratification period ().
Figure 1. Patient disposition. Abbreviations. AC, anticoagulant; AF, atrial fibrillation; VTE, venous thromboembolism. 1Cancer treatment included non-radiation and radiation therapies. 2Defined as a procedure code for major surgery, abdominopelvic surgery, and neurosurgery or orthopedic surgery during an inpatient stay.
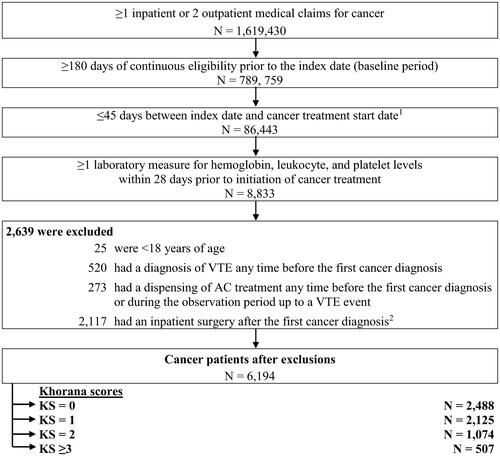
The following exclusion criteria were applied: (1) had a VTE event during the baseline period; (2) used anticoagulants any time prior to the index date or up until a VTE event during the follow-up period; or (3) had an inpatient surgery after the index date, defined as a procedure code for major surgery, abdominopelvic surgery, and neurosurgery or orthopedic surgery during an inpatient stay (). Note that major surgery did not include surgical resection of cancer.
Study outcomes
All-cause and VTE-related healthcare costs were evaluated and broken down into medical (i.e. hospitalization, emergency room [ER] visit, outpatient visit, and other visit costs) and pharmacy costs. Other visits included visits such as home service and hospice. VTE-related costs were defined as costs associated with medical claims with a primary or secondary diagnosis of VTEFootnotei. VTE-related pharmacy costs were defined as costs associated with anticoagulant dispensing.
Statistical analysis
Baseline characteristics, overall and stratified by KS risk cohorts, were reported using descriptive statistics. More specifically, frequencies and proportions were used to summarize categorical variables; means, standard deviations, and medians were used to summarize continuous variables.
All-cause and VTE-related healthcare costs were evaluated during the observation period for each KS cohort and reported per-patient-per-month (PPPM). Moreover, costs were inflation-adjusted to 2018 USD. Cost differences between KS cohorts were computed using multivariable linear regression models adjusting for age, sex, insurance type, region, year and month of the index date, Quan-Charlson comorbidity index (CCI) score, Elixhauser comorbiditiesCitation37 with a proportion ≥5%, and healthcare resource utilization and costs. p-values and 95% confidence intervals (CIs) were obtained using non-parametric bootstrap procedures with 499 replications.
Results
A total of 6,194 cancer patients were selected, including 2,488 (40.2%) classified in the KS = 0 cohort, 2,125 (34.3%) in the KS = 1 cohort, 1,074 (17.3%) in the KS = 2 cohort, and 507 (8.2%) in the KS ≥3 cohort ().
Baseline characteristics
The mean age of patients was 68.0 years (range, 18 to 90 years) and 48.8% were female (). The study population had good geographical representation across the four US census regions. Lung (16.8%), breast (14.3%), and prostate cancer (10.2%) were the most common malignancies at the index date, and systemic therapy was the index cancer treatment for 62.3% of patients. The mean CCI was 1.2, which did not vary substantially across KS cohorts. In each KS cohort, the top three most common Elixhauser comorbidities were hypertension (range: 62.3%–71.8%), chronic pulmonary disease (range: 22.1%–41.6%), and hypothyroidism (range: 19.8%–22.9%), with higher rates in the higher KS cohorts. The mean all-cause total healthcare costs were $8,689 among all patients and ranged between $7,864 and $9,542 in the KS cohorts. Hospitalization costs and outpatient visit costs accounted for the majority of the baseline cost differences between KS cohorts.
Table 1. Demographic and clinical characteristics.
Healthcare costs of patients stratified by Khorana score
The observation period, which was truncated at 12 months following the index date, lasted an average of 9.6 months in the KS = 0 cohort, 8.7 months in the KS = 1 cohort, 8.0 months in the KS = 2 cohort, and 6.9 months in the KS ≥3 cohort (). Over this period, total all-cause healthcare costs averaged $8,826 PPPM for patients in the KS = 0 cohort, $11,598 for those in the KS = 1 cohort, $14,028 for those in the KS = 2 cohort, and $16,211 for those in the KS ≥3 cohort (). The main drivers of the total all-cause healthcare costs PPPM were outpatient visit costs (KS = 0: $5,855, KS = 1: $6,860, KS = 2: $7,380, KS ≥3: $7,671), which accounted for 47.3%–66.3% of total costs (). Hospitalization costs (KS = 0: $1,217, KS = 1: $2,118, KS = 2: $3,633, KS ≥3 $4,915) accounted for 13.8%–30.3% of total costs.
Figure 2. All-cause total healthcare costs per patient per month up to 12 months of follow-up. Abbreviation. KS, Khorana score. *Defines p-value <.05. 1Calculated using linear regressions. p-values were obtained using nonparametric bootstraps with 499 replications. 2Adjusted for the following variables: sex, age, index year, region, insurance type, Charlson comorbidity index, baseline healthcare resource use and costs, and comorbidities with proportions ≥5% at baseline (e.g. hypertension and chronic pulmonary disease).
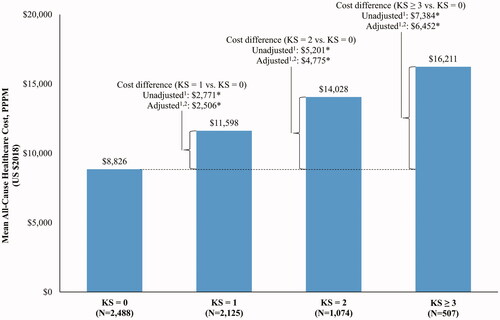
Table 2. Healthcare costs per patient per month up to 12 months of follow-up.
After adjusting for baseline covariates, costs PPPM were $2,506 higher in the KS = 1 cohort, $4,775 higher in the KS = 2 cohort, and $6,452 higher in the KS ≥3 cohort relative to the KS = 0 cohort (all p < .05; ). Across all comparisons, hospitalization costs were the primary drivers of the total cost differences, representing 35.3%, 48.3%, and 52.9% of the total cost difference for the comparison of KS = 1, KS = 2, and KS ≥3 versus KS = 0, respectively (). The second most important driver was outpatient visit costs, representing 36.7%, 28.4%, and 22.9% of the total cost difference for the comparison of KS = 1, KS = 2, and KS ≥3 versus KS = 0, respectively.
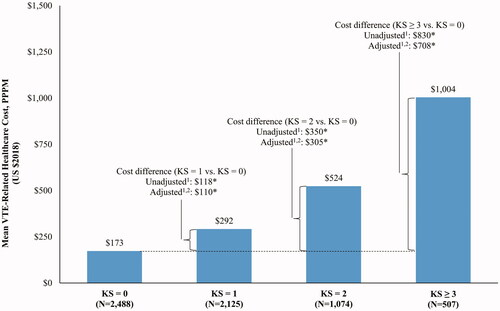
VTE-related costs increased with increasing risk and were significantly higher among patients with KS = 1, KS = 2, or KS ≥3 compared to those with KS = 0 (all p < .05; ). Similar to all-cause costs, VTE-related hospitalization (49.1%–78.0%) and VTE-related outpatient costs (9.5%–21.8%) accounted for the majority of the difference in healthcare costs ( and ).
Figure 3. VTE-related total healthcare costs per patient per month up to 12 months of follow-up. Abbreviation. KS, Khorana score; VTE, venous thromboembolism. *Defines p-value <.05. 1Calculated using linear regressions. p-values were obtained using nonparametric bootstraps with 499 replications. 2Adjusted for the following variables: sex, age, index year, region, insurance type, Charlson comorbidity index, baseline healthcare resource use and costs, and comorbidities with proportions ≥5% at baseline (e.g. hypertension and chronic pulmonary disease).
Discussion
In this retrospective cohort study of patients newly diagnosed with cancer, healthcare costs were evaluated and stratified by patients’ risk of VTE. All-cause total healthcare costs increased with increasing risk of VTE, with a cost difference of $6,452 PPPM between the KS ≥3 and KS = 0 cohorts up to 12 months of follow-up. Hospitalization costs were the main driver of the observed cost differences, and outpatient visit costs also accounted for a substantial portion of the cost differences. Similar patterns were observed for VTE-related costs, which were $708 PPPM higher in the KS ≥3 cohort versus the KS = 0 cohort. Altogether, these results emphasize that patients with cancer at risk of VTE incur substantial incremental healthcare costs.
Previous studies that assessed the healthcare costs of cancer-associated VTE compared the costs of cancer patients with versus without VTE. These studies invariably found higher total healthcare costs in cancer patients with VTE relative to those without VTECitation4–9. Nonetheless, the populations assessed in these studies often differed relative to that of the current study with regards to the location of the primary tumor (i.e. only patients with lung cancerCitation5 or specific cancer typesCitation6,Citation7 rather than any cancer type) and patient disease history (i.e. prevalent cancer casesCitation4,Citation5 rather than newly diagnosed patients); one study focused on the costs of hospitalizationCitation9. There was also substantial heterogeneity in the reporting of healthcare costs; prior studies reported costs incurred after a first VTE eventCitation4,Citation6, after the initiation of chemotherapyCitation5,Citation7, or after the initiation of anticoagulationCitation8 as opposed to post-cancer diagnosis in the current study. Further, some studies reported costs over follow-up that extended up to three or five yearsCitation4,Citation8, as opposed to 12 months in the current study. Among studies that reported healthcare costs over 12 months (i.e. post-VTE or post-chemotherapy initiation), total all-cause healthcare costs ranged from $6,246 to $9,227 PPPM among patients with VTECitation5–7, which is lower than the estimate in our study (weighted average across KS cohorts: $11,283 PPPM). This may be due to the aforementioned differences in study design and study population, as well as the study periods assessed (current study: 2012–2017, prior studies [range]: 2004–2009). Furthermore, differences in the proportion of patients with an advanced cancer stage, which is associated with a higher risk of VTECitation38, might also partially explain the difference in costs between the current study versus prior studiesFootnoteii; however, information on cancer stage was not available in this and most previous studies. These differences highlight that the current study builds on the existing literature by evaluating healthcare costs among newly diagnosed patients with cancer stratified by the risk of subsequent VTE, as assessed by the KS.
In the current study, both all-cause and VTE-related healthcare costs significantly increased with KS. All-cause healthcare costs were predominantly driven by non-VTE-related costs across all KS cohorts in the current study, which aligns with previous studies that have found KS to be predictive of early mortality and cancer progression during the first four cycles of outpatient chemotherapy, independent from other major prognostic factors including VTE itselfCitation32–34.
The VTE-related healthcare cost findings suggest that VTE and associated complications (e.g. post-thrombotic syndrome, and pulmonary hypertensionCitation35) entail higher costs among patients at high risk compared with those at low risk. Notably, hospitalization costs were the main driver of the difference in VTE-related and all-cause costs, highlighting the substantial costs associated with the inpatient management of VTE. In addition, VTE may have translated into higher costs related to the management of cancer, where VTE can delay or interrupt adjuvant chemotherapyCitation39 and other comorbidities. In addition to the management of the VTE event itself, the occurrence of VTE may complicate the management of comorbidities, which are highly prevalent in the cancer populationCitation40–42. For example, potential drug–drug interactions with anticoagulants may necessitate the modification or temporary withdrawal of medications used to treat certain comorbidities, leading to adverse health outcomes and higher costs. Further studies are needed to better understand how VTE may affect comorbidities and healthcare costs among patients with cancer.
The population analyzed in the current study has been evaluated by our group in a previous study that assessed patients’ risk of VTE and death stratified by KSCitation43. In that study, patients with KS = 1, KS = 2, and KS ≥3 had a 1.72, 2.46, and 4.99 times greater risk of VTE, respectively, relative to those with KS = 0 up to 12 months of follow-up. This increased risk of VTE was also associated with significantly greater all-cause mortality. Notably, patients with VTE were approximately seven times more likely to die prematurely relative to those who did not develop VTE among the KS = 0 cohort. Therefore, the higher rates of VTE and mortality documented in our previous study corroborate the higher costs found in this study for patients at high risk of VTE.
Recent results from the CASSINI (rivaroxaban vs. placebo)Citation44 and AVERT (apixaban vs. placebo)Citation45 trials have shown that primary VTE prophylaxis with the direct oral anticoagulants rivaroxaban or apixaban reduces the risk of VTE in patients with cancer and a KS ≥2. This evidence led the American Society of Clinical Oncology and the International Society on Thrombosis and Haemostasis to formulate a new recommendation to offer rivaroxaban or apixaban for primary VTE prophylaxis in ambulatory patients with cancerCitation46–48. By assessing healthcare costs stratified by KS, the present study provides insights for future studies to assess the potential savings that might ensue from interventions to reduce VTE rates in high-risk patients.
Limitations
The current study is subject to important limitations. First, included patients were treated with either systemic therapy or radiation therapy, and results may not apply to patients receiving other cancer treatments, such as newer therapies (e.g. CAR-T) or surgical procedures. Second, this claims-based study may also be subject to residual confounding due to unrecognized or unmeasured potential confounding factors. Third, BMI was evaluated using ICD codes on health insurance claims, which may have led to an underestimation of the KS. Fourth, these results may have limited generalizability to the uninsured US population, patients with health insurance plans that differ from those of the population analyzed in this study, or non-US populations. Finally, there is the potential for health insurance claims to have coding omissions and inaccuracies.
Conclusions
In this large real-world retrospective claims analysis, patients newly diagnosed with cancer who were at higher risk of VTE incurred significantly greater all-cause and VTE-related healthcare costs compared to patients with a lower risk of VTE. VTE-related costs represented 4% to 11% of the total costs difference for KS = 0 to KS ≥3 cohorts and were mainly driven by VTE-related hospitalization costs. Even though VTE-related costs may appear to be a modest proportion of the total cost difference among this high burden population, primary VTE prophylaxis in cancer patients with a KS ≥2 could potentially reduce the costs and consequences of VTE in the higher risk subgroups.
Transparency
Declaration of funding
This work was supported by Janssen Scientific Affairs, LLC.
Declaration of financial/other relationships
G.G., F.L., S.D.M., and P.L. are employees of Groupe d’Analyse, Ltée, a consulting company that provided paid consulting services to Janssen Scientific Affairs, LLC. for the conduct of the present study.
D.M. is an employee of Janssen Scientific Affairs and a shareholder of Johnson & Johnson.
A.A.K., N.M.K., K.M.C., G.H.L., and M.B.S. have received research funds from Janssen Scientific Affairs.
JME peer reviewers on this manuscript have no relevant financial or other relationships to disclose.
Author contributions
All authors were involved in the conception and design, or analysis and interpretation of the data; the drafting of the paper or revising it critically for intellectual content; and approved the version to be published; all authors agree to be accountable for all aspects of the work.
Previous presentation
Part of the material in this manuscript was presented at the 60th American Society of Hematology (ASH) held 1–4 December 2018 in San Diego, CA.
Acknowledgements
Medical writing assistance was provided by Samuel Rochette, an employee of Analysis Group, Inc., a consulting company that has provided paid consulting services to Janssen Scientific Affairs, LLC, which funded the development and conduct of this study and manuscript.
Notes
i Overall, 67.7% of VTE-related hospitalizations during follow-up (up to 12 months) had a primary diagnosis of VTE (KS = 0: 69.8%; KS = 1: 65.6%; KS = 2: 65.0%; KS ≥ 3: 72.4%).
ii Using secondary neoplasm ICD codes as a proxy for metastasis, 13.8% of patients in the present study had metastasis on the index date (KS = 0: 10.4%; KS = 1: 12.4%; KS = 2: 18.3%; KS ≥ 3: 27.0%). When extending to within one month after the index date, 28.3% of patients had metastasis (KS = 0: 21.3%; KS = 1: 26.9%; KS = 2: 36.5%; KS ≥ 3: 50.9%).
References
- Blom JW, Doggen CJ, Osanto S, et al. Malignancies, prothrombotic mutations, and the risk of venous thrombosis. JAMA. 2005;293(6):715–722.
- Blom JW, Vanderschoot JP, Oostindier MJ, et al. Incidence of venous thrombosis in a large cohort of 66,329 cancer patients: results of a record linkage study. J Thromb Haemost. 2006;4(3):529–535.
- Heit JA, Silverstein MD, Mohr DN, et al. Risk factors for deep vein thrombosis and pulmonary embolism: a population-based case-control study. Arch Intern Med. 2000;160(6):809–815.
- Cohoon KP, Ransom JE, Leibson CL, et al. Direct medical costs attributable to cancer-associated venous thromboembolism: a population-based longitudinal study. Am J Med. 2016;129(9):1000.e15–1000.25.
- Connolly GC, Dalal M, Lin J, et al. Incidence and predictors of venous thromboembolism (VTE) among ambulatory patients with lung cancer. Lung Cancer. 2012;78(3):253–258.
- Khorana AA, Dalal MR, Lin J, et al. Health care costs associated with venous thromboembolism in selected high-risk ambulatory patients with solid tumors undergoing chemotherapy in the United States. Clinicoecon Outcomes Res. 2013;5:101–108.
- Lyman GH, Eckert L, Wang Y, et al. Venous thromboembolism risk in patients with cancer receiving chemotherapy: a real-world analysis. Oncologist. 2013;18(12):1321–1329.
- Shah S, Rubin N, Khorana AA. Economic burden of venous thromboembolism in cancer patients—a comparative analysis between matched patients with cancer with and without a diagnosis of venous thromboembolism. Blood. 2018;132(Supplement 1):366–366.
- Lyman GH, Culakova E, Poniewierski MS, et al. Morbidity, mortality and costs associated with venous thromboembolism in hospitalized patients with cancer. Thromb Res. 2018;164(Suppl 1):S112–s8.
- Ay C, Dunkler D, Marosi C, et al. Prediction of venous thromboembolism in cancer patients. Blood. 2010;116(24):5377–5382.
- Cella CA, Di Minno G, Carlomagno C, et al. Preventing venous thromboembolism in ambulatory cancer patients: the ONKOTEV study. Oncol. 2017;22(5):601–608.
- Douce D, Holmes CE, Cushman M, et al. Enhancing the Khorana score: traditional VTE risk factors are important in predicting long term VTE risk in cancer patients initiating chemotherapy. Blood. 2017;130(Supplement 1):753.
- Hohl Moinat C, Periard D, Grueber A, et al. Predictors of venous thromboembolic events associated with central venous port insertion in cancer patients. J Oncol. 2014;2014:743181.
- Kearney JC, Rossi S, Glinert K, et al. Venous thromboembolism (VTE) and survival in a cancer chemotherapy outpatient clinic: a retrospective chart review validation of a VTE predictive model. Blood. 2009;114(22):2503.
- Khorana AA, Rubens D, Francis CW. Screening high-risk cancer patients for VTE: a prospective observational study. Thromb Res. 2014;134(6):1205–1207.
- Lustig DB, Rodriguez R, Wells PS. Implementation and validation of a risk stratification method at The Ottawa Hospital to guide thromboprophylaxis in ambulatory cancer patients at intermediate-high risk for venous thrombosis. Thromb Res. 2015;136(6):1099–1102.
- Mandala M, Clerici M, Corradino I, et al. Incidence, risk factors and clinical implications of venous thromboembolism in cancer patients treated within the context of phase I studies: the ‘SENDO experience’. Ann Oncol. 2012;23(6):1416–1421.
- Moore RA, Adel N, Riedel E, et al. High incidence of thromboembolic events in patients treated with cisplatin-based chemotherapy: a large retrospective analysis. J Clin Oncol. 2011;29(25):3466–3473.
- Parker A, Peterson E, Lee AYY, et al. Risk stratification for the development of venous thromboembolism in hospitalized patients with cancer. J Thromb Haemost. 2018;16(7):1321–1326.
- Patell R, Rybicki L, McCrae KR, et al. Predicting risk of venous thromboembolism in hospitalized cancer patients: utility of a risk assessment tool. Am J Hematol. 2017;92(6):501–507.
- Posch F, Riedl J, Reitter EM, et al. Hypercoagulabilty, venous thromboembolism, and death in patients with cancer. A multi-state model. Thromb Haemost. 2016;115(04):817–826.
- Santi RM, Ceccarelli M, Bernocco E, et al. Khorana score and histotype predicts incidence of early venous thromboembolism in non-Hodgkin lymphomas. A pooled-data analysis of 12 clinical trials of Fondazione Italiana Linfomi (FIL). Thromb Haemost. 2017;117(8):1615–1621.
- Van Es N, Ventresca M, Zhou Q, et al. The Khorana score for the prediction of venous thromboembolism in patients with solid cancer: an individual patient data meta-analysis. J Thromb Haemost. 2017;18(8):1940–1951.
- Verso M, Agnelli G, Barni S, et al. A modified Khorana risk assessment score for venous thromboembolism in cancer patients receiving chemotherapy: the Protecht score. Intern Emerg Med. 2012;7(3):291–292.
- Lyman GH, Bohlke K, Khorana AA, et al. Venous thromboembolism prophylaxis and treatment in patients with cancer: American society of clinical oncology clinical practice guideline update 2014. J Clin Oncol. 2015;33(6):654–656.
- National Comprehensive Cancer Network. Cancer-associated venous thromboembolic disease Version 2.2018 2018 [cited 2018 August 30]. Available from: https://www.nccn.org/professionals/physician_gls/pdf/vte.pdf
- Khorana AA, Kuderer NM, Culakova E, et al. Development and validation of a predictive model for chemotherapy-associated thrombosis. Blood. 2008;111(10):4902–4907.
- Khorana AA, Soff GA, Kakkar AK, et al. Rivaroxaban for thromboprophylaxis in high-risk ambulatory patients with cancer. N Engl J Med. 2019;380(8):720–728.
- George D, Agnelli G, Fisher W, et al. Venous thromboembolism (VTE) prevention with semuloparin in cancer patients initiating chemotherapy: benefit-risk assessment by VTE risk in SAVE-ONCO. Blood. 2011;118(21):206.
- Khorana AA, Francis CW, Kuderer NM, et al. Dalteparin thromboprophylaxis in cancer patients at high risk for venous thromboembolism: a randomized trial. Thromb Res. 2017;151:89–95.
- Carrier M, Abou-Nassar K, Mallick R, et al. Apixaban to prevent venous thromboembolism in patients with cancer. N Engl J Med. 2019;380(8):711–719.
- Kuderer NM, Culakova E, Lyman GH, et al. A validated risk score for venous thromboembolism is predictive of cancer progression and mortality. Oncologist. 2016;21(7):861–867.
- Sohal DPS, Kuderer NM, Shepherd FA, et al. Clinical predictors of early mortality in colorectal cancer patients undergoing chemotherapy: results from a global prospective cohort study. JNCI Cancer Spectrum. 2017;1(1):pkx009.
- Kuderer NM, Poniewierski MS, Culakova E, et al. Predictors of venous thromboembolism and early mortality in lung cancer: results from a global prospective study (CANTARISK). Oncol. 2018;23(2):247–255.
- Dobesh PP. Economic burden of venous thromboembolism in hospitalized patients. Pharmacotherapy. 2009;29(8):943–953.
- Cancer Research Network. Cancer Therapy Look-up Tables [cited 2019 August 27]. Available from: http://www.hcsrn.org/crn/en/RESEARCH/LookupTables/
- Elixhauser A, Steiner C, Kruzikas D. Comorbidity software documentation. Rockville, MD: Agency for Healthcare Research and Quality; 2004.
- Gade IL, Braekkan SK, Naess IA, et al. The impact of initial cancer stage on the incidence of venous thromboembolism: the Scandinavian thrombosis and cancer (STAC) cohort. J Thromb Haemost. 2017;15(8):1567–1575.
- Merkow RP, Bilimoria KY, Tomlinson JS, et al. Postoperative complications reduce adjuvant chemotherapy use in resectable pancreatic cancer. Ann Surg. 2014;260(2):372–377.
- Sturgeon KM, Deng L, Bluethmann SM, et al. A population-based study of cardiovascular disease mortality risk in US cancer patients. Eur Heart J. 2019;40(48):3889–3897.
- Holland JC, Andersen B, Breitbart WS, et al. Distress management. J Natl Compr Canc Netw. 2013;11(2):190–209.
- Rosner MH, Perazella MA. Acute kidney injury in patients with cancer. N Engl J Med. 2017;376(18):1770–1781.
- Khorana AA, Kuderer NM, McCrae K, et al. Cancer associated thrombosis and mortality in patients with cancer stratified by Khorana score risk levels. Cancer Med. 2020;9(21):8062–8073.
- Khorana AA, Vadhan-Raj S, Kuderer NM, et al. Rivaroxaban for preventing venous thromboembolism in high-risk ambulatory patients with cancer: rationale and design of the CASSINI trial. Rationale and design of the CASSINI trial. Thromb Haemost. 2017;117(11):2135–2145.
- Kimpton M, Wells PS, Carrier M. Apixaban for the prevention of venous thromboembolism in high-risk ambulatory cancer patients receiving chemotherapy: rational and design of the AVERT trial. Thromb Res. 2018;164(Suppl 1):S124–S9.
- Key NS, Khorana AA, Kuderer NM, et al. Venous thromboembolism prophylaxis and treatment in patients with cancer: ASCO clinical practice guideline update. J Clin Oncol. 2019:JCO1901461.
- Wang TF, Zwicker JI, Ay C, et al. The use of direct oral anticoagulants for primary thromboprophylaxis in ambulatory cancer patients: guidance from the SSC of the ISTH. J Thromb Haemost. 2019;17(10):1772–1778.
- Streiff MB, Holmstrom B, Angelini D, et al. NCCN guidelines insights: cancer-associated venous thromboembolic disease, version 2.2018. J Natl Compr Canc Netw. 2018;16(11):1289–1303.