
Abstract
Aims: The aim of this study was to estimate the cost-effectiveness of nivolumab versus everolimus for second-line treatment of renal cell carcinoma (RCC) based on mature data, updated safety and decreased everolimus price.
Materials and methods: A 3-state (pre-progression/progression-free disease, progressive disease and death) Markov model was developed from the perspective of the Australian health care system. Two scenarios were tested. Scenario 1 used 30-months clinical data and scenario 2 used updated 80-months clinical data with updated everolimus price. Inputs for quality-of-life and costs were informed by the literature and government sources. Incremental cost-effectiveness ratio (ICER) per quality adjusted life years (QALY) gained was reported and an ICER threshold of AU$75,000 was assumed. Threshold analysis was performed, and uncertainty was explored using one-way and probabilistic sensitivity analyses.
Results: In scenario 1, the model estimated 1.73 QALYs at a cost of AU$105,000 for nivolumab and 1.48 QALYs at AU$38,000 for everolimus with an ICER = AU$266,871/QALY gained. A rebate of 54.4% was needed for nivolumab to reach the ICER threshold. For scenario 2, 1.93 QALYs at AU$111,418 was estimated for nivolumab and 1.60 QALYs at AU$31,942 for everolimus with an ICER of AU$213,320/QALY gained. The rebate needed to reach the ICER threshold was 54.9%. One-way sensitivity analyses for both scenarios showed that the cost of nivolumab, time horizon and utilities were main drivers. The cost-effectiveness acceptability curves highlighted the differences in cost-effectiveness of the two scenarios, as well as significant uncertainty in the results.
Conclusions: A 54% rebate of the published price is needed for nivolumab to be cost-effective in Australia for the treatment of RCC. At that rebate, nivolumab remains cost-effective despite severe price erosion of everolimus because of improved longer term follow-up data. We recommend that generic price erosion should be accounted for when performing cost-effectiveness analysis.
Introduction
Kidney cancer is the ninth most common cancer diagnosed in Australia, with 3814 estimated cases and an age-standardized rate of 12.9 per 100,000 in 2019Citation1. Renal cell carcinoma (RCC) accounts for approximately 90% of adult malignant kidney cancer cases in Australia. International five-year survival rates for metastatic (stage IV) kidney and renal pelvis cancer are estimated at between 12-20%Citation2,Citation3, These data suggest a significant unmet clinical need.
Everolimus was the most commonly used second-line agent for patients with stage-IV clear cell variant RCC in Australia prior to 2017, with more than 90% market shareCitation4. Everolimus was accepted for listing on the government-subsidized Australian Pharmaceutical Benefit Scheme (PBS) with a special pricing arrangement in 2014Citation5,Citation6. A special pricing arrangement between the Australian government and a sponsor leads to a discounted “effective price” which includes arrangements whereby the government recovers a percentage of the expenditure through commercial-in-confidence rebatesCitation7. The special pricing arrangement for everolimus ended in June 2018 following patent expiry, at which time a second generic brand was launched in AustraliaCitation6. As a result, everolimus was subjected to price disclosure, whereby the sponsor had to publicly disclose the volume and rebates given to the government. In price disclosures, if the effective price is 90% or less of the listed price on the PBS, the listed price of the drug is then lowered accordingly to reflect the actual priceCitation8.
Nivolumab, a fully human immunoglobulin monoclonal antibody which binds to the programmed death-1 (PD-1) receptor on T-cells, was listed on the PBS in 2017 for the treatment of advanced RCC. Initial results from the pivotal phase-III clinical trial with 30 months of data were published in November 2015Citation9. They showed that nivolumab reduces mortality as measured by overall survival (OS) (hazard ratio [HR] = 0.73, 98.5% confidence interval [CI] 0.57 to 0.93) compared with everolimus. The hazard ratio for progression-free survival (PFS) was 0.88, but the result was not statistically significant (95% CI: 0.75 to 1.03, p = .11).
Nivolumab was first considered by the Australian Pharmaceutical Benefits Advisory Committee (PBAC) for treatment of RCC in July 2016, compared with everolimusCitation10. The PBAC noted that there was no significant difference with respect to PFS between the two agents and mandated a 60-month time horizon for the modelled cost-effectiveness analysis (CEA). The PBAC approved nivolumab for listing on the PBS for the treatment of RCC in 2017 on the condition that the price of nivolumab be back calculated using the effective price of everolimus to ensure an acceptable incremental cost-effectiveness ratio (ICER) between AU$45,000 to AU$75,000Citation11.
Mature data from the pivotal efficacy study for nivolumab, based on up to 80 months of follow-up, were reported by Motzer et alCitation12 in July 2020. These showed that PFS was now significantly better for nivolumab compared to everolimus (HR = 0.84 [95% CI: 0.72–0.99]). OS was still better in the nivolumab group HR = 0.73 [95% CI: 0.62–0.85]. Furthermore, new adverse event (AE) data were presented.
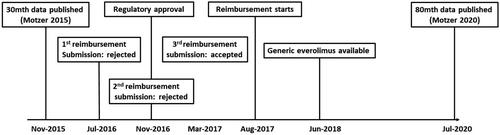
An overview of the time line of events described above is depicted in .
Figure 1. Timeline.
The aim of this study was to reassess the cost-effectiveness of nivolumab as per the decision by the Australian PBAC back in 2016. Everolimus was nominated and accepted as the comparatorCitation10 with which nivolumab would replace due to the overwhelming market share back in 2016. The cost-effectiveness analysis was based on mature data, updated safety and new comparator price.
Methods
Model
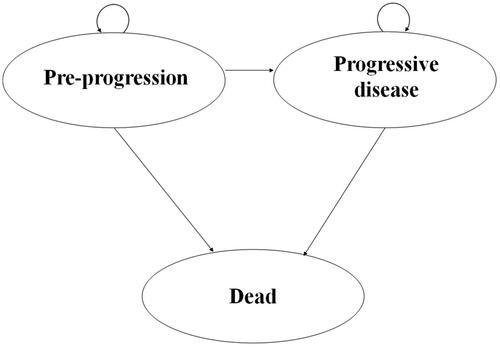
A three-state (pre-progression/progression-free disease, progressive disease and death) Markov model was developed for the present analysis see . This structure was consistent with most published economic evaluations of RCC therapiesCitation13–16, as well as that considered by the PBAC in 2016 and 2017Citation10,Citation11,Citation17. The cycle length was 14 days, and the time horizon was 60 months or 110 months depending on the scenario. The model population comprised an arbitrary 1000 subjects.
Figure 2. Three-state Markov model.
Scenario 1 was based on the early data used for the original submission presented by Motzer in 2015Citation9 and scenario 2 was based on the updated data from 2020Citation12 (see for details on model inputs).
Table 1. Model inputs.
Transition probabilities
We assigned PFS and OS data from Motzer 2015 and Motzer 2020Citation9,Citation12 over the trial-based period, followed by a further 30 months’ of extrapolation. The time horizon was varied by ±25% to test whether it was a driver of the model. The authors chose 25% arbitrarily for this sensitivity analysis. Transition probabilities for PFS and death (1 minus OS) were calculated according to the relative percentage change observed in two-week cycles, with the remaining proportion being attributed to progressive disease.
Survival data from the pivotal trial was reconstructed using a published method by Hoyle et al. (2011)Citation18. In brief, the published survival curves were first digitized to obtain proportions of patients at timepoints needed for the model. Individual patient data were then simulated by assigning a time interval during which outcomes (death or progression) or censoring occurred.
We then used the reconstructed survival data set to determine an appropriate survival distribution for the extrapolation. The choice of survival function was made by comparing goodness-of-fit statistics and on graphical assessments of the hazard and survival functions in the following way. The function with the lowest goodness-of-fit statistic: Akaike Information Criterion (AIC) and Bayesian Information Criterion (BIC) statistics were chosen in conjunction with graphical assessment as recommended by various guidelinesCitation19,Citation20. Functions that were tested were exponential, Weibull, gamma, log-logistic and log-normal. The survival regression was fitted in one model with treatment as covariate.
Utility estimates
The pivotal trial assessed changes in reported global health outcomes in each treatment arm based on the EuroQoL five dimensions three level (EQ-5D-3L) utility index, but utilities were not reported by health stateCitation21. Furthermore, the public summary documents from the PBAC submissions did not report the utility values. A poster presented at the International Society of Pharmacoeconomics and Outcomes Research (ISPOR) 2017 European meetingCitation22 reported utilities for the progression-free and progressive disease from the trial using UK tariffs. The average observed utilities were 0.78 and 0.72 for the progression-free and the progressive states, respectively. Overall, the differences between Australian tariffs and UK tariffs are relatively small for utility values between 0.7 and 0.9 as reported by Viney et al.Citation23, and therefore, the values from the ISPOR poster were used in the model.
Drug costs
The 2016 PBS drug costs for everolimus was AU$5,277.88 per 30 tablets of 10 mgCitation24. The effective price of everolimus was unknown. The PBAC initially deemed everolimus not to be a cost-effective with an incremental cost-effectiveness ratio (ICER) between AU$75,000 to AU$105,000Citation25. Subsequently, a price decrease was offered by the sponsor which resulted in an acceptable ICER between AU$45,000 to AU$75,000Citation5. This equated to a rebate between 29.5% [=(AU$105,000-AU$75,000)/AU$105,000] and 40% (= [AU$75,000-AU$45,000]/AU$75,000). The upper boundary of the rebate interval was chosen for this study, and thus, the everolimus price in Scenario 1 was set to AU$5,277.88 x (1-40%) = AU$3747.29. For Scenario 2, the price of everolimus after patent expiry in 2018 was AU$1726.35. This information was obtained through publicly-available PBS archivesCitation26.
The listed price for nivolumab was AU$2,076.75/100 mg vial and AU$830.70/40 mg vial at the time of the first reimbursement submission in 2016Citation24. It was assumed that patients would receive 3 mg/kg per infusion every 2 weeks as per the clinical trial. The mean body weight of an Australian patient was assumed to be 80 kg, which meant that each patient would receive 80 kg × 3 mg/kg = 240 mg of nivolumab per infusion at a cost of: [2 × AU$2,076.75] + [1 × AU$830.70] = AU$4,984.20. It should be noted that wastage was not an issue in the model since each infusion could be given using 2 × 100 mg vials + 1 × 40 mg vial of nivolumab. The effective price of nivolumab was estimated by back calculating the minimum rebate required in order to obtain an ICER below AU$75,000 per QALY.
Disease management costs
Patients were assumed to see a specialist every fortnight for the first 12 weeks and subsequently every month. Blood test were performed every month, and CT scans every 3 months in the first year and every 6 months thereafter. Relevant costs from the Australian Medicare Benefit Schedule (MBS) were attached to the healthcare resource items (Supplementary Table 1).
Treatment-related grade 3–4 AEs reported by 1% or more patients were included in the model. For Scenario 1, these included fatigue, anemia, pneumonitis, hyperglycemia and stomatitis (Supplementary Table 2). Additional grade 3–4 gastrointestinal, hepatic and renal AEs were reported as part of the update of the clinical data for scenario 2. The costs of these estimated to be AU$747.99 on average for nivolumab and AU$258.40 for everolimus (Supplementary Table 3). Costs were obtained from Australian refined diagnosis-related groups (AR-DRG) cost weights for 2016/2017Citation27 and were not inflated to present dollars for scenario 2 to ease the interpretation of the analysis.
Subsequent therapy costs
The proportion of patients using therapies postclinical progression was assumed to be consistent with that observed in the clinical trial using data from the initial cut of the dataCitation9 (nivolumab arm = 55%; everolimus arm = 63%). In the nivolumab arm, 26% received everolimus and 24% received axitinib as subsequent therapyCitation9. For everolimus-treated patients, 9% received sorafenib and 36% received axitinib. Treatment duration was assumed to be 6 months. Applying the respective published monthly cost for axitinib (AU$6,457.59), everolimus (AU$5,277.88) and sorafenib (AU$5,186.87) and utilization estimates from clinical trial resulted in a weighted drug cost of AU$8,636 (nivolumab arm) and AU$9,255 (everolimus arm) being attached to the first cycle of the economic model.
The study has been performed from an Australian payer perspective and as such in line with the PBAC reimbursement guidelines. The PBAC guidelines do not recognize for inclusion of indirect costs and we have therefore not included these.
Discounting
Costs, years of life lived and quality-adjusted life years (QALYs) lived were discounted at an annual rate of 5%, as per Australian guidelinesCitation20.
Sensitivity analyses
A series of one-way sensitivity analysis for key variables were performed, with variations to key input parameters described in . Probabilistic sensitivity analyses (PSA) were also undertaken using standard distributionsCitation28.
Software
Survival data were digitized using WebPlotDigitizerCitation29. The reconstruction of survival data was performed using Excel 2019 and the statistical software R. SAS version 9.4 and R were used to assess the estimated survival functions. The model was developed in Microsoft Excel 2019 and @Risk version 8 was used for the PSA.
Input data and PSA distributions are summarized in .
Results
Extrapolation of survival data
AIC and BIC values for the extrapolation of PFS and OS data suggested that the log-normal and log-logistic functions, respectively, were the most appropriate, in both Scenario 1 and Scenario 2 (Supplementary Table 4).
Comparison of the predicted survival based on the extrapolation from the interim data cut to the actual observed survival is displayed in Supplementary Figures 1(a,b). The observed OS was generally well predicted for both nivolumab and everolimus, with only a slight underestimation of OS for nivolumab at 60 months (observed 26% vs predicted 24.2%). PFS at 36 months for nivolumab was underestimated (observed 9% vs predicted 3.5%). On the other hand, PFS for everolimus was overestimated (observed 1% vs 2.9% predicted).
Results of the cost-effectiveness analysis
The results of the CEA are reported in . In Scenario 1, using the lognormal distribution to extrapolate PFS and the loglogistic distribution to extrapolate OS, the model estimated 1.73 QALYs and 2.35 life years (LY) for nivolumab compared to 1.48 QALYs and 2.00 LYs for everolimus (discounted) over the 60-month time horizon. Total costs (discounted) were AU$105,000 for nivolumab and AU$38,000 for everolimus (taking into account the 40% rebate). This resulted in an ICER of AU$266,871 per QALY gained. A rebate of 54.4% (effective price = listed price×(1- rebate) = AU$4984.20 – (1 − 54.4%) = AU$2272.80) was needed for nivolumab to reach the ICER threshold AU$75,000 per QALY gainedCitation11.
Table 2. Cost-effectiveness analysis results.
In Scenario 2, with updated safety and a new price of everolimus, the model estimated 1.93 QALYs and 2.86 LYs for nivolumab and 1.60 QALYs and 2.34 LYs for everolimus (discounted). Total costs (discounted) were AU$111,418 for nivolumab and AU$31,942 for everolimus. As a result, the ICER decreased to AU$213,320 per QALY gained. The rebate needed to reach the ICER threshold of AU$75,000 per QALY gained was 54.9% (effective price = listed price×(1- rebate) = AU$4984.20 – (1 − 54.9%) = AU$2247.87).
Increasing the time horizon to 110 months increased the incremental QALYs gained by more than 40% (from 0.27 to 0.38) at a modest 20% increase in costs (from AU$67,049 to AU$80,796). This was most likely due to the fact that more than 95% of the patients have already progressed () by 60 months, and therefore, little extra treatment cost was accrued from then on. It is worth noting that the additional QALY gain from 60 months to 110 months largely arose from patients in the progression health state. The inclusion of the additional AEs only slightly increased the costs from AU$28,364 to AU$28.894.
The one-way sensitivity analysis for both scenarios showed that the cost of nivolumab, the time horizon and utilities are the main drivers of the model ().
Figure 3. One-way sensitivity analyses.
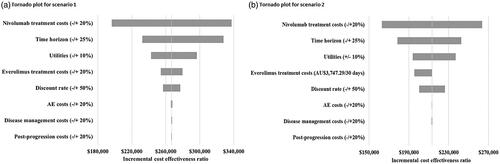
For the one-way sensitivity analysis of the everolimus price at pre-generic level (AU$3747.29/30 days), a rebate of 47.8% (effective price = listed price×(1- rebate) = AU$4,984.20×(1 − 47.8%) = AU$2,601.75) was required for nivolumab to be cost-effective at the AU$75,000 threshold.
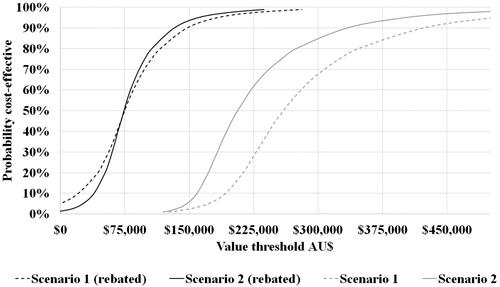
The cost-effectiveness scatterplots (Supplementary Figure 2) and acceptability curves () highlighted the differences in cost-effectiveness of the 2 scenarios, as well as significant uncertainty in the results. With rebates to make the base-case ICER at AU$75,000 per QALY gained, uncertainty reduced considerably.
Figure 4. Cost-effectiveness acceptability curves.
Discussion
Reassessing the cost-effectiveness of nivolumab for the treatment of RCC versus everolimus resulted in nivolumab being cost-effective at a threshold of $75,000 with a rebate level of approximately 54%. This CEA was sensitive to the price of nivolumab, the time horizon and quality of life utilities.
The updated clinical dataCitation12 enable reassessment of the cost-effectiveness of nivolumab while clarifying some of the uncertainties surrounding PFS and OS as pointed out the PBAC in its original assessmentCitation10. While PFS was not significant at the initial data cutCitation9, the present study suggests that the PFS was a major source of uncertainty. Furthermore, the extrapolation of the OS predicted the observed mature OS reasonably well, which provides confidence in the accuracy of the model. Another issue that the updated clinical data provided was an update on AEs. It is well known that AEs for immune-checkpoint inhibitors are different from other cancer drugs and that they can occur late in the treatment regimenCitation30. However, the one-way sensitivity analysis show that AEs were not a source of major uncertainty.
A limitation of our study was that the extrapolations were restricted by the unavailability of individual patient data (IPD). Another published nivolumab CEA by Mahon et al.Citation22 did not provide details on the extrapolations, and therefore, the reconstructed survival data could not be validated. There are other methods for reconstructing survival data [Citation31], but the one we adopted was developed using RCC data and therefore deemed more appropriate to use. A major challenge with the method that we used is the availability of statistical software to deal with interval censoring data, making it a challenge to asses extrapolations based on spline models and other nonstandard statistical distributions. Regardless of these shortcomings, the choice of log-logistic functions for both Scenario 1 and 2 was consistent with what was derived from the IPD in the PBS submission by the sponsorCitation11. Another limitation is that subsequent therapy data were only included for the 30-months data. It is possible that inclusion of data from the longer 80-month data cut would yield another estimate. However, the sensitivity analysis did not have subsequent therapy as a main driver of the model and therefore this would most likely not have a big influence on the results. Finally, access to IPD would also have enabled further investigation with respect to gender, age and comorbidities.
The effective price of nivolumab is unknown as there is a special pricing arrangement. This current listed price of a 100 mg vial of nivolumab is AU$2077. We estimated that a rebate between 54.4% to 54.9% was required for nivolumab to be cost-effective at an ICER threshold of AU$75,000 per QALY gained. This would mean that the effective price per 100 mg vial would be around between AU$937 to AU$947. A public summary document of the deliberations of the PBAC for the reimbursement of nivolumab in adjuvant melanomaCitation32 reports updating the 100 mg vial price from AU$1200 to AU$955 during the health technology assessment. This would equate to a rebate on the list price of 42.2% to 54.0%, which provides confidence that the rebate level that we estimated for nivolumab is comparable to the true rebate.
Another limitation is the dosage of nivolumab and everolimus in the real world. We assumed that the for nivolumab the average body weight was 80 kg, but this is likely to be different in the real world which would also have an impact wastage. It is well known that AEs can be managed by lowering the dose of everolimusCitation33,Citation34, which would reduce the cost of the comparator. Further research is needed to assess this.
Our study demonstrates that re-evaluation of drugs postreimbursement is worthwhile. While our assessment did not result in a major difference in ICER or the proposed rebated price of nivolumab, it highlights the complex issue of assessing cost-effectiveness. The drop in list price of the comparator everolimus from AU$5277.88 to AU$1726.35 following patent expiry had the potential to dramatically impact the cost-effectiveness including any rebates of nivolumab. However, updated clinical trial data demonstrated better effectiveness and the improved survival data offset the additional incremental costs. Nonetheless, this study highlights potential issues of not taking generic prices into account when performing CEA. We therefore recommend that payers develop policies to ensure that in the long term they do not over pay for new drugs, especially when the comparator loses patent protection.
Conclusion
Nivolumab is a cost-effective option with a price reduction of 54% for the treatment of RCC in Australia despite severe price erosion of the comparator. The price rebate needed for nivolumab to be cost-effective at a AU$75,000 threshold for the treatment of RCC in Australia is estimated to be between around 54%. In general, taking generic price erosion into account when performing CEA is recommended.
Transparency
Declaration of funding
This study did not receive any funding.
Declaration of financial/other relationships
DL has received grants from: Abbvie, Astellas, AstraZeneca, Bristol-Myers Squibb, CSL-Behring, Novartis, Pfizer, Sanofi and Shire.
DL has participated as an advisor at advisory boards for: Abbvie, Astellas, AstraZeneca, Bristol-Myers Squibb, Novartis, Pfizer, Sanofi and Edwards Lifesciences.
HK has previously held employment at Novo Nordisk, Pfizer, GlaxoSmithKline and BMS.
SG has nothing to declare.
JME peer reviewers on this manuscript have received an honorarium from JME for their review work, but have no other relevant financial relationships to disclose.
Author contributions
HK, DL and SG made substantial contributions to the conception and design of the study. Data analysis was conducted by HK. All authors contributed to the interpretation of data, took part in the drafting and revising of the manuscript, and gave final approval of the manuscript to be published. All authors agree to be accountable for all aspects of this work.
Supplemental Material
Download MS Word (75.8 KB)Acknowledgements
None reported.
Data availability statement
The data for this study all came from public available sources.
References
- (AIHW), A.I.o.H.a.W. Cancer in Australia 2019. 2019; Available from: https://www.aihw.gov.au/reports/cancer/cancer-in-australia-2019/summary.
- Surveillance, E., and End Results Program (SEER). SEER Stat Fact Sheets: Kidney and Renal Pelvis Cancer. 2020. Available from: https://seer.cancer.gov/statfacts/html/kidrp.html.
- Fisher R, Gore M, Larkin J. Current and future systemic treatments for renal cell carcinoma. Semin Cancer Biol. 2013; 23(1) :38–45.
- Australia AGS. Pharmaceutical Benefits Schedule Item Reports. 2021. Available from: http://medicarestatistics.humanservices.gov.au/statistics/pbs_item.jsp.
- (PBAC), A.P.B.A.C. Public Summary Document: Everolimus (RCC) March 2014. 2014; Available from: https://www.pbs.gov.au/pbs/industry/listing/elements/pbac-meetings/psd/2014-03/everolimus-rcc.
- (PBS), A.P.B.S. Schedule of Pharmaceutical Benefits Summary of Changes Effective 1 June 2018. 2018; Available from: https://www.pbs.gov.au/publication/schedule/2018/06/2018-06-01-general-soc.pdf.
- Kim H, ISPOR Australia Chapter executive committee, J, Byrnes S. Goodall. Health technology assessment in australia: the pharmaceutical benefits advisory committee and medical services advisory committee. Value Health Reg Issues. 2021; 24 :6–11.
- Australian Government, D.o.H. Deeds Agreement - Background. 2019. Available from: http://www.pbs.gov.au/info/industry/listing/elements/deeds-agreement/b-background.
- Motzer RJ, Escudier B, McDermott DF, et al. Nivolumab versus everolimus in advanced renal-cell carcinoma. N Engl J Med. 2015; 373(19) :1803–1813.
- (PBAC), A.P.B.A.C. Public Summary Document: Nivolumab (RCC) July 2016. 2016; Available from: http://www.pbs.gov.au/pbs/industry/listing/elements/pbac-meetings/psd/2016-07/nivolumab-psd-july-2016.
- (PBAC), A.P.B.A.C. Public Summary Document: Nivolumab (RCC) March 2017. 2017; Available from: http://www.pbs.gov.au/pbs/industry/listing/elements/pbac-meetings/psd/2017-03/nivolumab-rcc-psd-march-2017.
- Motzer RJ, Escudier B, George S, et al. Nivolumab versus everolimus in patients with advanced renal cell carcinoma: Updated results with long-term follow-up of the randomized, open-label, phase 3 CheckMate 025 trial. Cancer. 2020; 126(18) :4156–4167.
- Hoyle M, Green C, Thompson-Coon J, et al. Cost-effectiveness of sorafenib for second-line treatment of advanced renal cell carcinoma. Value Health. 2010; 13(1) :55–60.
- Paz-Ares L, del Muro JG, Grande E, et al. A cost-effectiveness analysis of sunitinib in patients with metastatic renal cell carcinoma intolerant to or experiencing disease progression on immunotherapy: perspective of the Spanish National Health System. J Clin Pharm Ther. 2010; 35(4) :429–438.
- Mihajlovic J, et al. Cost-effectiveness of everolimus for second-line treatment of metastatic renal cell carcinoma in Serbia. Clin Ther. 2013; 35(12) :1909–1922.
- Chandiwana D, Perrin A, Sherman S. A cost effectivness analysis of everolimus compared with axitinib in the treatment of metastatic renal cell carcinoma in the United Kingdom. Value Health. 2014; 17(7) :A640.
- (PBAC), A.P.B.A.C. Public Summary Document: Nivolumab (RCC) November 2016. 2016; Available from: http://www.pbs.gov.au/pbs/industry/listing/elements/pbac-meetings/psd/2016-11/nivolumab-rcc-psd-november-2016.
- Hoyle MW, Henley W. improved curve fits to summary survival data: application to economic evaluation of health technologies. BMC Med Res Methodol. 2011; 11(1) :139.
- Latimer N. NICE Decision Support Unit. NICE DSU TECHNICAL SUPPORT DOCUMENT 14: SURVIVAL ANALYSIS FOR ECONOMIC EVALUATIONS ALONGSIDE CLINICAL TRIALS - EXTRAPOLATION WITH PATIENT-LEVEL DATA. 2013. Available from: http://nicedsu.org.uk/wp-content/uploads/2016/03/NICE-DSU-TSD-Survival-analysis.updated-March-2013.v2.pdf.
- Australian Government, D.o.H. Guidelines for preparing submissions to the Pharmaceutical Benefits Advisory Committee (PBAC) Version 5.0. 2016. Available from: https://pbac.pbs.gov.au/.
- Cella D, Grünwald V, Nathan P, et al. Quality of life in patients with advanced renal cell carcinoma given nivolumab versus everolimus in CheckMate 025: a randomised, open-label, phase 3 trial. Lancet Oncol. 2016; 17(7) :994–1003.
- Mahon S, Bullement A, Willis A, et al. Cost effectiveness of nivolumab for patients with advanced, previously treated renal cell carcinoma in Scotland. Value Health. 2017; 20(9):A440.
- Viney R, Norman R, King MT, et al. Time trade-off derived EQ-5D weights for Australia. Value Health. 2011; 14(6) :928–936.
- (PBS), A.P.B.S. Schedule of Pharmaceutical Benefits Effective 1 July 2016. 2016; Available from: https://www.pbs.gov.au/info/publication/schedule/archive#_2016.
- (PBAC), A.P.B.A.C. Public Summary Document: Everolimus (RCC) July 2010. 2010; Available from: https://www.pbs.gov.au/info/industry/listing/elements/pbac-meetings/psd/2010-07/pbac-psd-Everolimus-july10.
- (PBS), A.P.B.S. Schedule of Pharmaceutical Benefits Effective 1 June 2018. 2018; Available from: https://www.pbs.gov.au/publication/schedule/2018/06/2018-06-01-general-schedule.pdf.
- (IHPA), A.I.H.P.A. National Hospital Cost Data Collection, AR-DRG Cost Weight tables V8.0x, Round 21 (Financial year 2016-17). 2019. Available from: https://www.ihpa.gov.au/publications/national-hospital-cost-data-collection-ar-drg-cost-weight-tables-v80x-round-21.
- Briggs A, Claxton K, and M. Sculpher Decision modelling for health economic evaluation. Oxford Handbook in Health Economic Evaluation. 2007. Great Britain: Oxford University Press.
- Rohatgi A. WebPlotDigitizer. 2020. Available from: https://automeris.io/WebPlotDigitizer/.
- El Osta B, Hu F, Sadek R, et al. Not all immune-checkpoint inhibitors are created equal: Meta-analysis and systematic review of immune-related adverse events in cancer trials. Crit Rev Oncol Hematol. 2017; 119:1–12.
- Guyot P, Ades AE, Ouwens MJNM, et al. Enhanced secondary analysis of survival data: reconstructing the data from published Kaplan-Meier survival curves. BMC Med Res Methodol. 2012; 12 :9.
- (PBAC), A.P.B.A.C. Nivolumab (Adj Melanoma): Injection concentrate for I.V. infusion 40 mg in 4 mL, Injection concentrate for I.V. infusion 100 mg in 10 mL; Opdivo®. 2019. Available from: http://www.pbs.gov.au/pbs/industry/listing/elements/pbac-meetings/psd/2019-03/nivolumab-melanoma-psd-march-2019.
- (FDA), U.F.a.D.A. Prescribing information for AFINITOR (everolimus). 2009. Available from: https://www.accessdata.fda.gov/drugsatfda_docs/label/2012/022334s016lbl.pdf.
- Porta C, Osanto S, Ravaud A, et al. Management of adverse events associated with the use of everolimus in patients with advanced renal cell carcinoma. Eur J Cancer. 2011;47(9):1287–1298.