
Abstract
Aim
To quantify the wider impacts of increased graft survival on the size of the kidney transplant waitlist and health and economic outcomes.
Materials and methods
The analysis employed known steady-state solutions to a double-queueing system as well as simulations of this system. Baseline input parameters were sourced from the Organ Procurement and Transplant Network and the United States Renal Data System. Three increased graft survival scenarios were modeled: decreases in repeat transplant candidates joining the waitlist of 25%, 50%, and 100%.
Results
Under the three scenarios, we estimated that the US waitlist size would decrease from 91,822 to 85,461 (6.9% decrease), 80,073 (12.8% decrease), and 69,340 (24.4% decrease), respectively. Patient outcomes improved, with lifetime quality-adjusted life years (QALYs) for a 1-year cohort of transplant recipients increasing by 10,010, 16,888, and 43,345 over the three scenarios. Discounted lifetime costs for the cohort in the new steady state were lower by $1.6 billion, $2.3 billion, and $9.0 billion for each scenario, respectively. Spillover impacts (i.e. benefits that accrued beyond the patients who directly experienced increased graft survival) accounted for 58–65% of the QALY gains and ranged from cost increases of 3.3% to decreases of 5.5%.
Limitations
The model is a simplification of reality and does not account for the full degree of patient heterogeneity occurring in the real world. Health economic outcomes are extrapolated based on the assumption that the median patient is representative of the overall population.
Conclusions
Increasing graft survival reduces demand from repeat transplants candidates, allowing additional candidates to receive transplants. These spillover impacts decrease waitlist size and shorten wait times, leading to improvements in graft and patient survival as well as quality-of-life. Cost-effectiveness analyses of treatments that increase kidney graft survival should incorporate spillover benefits that accrue beyond the direct recipient of an intervention.
Introduction
Studies that measure the value of new health care interventions typically focus on the value that accrues to the patient receiving the treatment and that patient’s direct costs to the health systemCitation1–3. Nevertheless, the International Society for Pharmacoeconomics and Outcomes Research (ISPOR) and the Second Panel on Cost-effectiveness in Health and Medicine have recommended undertaking cost-effectiveness analysis (CEA) from the societal perspective, which may include indirect costs, community preferences, and the broader impact on health systemsCitation2,Citation4. Some interventions are notable not only for their direct impact on patients who receive them, but also for their indirect impact on other members of the population. For example, vaccines for communicable disease entail positive externalities in addition to their direct benefits. These positive externalities – or spillover benefits – include herd immunity that protects the unvaccinated and reduced antibiotic usage and resistanceCitation5,Citation6. However, many value assessments for new treatments are likely to ignore potential wider benefits that accrue to health systems, including to patients who do not receive the interventionCitation3.
Similar to vaccines, interventions that improve graft survival following kidney transplant have the potential to benefit patients who may not directly receive the intervention. Following kidney graft failure, an individual has a chance to rejoin the waitlist and receive a repeat transplant. Preventing this individual from re-joining the waitlist benefits not only that specific patient, but the entire transplant system, by increasing the supply of kidneys available to others and reducing waiting times for all people on the waitlist. Nevertheless, a 2014 systematic review of 66 economic evaluations of kidney transplants did not identify a single study incorporating this spillover benefitCitation7. This omission is particularly concerning given the well-known health and economic benefits of transplantationCitation8,Citation9, and which our study shows are quite large from a spillover perspective.
End-stage renal disease (ESRD) affects roughly 2,200 people per million across the US, with annual medical costs per patient ranging from $65,312 to $180,000, depending on patient characteristics and insurance statusCitation10–12. Kidney transplantation offers people with ESRD the opportunity for longer lives and a higher quality-of-life compared to chronic dialysisCitation9, but the demand for donated kidneys consistently outweighs supply. In 2019 there were more than 90,000 adult candidates on the waitlistCitation13; of candidates joining the list in 2007, only 47% had received a transplant 10 years laterCitation14. Demand for kidneys also far surpasses supply in other countries, with average waiting times of 2.5–3 years in the UKCitation15 and exceeding 4 years in GermanyCitation16. Long wait times on dialysis have also been associated with poorer health outcomes, with one study finding that wait times longer than 4 years increased mortality by 72% relative to immediate transplantCitation17.
Increasing graft survival among transplant recipients can improve access to kidneys for others. More effective immunosuppressive drugsCitation18,Citation19, government policiesCitation20,Citation21, and patient adherence initiatives have all been shown to improve graft survivalCitation22–25. However, many patients still experience complications resulting in a failed transplant. Some of these patients may rejoin the waitlist, and a further subset may receive a second kidney; in the US in 2019, adult retransplant candidates made up 12% of the waitlist and received 10% of all kidney transplants that yearCitation13. Thus, increasing graft survival has spillover health benefits that accrue for other patients by improving their access to kidneys. These spillover effects can be considerable due to the large positive impact of transplantation compared to remaining on dialysis. In one study, transplantation added a median of 11 life-years (LYs) as compared to dialysis-onlyCitation13. However, to date, most value assessments of treatments that affect kidney graft survival rates have not considered the potential benefits of increased organ availabilityCitation7,Citation26.
To quantify the effect of including this spillover benefit into value assessment, this case study uses a double-queuing model to estimate the potential benefits to patients and the US kidney transplant system of interventions that increase kidney graft survival. In particular, we account for a specific spillover benefit: the increased availability of kidneys to other candidates when organ demand from repeat transplant candidates declines due to increased graft survival.
Queuing theory has been frequently applied to health care operations research as well as other studies of solid organ transplantsCitation27–30. We employed known solutions for steady-state properties of the model as well as a simulation of the model that measured changes in the waitlist and candidate outcomes over time.
Methods
Model overview
The double-queuing model provides estimates of the impacts of decreases in repeat transplant candidates joining the waitlist. It captures the double-queue nature of the waitlist (one queue for patients and one for organs) and accounts for patient health deterioration and organ expiration. A key benefit of the double-queuing model is that it accounts for the dynamic interaction of supply and demand in the transplantation system – it accounts for variations in both supply and demand and determines the system state both dynamically and in steady state. Compared to other approaches, it allows for analytic solutions of key outcomes rather than relying on simulationCitation31. A model schematic displaying inputs and outputs is shown in . Members of each queue are matched to each other when they are both available for transplant, and exit the system unmatched if the organ exceeds its maximum cold ischemia time or the candidate becomes too ill for transplant or diesCitation31. The approach has been validated and applied in a number of previous publications, including other transplant studiesCitation32–34.
Figure 1. Double queuing model schematic.
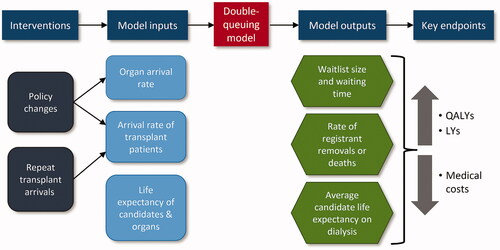
We used the model to quantify the change in organ waitlist performance measures due to improvements in kidney graft survival, which impact the waitlist by reducing repeat transplant candidates and making the kidneys they would otherwise receive available to others. When comparing pre- and post-intervention steady states, we measured outcomes across patients’ lifetimes for a cohort of patients receiving transplants over a 1-year period in the old and new steady states. Changes in average waiting time on dialysis and the number of waitlist removals due to illness or death were then translated into changes in incremental cost, life years (LYs), and quality-adjusted life years (QALYs) for the 1-year cohort of transplant candidates. QALYs are widely used in the field of health economics, where years of life gained are adjusted by quality-of-life during those yearsCitation34,Citation35. A year of life in perfect health is worth one QALY, whereas a year of life in less than perfect health (e.g. bedridden) would be worth less than oneCitation35.
The baseline estimates of LYs, QALYs, and health care costs associated with dialysis and transplant were obtained from the literature. To calculate estimates of these measures for transplant recipients under the different scenarios, we followed the approach of Held et al.Citation36, who estimated outcomes for the median patient under the assumption that this is representative of the overall population. For cost calculations, we included only changes to total health care costs for all patients receiving transplants, which, in the scenarios of interest, includes patients newly able to receive transplants following the reduction in demand from repeat transplant candidates. We did not include wider societal benefits to elements of value such as productivity and caregiver burden. For a full list of input parameters, see Supplementary Table S1.
In addition to estimating the steady state impact of graft failure reductions on waitlist size and other outcomes, we also estimated the time until this steady state is reached. To measure the time to arrival at steady state waitlist size, we developed a simulation-based version of the model. The simulation also allowed us to obtain two additional estimates that serve as inputs into economic results: (i) the median wait time on dialysis for candidates that receive transplants and (ii) the counterfactual survival time on dialysis-only for these patients. In addition, the simulation allowed us to view changes in waitlist outcomes as the model progressed to a new steady state following a change in input parameters. A more detailed explanation of the simulation methodology can be found in Supplementary Appendix B.
Model parameters and data sources
Model input parameter estimates were sourced from the Organ Procurement and Transplant Network (OPTN) national data, US Renal Data System national data (USRDS), and published literature. The OPTN and USRDS data are widely used for research purposesCitation37,Citation38 and publicly accessible. Key model parameters and corresponding sources are listed in . For a full list of all input parameters, calculations, and sources, please see Supplementary Table S1.
Table 1. Model parameters and data sources.
We obtained parameters for the number of organ and candidate arrivals using the OPTN data from 2019. We used 2019 data to avoid the confounding influence of the COVID-19 pandemic that began in 2020. While the number of transplants is generally smaller than the number of organs that actually arrive, organs are generally not discarded except in cases of candidate match or organ quality concerns. Thus, we use the number of transplants as a proxy for the organ arrival rate. Similarly, we obtained the number of transplant candidate arrivals from OPTN data. The model calculates the total arrival rate as the sum of primary plus repeat transplant arrivals.
Maximum cold ischemia time was estimated to be 36 hours. This cutoff was chosen based on Debout et al.Citation39, who found that outcomes are significantly worse beyond this time.
We obtained estimates for Medicare costs from the USRDS 2020 Annual Data ReportCitation40. Estimates of organ acquisition costs and estimates of LYs and QALYs were obtained from Held et al.Citation36, who performed a thorough review of the literature and evaluated the strengths and weaknesses of available parameter estimates. Half-lives were used, as they are conservative estimates of expected survival due to the right-skewed nature of survival distributions. We adjusted costs to 2021 values using the Bureau of Labor Statistics medical Consumer Price Index (CPI)Citation41. Further specifications on the analytical approach are described in Supplementary Appendix B.
Modeling scenarios
As previously discussed, recent pharmaceutical innovation and proposed policy changes have the potential to increase graft survival. These can have important spillover effects due to making organs available to additional patients, allowing them to transition off dialysis and improve both the quality and length of their lives. These spillover effect also reduce wait times for all candidates on the list, which is also known to improve outcomesCitation42. These impacts are often ignored in traditional CEAs. To frame the potential real-world impact of interventions that reduce graft failure, we evaluated a reasonable range of graft survival impacts that may be possible in the future, whether through pharmaceutical innovation, policy changes, increased living donor supply, or other factors.
The three scenarios considered were a 25%, 50%, and, as an upper bound, a 100% reduction in repeat transplant candidates joining the waitlist (scenarios 1, 2, and 3). The 25% and 50% parameters were chosen due to being the first and second quartile as well as author calculation of the association between increased graft survival and reduced demand for retransplants. These percentages reflect reductions in candidate volumes, not graft failure rates; candidates may fail to rejoin the waitlist after graft failure for multiple reasons including death, illness, age, improvement in condition, or other factors. The scenarios are not intended to represent comparisons of specific pharmaceutical interventions. Rather, they are hypothetical increases in graft survival that could be due to various factors, including future pharmaceutical innovation, changes in policy that increase adherence and access (see Supplementary Figure S5 for a consideration of this topic), or other changes, such as improvements in patient management and better utilization of existing therapies.
The first scenario assumed a 1.4-year increase in median graft survival and a 25% reduction in repeat transplant candidates joining the waitlist. As a conservative assumption, no direct increase in patient survival was included. Total patient survival could improve, however, due to the positive effects of shorter waiting times.
The second scenario assumed a 2-year increase in median graft survival and a 50% reduction in repeat transplant candidates joining the waitlist. As above, no direct increase in patient survival was assumed.
As an upper bound, the third scenario assumed a 100% decrease in repeat transplant candidates due to the elimination of graft failure. We also made the conservative assumption that this did not directly increase patient survival, though it did eliminate the potential for post-graft failure dialysis.
The proposed scenarios do not intend to represent past impacts, the current state of the waitlist, or the impacts of specific interventions. Rather, our intention is to provide a reasonable framework for spillover benefits that arise from potential impacts on graft survival. Based on historical pharmaceutical innovations, the parameters of scenario 1 in particular may be conservative estimates of potential future improvements, as studies have shown large gains in graft survival and reductions in rejection events from existing therapiesCitation43–48.
Key modeling assumptions
Following Boxma et al.Citation31, we assumed candidate and organ arrivals follow a Poisson distribution, while candidate survival time on the waitlist follows an exponential distribution. Expected candidate survival time on the waitlist is a key input into measures of health gains and cost reductions: it is the counterfactual outcome for patients that receive a transplant. As the pool of transplant recipients expands under the alternate scenarios, in the real world we would expect to see a decrease in their average health status. This is reflected by a decrease in expected waitlist survival time according to the assumed exponential distribution.
For all outcomes, we assumed that all transplant recipients receive the intervention and benefit similarly from the increase in graft and patient survival. To evaluate the change in outcomes over time, we assumed that there is a linear reduction in repeat transplant arrivals over 10 years, based on our calculations of the time it would take for the full impact of an intervention to be realized. A linear reduction assumes a constant rate of graft failures and is therefore conservative: as the risk of graft failures is high during the first year after transplantCitation14, a new intervention reducing this risk would have a large share of its impact in the short-term.
We assumed the ratio of primary transplants per primary arrival to repeat transplants per repeat arrival remains constant. This assumption allows for the allocation of organs to follow a pattern likely to be seen in the real-world – namely, that both primary and repeat candidates on the waitlist have improved chances of receiving an organ if waitlist size is decreased, and that repeat transplant candidates rejoining the waitlist are somewhat less likely to receive a kidney than primary candidates. Please see Supplementary Table S1 for further detail on this calculation.
While simulation results were similar to observed real-world values, there were some differences. This is expected for two reasons: first, the model is a simplification of reality, and second, the real world is not in steady state. To address the second issue and to facilitate comparisons to real-world values, we scaled our status quo estimates to the real-world values, then scaled alternative scenarios to the status quo. This approach relied on the assumption that both steady-state and pre-steady state outcomes are a constant proportion between scenarios (e.g., waitlist size is 90% smaller under a graft survival improvement scenario compared to status quo, both in and out of steady state). This assumption was confirmed by simulating waitlist performance metrics over a period of 70 years, allowing the observation of pre-steady-state trends.
Sensitivity analyses
For each analysis, we conducted a deterministic sensitivity analysis to test the model’s sensitivity to key input parameters. The analysis varied the following input parameters by ±20%: repeat candidate arrival rate, organ arrival rate, candidate time to removal from waitlist, QALYs per year of dialysis and transplant, and medical costs.
To further test the model’s sensitivity, we used a probabilistic sensitivity analysis to propagate uncertainty in the model’s input parameters throughout the model. This approach allows us to quantify uncertainty in model outcomesCitation49,Citation50. Repeat candidate arrival rates, organ arrival rates, and candidate time to removal from waitlist were jointly sampled from independent uniform distributions allowing for a range of ±10%. Repeated resampling of the probability distributions associated with each input parameter was used to produce an empirical distribution of results showing the sensitivity of outcomes to selected inputs.
In addition, for each modeling scenario, we produced results under two alternative baseline assumptions. The first was based on a recent Center for Medicare and Medicaid Services (CMS) decision that has the potential to reduce the number of organ discardsCitation51, which were 16.1% of all adult kidneys recovered in 2019Citation13. While risk-adjusted international comparisons of discard rates are rare, a 2019 study found that the US discard rate would be reduced to 7.6% under the French kidney allocation systemCitation52. Therefore, we performed a sensitivity analysis in which the discard rate is reduced to 7.6%, which would have increased the 2019 US adult supply by 2,576 to a total of 25,217 kidneys.
For the second alternative baseline assumption, we assumed a reduced baseline repeat transplant candidate arrival rate. In the US, Medicare coverage for kidney transplants ends 36 months after transplant, which may impede patient adherence to anti-rejection drugs and contribute to the higher mid-term graft failure rates in the US when compared to Canada, Australia and New Zealand, and EuropeCitation11,Citation53. While rates of repeat transplant candidates joining the waiting list are not available for many countries, the most recent available data for Canada in 2017 shows that repeat transplants made up 10.4% of transplants performed, compared to 11.7% in the US for the same yearCitation52. Assuming that waitlist additions are proportional to number of transplants performed, the rate of US adult repeat transplant arrivals in 2019 would have been reduced from 4,292 to 3,727 if the rate in the US matched the Canadian rate.
Results for the two alternate baseline assumptions and the sensitivity analyses are included in the Supplementary Material.
Results
Impacts on waitlist
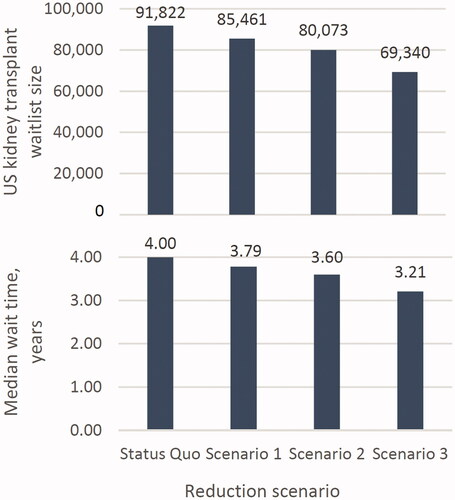
According to OPTN dataCitation13, there were 91,822 adults on the kidney transplant waitlist at the end of 2019.
Our model found that increased graft survival is likely to reduce both waitlist size and median wait times for organ transplant. The 25%, 50%, and 100% graft failure reduction scenarios (scenarios 1, 2, and 3) produced waitlist sizes of 85,461, 80,073, and 69,340, respectively. These amount to 6.9%, 12.8%, and 24.5% reductions in waitlist size. Furthermore, under these scenarios, median wait times decreased from 4.0 years to 3.8, 3.6, and 3.2 years, corresponding to decreases of 5.3%, 10.0%, and 19.7% ( and ).
Figure 2. Median life expectancy under status quo vs. scenario 1.
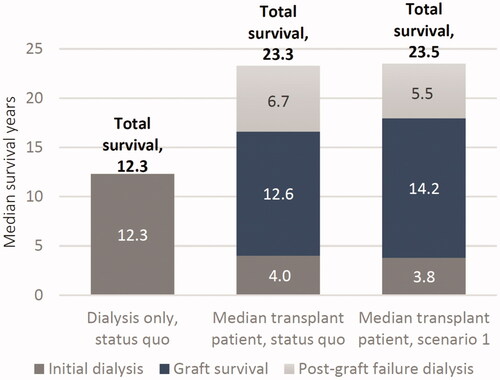
Figure 3. Impact of increased graft survival on US kidney transplant waitlist size and median waiting times.
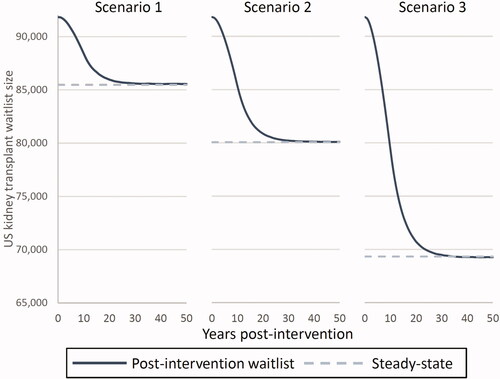
Based on our simulation, the kidney transplant waitlist size reached within 5% of the new steady-state waitlist size 15 years after a potential intervention began. The decline was initially slow due to a backlog of candidates from prior years and an initially low level of avoided graft failures. As this backlog cleared and more patients receive the hypothetical intervention and consequently avoid graft failure, the waitlist size decreases more quickly. displays changes to waitlist size post-intervention.
Figure 4. Post-intervention waitlist size change over time for increased graft survival scenarios.
For median waiting times per patient, the time to reach steady state increased for larger changes in repeat transplant arrivals; for the 25%, 50%, and 100% reduction scenarios (scenarios 1, 2, and 3), wait time decreased to within 1 month of steady state at 14, 20, and 23 years post-intervention, respectively (Supplementary Figure S1).
Cost, LYs, and QALYs
Increasing graft survival led to increases in both total lifetime LYs and discounted QALYs for a 1-year cohort of transplant recipients. Our model assumed that the direct impact of the interventions increased graft survival, but not total patient life expectancy. As a result, all LY gains are due to two spillover impacts: (1) the beneficial effect of reduced waiting time on dialysis before transplant, which increases graft and patient survivalCitation42, and (2) the increased availability of organs to patients that otherwise would not have received them. As a result, total LYs increased by 11,509, 21,951, and 45,313 across the three scenarios. Those who would not have received transplants except under the alternative scenario made up 2.9%, 5.4%, and 10.4% of the average of 22,641 transplants expected per year in each scenario, but made up 66% of the LY gains in each scenario. The other 33% of spillover LY gains accrued to candidates that would receive a transplant under either scenario, but enjoy the life-extending benefits of shorter wait times on dialysis prior to transplant. Supplementary Table S2 contains a full breakdown of the gains accruing to different groups of patients.
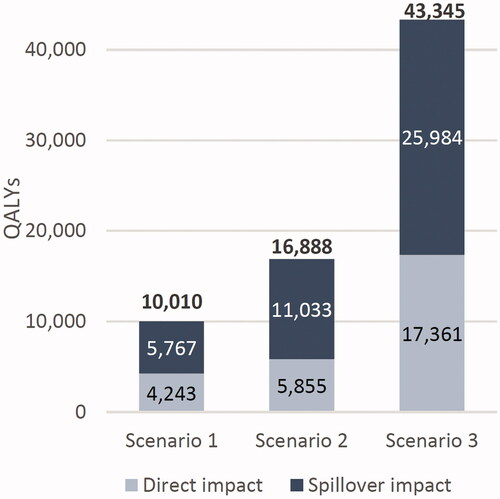
QALY gains occurred in each alternative scenario as a result of both direct and spillover impacts. On a direct level, increased graft survival meant patients spent more time in a higher-utility graft survival state, thus increasing total QALYs. The spillover impacts discussed above apply to QALYs as well, with shorter waiting times and new transplant recipients driving large gains in QALYs. Lifetime discounted QALYs for the cohort increased by 10,010, 16,888, and 43,345 across scenarios, with spillover impacts accounting for 58%, 65%, and 60% of the total, respectively (). All gains were measured relative to the existing status quo. Per capita results are shown in Supplementary Table S2.
Medical costs
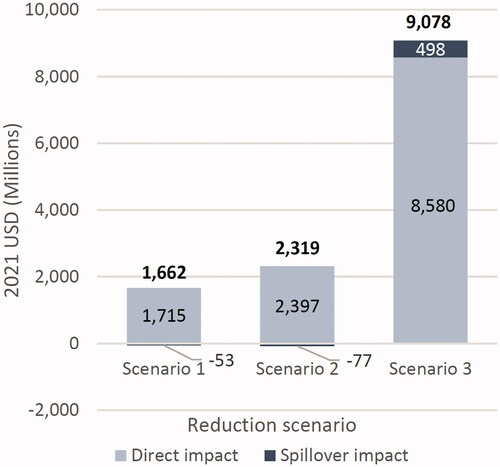
Reducing repeat transplant arrivals by increasing graft survival led to substantial cost savings over the lifetimes of a 1-year cohort for each scenario, with predicted health cost savings of $1.6 billion, $2.3 billion, and $9.0 billion across the three retransplant reduction scenarios. Spillover impacts accounted for −3.2%, −3.3%, and +5.5% of these totals, respectively (). The total cost reductions were largely due to the direct impacts on the more than 20,000 transplant recipients that received a transplant in both the status quo and each alternative scenario.
Figure 5. Lifetime discounted QALYs gained across increased graft survival scenarios for a 1-year cohort of US adult kidney transplant recipients, compared to the status quo.
The spillover impact was comprised of two components: 1) reduced wait time on dialysis led to reduced costs, as well as being associated with improved graft and patient survivalCitation42 and 2) patients who were newly able to receive transplants had slightly increased discounted lifetime costs relative to remaining on dialysis.
Cost savings are particularly large in the upper boundary scenario of 100% reduction in repeat transplant candidates. In this scenario, all transplant recipients avoid two expensive events: graft failure, costing an average of $158,019 in the year of failure plus post-graft failure time on dialysis at $119,438 per year (2021 USD). Avoiding these events also makes the spillover impact positive (). Per capita results are shown in Supplementary Table S2.
Figure 6. Incremental discounted lifetime cost savings for increased graft survival scenarios for a 1-year cohort of US adult kidney transplant recipients, compared to the status quo.
Sensitivity analyses
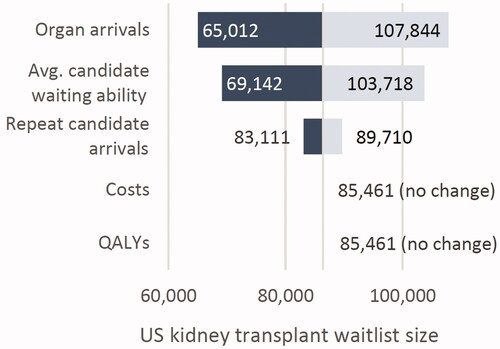
Varying organ arrivals and candidate’s ability to wait on dialysis had the largest impact on waitlist size, while varying repeat candidate arrivals had a smaller impact. In the 25% reduction scenario (scenario 1), increasing organ arrivals and candidate waiting ability by 20% pushed the waitlist size near 110,000, while decreasing these inputs by 20% brought the waitlist down to near 60,000. Varying medical costs and QALYs did not impact waitlist size, as expected ().
Figure 7. Variation in waitlist size when changing inputs ±20% (scenario 1).
Changing the rate of organ arrivals had the largest impact on LYs and QALYs, as this directly impacts the ability of transplant candidates to proceed from dialysis to transplant (Supplementary Figure S2). As expected, varying health care costs had the largest impact on spending, while varying organ arrivals had little impact (Supplementary Figure S3). The results of our probabilistic sensitivity analyses – which jointly varies multiple parameter values simultaneously – also found that variation in organ arrivals is the primary driver of variation in outcomes (Supplementary Figure S4).
As discussed previously, we also produced results under two alternative baseline assumptions: a lower organ discard rate and a lower baseline repeat transplant arrival rate. Under both of these scenarios, waitlists and waiting times were generally shorter due to an increased supply of viable kidneys and fewer patients requiring second transplants (Supplementary Figures S5 and S6). LY and QALY gains were also higher under lower organ discard rate scenarios due to greater organ availability. Under the lower baseline repeat arrivals scenarios, reducing graft failure had a lesser impact on LYs and QALYs, as there were fewer baseline graft failures affected by the intervention. The largest gains in LYs and QALYs occurred under the lower discard rate scenarios (Supplementary Figure S7).
Discussion
Using a double-queuing model approach, our study found that decreasing rates of kidney graft failure – and subsequent reduced demand for repeat transplants – decreased waitlist size and wait times, reduced medical costs, and improved patient survival and quality-of-life. We estimated that reducing graft failure would produce decreases in the number of kidney transplant candidates on the waitlist of 6,361 to 22,482 (a 7% to 24% reduction). Time spent on the waitlist was reduced by 0.21–0.79 years (a 5–20% reduction). Using a simulation, we estimated that these changes in the waitlist and waiting times take 15–23 years to reach near steady-state levels.
Our study found that a large share of the value from increased graft survival accrues as spillover benefits to untreated patients, who have increased access to organs as fewer repeat candidates join the waitlist. We estimated LY gains between 11,500 and 45,000 per year and similar gains in discounted QALYs, from 10,000 to 43,000 per year. Due to our model assumption that the intervention affects graft but not patient survival, spillover impacts accounted for all the gains in LYs. These life year gains occur because of the spillover benefit of reduced wait times on dialysis, which has been shown to increase kidney transplant recipients’ life expectancyCitation42. An intervention that also led to direct increases in patient survival would have even more value.
Spillover impacts also accounted for 41–48% of the gains in QALYs. These gains are predominantly driven by the patients who are newly able to receive kidneys as a result of reduced demand for kidneys from repeat transplant candidates. Additionally, reducing graft failure led to decreased costs in the US by $1.6 billion to $9.0 billion per year. Spillover impacts made up a smaller portion of total medical cost impacts than the QALY impacts and could reflect cost increases, ranging from −3% to +5% of the total. The cost increases were due to the patients that were able to transition from lifetime dialysis under the status quo to newly receiving a transplant, averaging 616, 1,166, and 2,357 transplant candidates per year across the scenarios, respectively. Although costs per year under the transplant pathway were lower than the dialysis-only pathway, due to the large increase in life years due to transplant, these patients could incur higher lifetime discounted costs.
As noted previously, some survival gains in our model, particularly scenario 1, may be conservative. Increased survival gains are associated with a reduced necessity for retransplant. If survival gains were larger, as may be the case for some existing therapies that have been better utilized over timeCitation43–48, fewer retransplants would be needed, and both spillover and direct impacts would increase.
Held et al.Citation36, propose a model of donor reimbursement that would fully satisfy kidney demand. This would reduce the spillover benefits of our hypothetical scenarios, as candidates could readily acquire new organs through the compensation scheme. Acquiring organs in this way does have negative spillover effect on donors; although they would be financially compensated and receive lifetime medical care, living donors face worse lifetime health and economic outcomesCitation54. While interesting, an analysis of the interaction of our graft survival scenarios and a donor compensation scheme is beyond the scope of this study.
Queuing models have frequently been used in health care operations researchCitation27,Citation28. For example, studies have used the models to analyze wait times for coronary-artery bypass surgeriesCitation55 and different types of solid organ transplantsCitation28,Citation29. As previously discussed, our approach largely follows Boxma et al.Citation31, who proposed a prototype double-queuing model for the evaluation of organ transplant waiting lists. This model has been applied in a number of different previous publicationsCitation31–34. While Boxma et al. found steady-state solutions for key performance metrics, we also employed a simulation allowing us to observe waitlist performance in the years following an intervention. This methodology provides novel insight into how the effects of an intervention may progress over time.
Although the incidence of graft failure has declined in recent decades, it still imposes a substantial burden on patients in the long-term; the most recent OPTN data shows 5-year graft survival among deceased donor kidney transplants is 74%Citation14. Graft failure can be caused by acute rejection, glomerular disease, fibrosis/atrophy, and as an event secondary to separate medical or surgical conditionsCitation56. Recent pharmaceutical innovation has increased graft survivalCitation43,Citation57–60. While the current study is hypothetical in nature, the results of existing studies could be further translated into a broader range of real-world impacts by accounting for the spillover impact described in the present paper. Further areas for continued discussion include better characterization of donor-specific antibodies, increased attention to patient adherence to immunosuppressive drugs, and overall long-term investment in better patient access to health care resources and medicationsCitation61. Further, advances in life expectancy have led to an increase in elderly people with ESRD who may be candidates for transplant; these patients are likely to have greater comorbidities and require more complex regimens post-transplantCitation62. Increased emphasis on post-transplant care is especially necessary to ensure graft survival in these patients.
Our study has a number of limitations. First, the double-queuing model used is a practical simplification of a complex system where changes in organ donations and candidate arrivals are the result of both social and demographic trends. It also does not fully reflect the diversity of patient types and outcomes faced across heterogeneous clinical situations. For example, all candidates are drawn from a single probability distribution, and we calculate health and economic outcomes using a hypothetical weighted average of the recipients of living and deceased donor kidneys. Furthermore, the model does not account for human leukocyte antigen (HLA) matching, which is an important predictor of graft failureCitation63. However, as waiting time is still among the most important factors determining transplant receipt, the model may represent the experience of many patientsCitation31. Furthermore, the supply of kidneys from deceased donors is likely to remain the same, while the pool of transplant candidates shrinks, improving the odds of better HLA matching. This makes our estimates more conservative. Second, as discussed previously, we follow an approach similar to Held et al., who estimated outcomes for median patient survival times and pathways under the assumption that this is representative of the overall population. This approach assumes a deterministic return to dialysis or death following graft failure, ignoring the possibility of a repeat transplant. However, Held et al. performed sensitivity tests concluding that such considerations have little impact on cost and QALY results. Third, this study ignores the costs of the hypothetical interventions that could reduce graft failure. Thus, though we demonstrate the value of decreased graft failure, these improvements in outcomes are only likely to be feasible if they can be achieved with a reasonable cost to implement the intervention. Fourth, we extrapolate aggregate health and economic outcomes from the experience of the median patient. While this approach is likely to be conservative due to the typically long right tails of many survival distributionsCitation36, it does not account for patient heterogeneity seen in the real world. In our review, we found a lack of literature on the impacts of patient heterogeneity and feel there is a need for additional research on this aspect in organ transplants. The model also does not account for differences between primary and repeat transplants; however, as repeat transplants make up a decreasing proportion of the total transplants under the alternate scenarios, this method is again conservative and likely to underestimate the benefits resulting from a higher prevalence of primary vs. repeat transplants.
The model is also based on data from the pre-COVID period. Future data will need to be analyzed to understand the impacts of the pandemic on ESRD patients and the kidney transplant waitlist.
Finally, we do not make any attempt to assign prices to the hypothetical interventions. The price of a treatment would depend on many factors such as adverse event rates, QALYs gained, spillover benefits beyond those measured here, and many other factors. The goal of the study is to present benefits and spillovers of a particular and limited impact and it would be outside the scope to measure price. Future CEA models that incorporate spillover benefits should include treatment prices after accounting for all direct and indirect costs and benefits.
Conclusions
Improving graft survival and the subsequent reduced demand from repeat transplant candidates generates significant spillover benefits among untreated patients. Specifically, improved graft survival decreased the waitlist size and shortened waiting times, leading to improvements in graft and patient survival as well as quality-of-life. Further, these reductions have the potential to reduce costs as patients spend less time on dialysis and more time with a functioning graft post-transplant. These changes demonstrate the potential wider benefits of interventions targeting graft failure and underscore the importance of comprehensive post-transplant care. Cost-effectiveness analyses should account for the improvements in health and economic outcomes that accrue beyond the direct recipient of interventions that increase graft survival.
Transparency
Declaration of funding
Funding for this study was provided by Novartis Pharmaceutical Corporation.
Declaration of financial/other interests
The authors of this manuscript have conflicts of interest to disclose as described by the Journal of Medical Economics.
SD, OD, and KB are employees of PRECISIONheor, a consultancy providing services to the life sciences industry, which received financial support from Novartis to conduct this study and develop this manuscript. JS is a former employee of PRECISIONheor. JC, JS, and PM are employees and shareholders of Novartis. Novartis manufactures and markets pharmaceuticals related to management of transplant.
Peer reviewers on this manuscript have no relevant financial or other relationships to disclose.
Previous presentations
Findings of this study have not been previously presented.
Supplemental Material
Download MS Word (1 MB)Acknowledgements
No additional acknowledgements.
Data availability statement
The data that supports the findings of this study is derived from publicly available sources. All data values, sources, and additional explanation are available in the online Supporting Information section at the end of this article.
References
- Neumann PJ. Costing and perspective in published cost-effectiveness analysis. Med Care. 2009;47(7_Supplement_1):S28–S32.
- Neumann PJ, Sanders GD, Russell LB, et al. Cost-effectiveness in health and medicine. Oxford: Oxford University Press; 2016.
- Kim DD, Silver MC, Kunst N, et al. Perspective and costing in cost-effectiveness analysis, 1974-2018. Pharmacoeconomics. 2020;38(10):1135–1145.
- Garrison LP, Jr., Pauly MV, Willke RJ, et al. An overview of value, perspective, and decision context-a health economics approach: An ISPOR Special Task Force report [2]. Value Health. 2018;21(2):124–130. Feb
- Luyten J, Beutels P. The social value of vaccination programs: beyond cost-effectiveness. Health Aff. 2016;35(2):212–218.
- Deogaonkar R, Hutubessy R, Putten I, et al. Systematic review of studies evaluating the broader economic impact of vaccination in low and middle income countries. BMC Public Health. 2012;12(878):878.
- Chung R, Howard K, Craig JC, et al. Economic evaluations in kidney transplantation: frequency, characteristics, and quality-a systematic review. Transplantation. 2014;97(10):1027–1033.
- Axelrod DA, Schnitzler MA, Xiao H, et al. An economic assessment of contemporary kidney transplant practice. Am J Transplant. 2018;18(5):1168–1176.
- Brunkhorst R, Lufft V, Dannenberg B, et al. Improved survival in patients with type 1 diabetes mellitus after renal transplantation compared with hemodialysis: a case-control study. Transplantation. 2003; Jul 1576(1):115–119.
- Wang V, Vilme H, Maciejewski ML, et al. The economic burden of chronic kidney disease and end-stage renal disease. Semin Nephrol. 2016;36(4):319–330., editors. Elsevier.
- Wang JH, Skeans MA, Israni AK. Current status of kidney transplant outcomes: dying to survive. Adv Chronic Kidney Dis. 2016;23(5):281–286.
- United States Renal Data System. US renal data system 2019 annual data report: epidemiology of kidney disease in the United States. Bethesda, MD: National Institutes of Health, National Institute of Diabetes and Digestive and Kidney Diseases; 2019.
- OPTN. National Data. 2021. [cited 2021 Jan 15]. Available from: https://optn.transplant.hrsa.gov/data/view-data-reports/national-data/#.
- Hart A, Smith JM, Skeans MA, et al. OPTN/SRTR 2017 annual data report: kidney. Am J Transplant. 2019;19(S2):19–123.
- Overview: Kidney transplant: National Health Service (NHS). 2018. [cited 2020 Nov 20].
- Pein U, Girndt M, Weigand K, et al. Parameters influencing waiting time for a deceased donor kidney in the eurotransplant allocation system: abstract# D2544. Transplantation. 2014;98:648.
- Meier-Kriesche H-U, Kaplan B. Waiting time on dialysis as the strongest modifiable risk factor for renal transplant outcomes: a paired donor kidney analysis. Transplantation. 2002;74(10):1377–1381.
- Schnitzler MSM, Axelrod D, Lentine K, et al. Kasiske B, OPTN/SRTR 2016 annual data report: economics. Am J Transplant. 2018;18:464–503.
- Abramowicz D, Oberbauer R, Heemann U, et al. Recent advances in kidney transplantation: a viewpoint from the Descartes advisory board. Nephrol Dial Transplant. 2018;33(10):1699–1707.
- Aleccia J. A ‘no-brainer’? Calls grow for medicare to cover anti-rejection drugs after kidney transplant. Kaiser Health News. 2018. Available form: https://khn.org/news/kidney-transplant-anti-rejection-drugs-medicare-coverage/
- Tanriover B, Stone PW, Mohan S, et al. Future of Medicare immunosuppressive drug coverage for kidney transplant recipients in the United States. Clin J Am Soc Nephrol. 2013;8(7):1258–1266.
- Russell CL, Miller C, Remy LM, et al. Improvement of immunosuppressive medication adherence using a SystemCHANGE intervention: case study of an older adult kidney transplant recipient. Nephrol Nurs J. 2018;45(2):171.
- Zhu Y, Zhou Y, Zhang L, et al. Efficacy of interventions for adherence to the immunosuppressive therapy in kidney transplant recipients: a meta-analysis and systematic review. J Investig Med. 2017;65(7):1049–1056.
- Russell CL. Culturally responsive interventions to enhance immunosuppressive medication adherence in older African American kidney transplant recipients. Prog Transplant. 2006;16(3):187–196.
- Low JK, Williams A, Manias E, et al. Interventions to improve medication adherence in adult kidney transplant recipients: a systematic review. Nephrol Dial Transplant. 2015;30(5):752–761.
- Jones-Hughes T, Snowsill T, Haasova M, et al. Immunosuppressive therapy for kidney transplantation in adults: a systematic review and economic model. Health Technol Assess. 2016;20(62):1–594.
- McManus ML, Long MC, Cooper A, et al. Queuing theory accurately models the need for critical care resources. Anesthesiology. 2004;100(5):1271–1276.
- Palvannan RK, Teow KL. Queueing for healthcare. J Med Syst. 2012;36(2):541–547.
- Stanford DA, Lee JM, Chandok N, et al. A queuing model to address waiting time inconsistency in solid-organ transplantation. Operat Res Health Care. 2014;3(1):40–45.
- Drekic S, Stanford DA, Woolford DG, et al. A model for deceased-donor transplant queue waiting times. Queueing Syst. 2015;79(1):87–115.
- Boxma OJ, David I, Perry D, et al. A new look at organ transplantation models and double matching queues. Prob Eng Inf Sci. 2011;25(2):135–155.
- Bar-Lev SK, Boxma O, Mathijsen B, et al. A blood bank model with perishable blood and demand impatience. Stochastic Syst. 2017;7(2):237–263.
- Elalouf A, Perlman Y, Yechiali U. A double-ended queueing model for dynamic allocation of live organs based on a best-fit criterion. Appl Math Modell. 2018;60:179–191.
- Jena AB, Snider JT, Espinosa OD, et al. How does treating chronic hepatitis C affect individuals in need of organ transplants in the United Kingdom? Value Health. 2019;22(6):669–676.
- Torrance GW. Measurement of health state utilities for economic appraisal: a review. J Health Econ. 1986;5(1):1–30.
- Held PJ, McCormick F, Ojo A, et al. A cost-benefit analysis of government compensation of kidney donors. Am J Transplant. 2016;16(3):877–885.
- Massie AB, Kucirka LM, Kuricka LM, et al. Big data in organ transplantation: registries and administrative claims. Am J Transplant. 2014;14(8):1723–1730.
- Grams ME, DeMarco MAM, Kucirka LM, et al. Recipient age and time spent hospitalized in the year before and after kidney transplantation. Transplantation. 2012;94(7):750–756.
- Debout A, Foucher Y, Trébern-Launay K, et al. Each additional hour of cold ischemia time significantly increases the risk of graft failure and mortality following renal transplantation. Kidney Int. 2015;87(2):343–349.
- System USRD. USRDS annual data report: epidemiology of kidney disease in the United States. Bethesda (MD): National Institutes of Health, National Institute of Diabetes and Digestive and Kidney Diseases; 2020.
- U.S. Bureau of Labor Statistics. Consumer Price Index for All Urban Consumers: Medical Care in U.S. City Average [CPIMEDSL]. Federal Reserve Bank of St Louis; 2021.
- Wolfe R, McCullough KP, Schaubel D, et al. Calculating life years from transplant (LYFT): methods for kidney and kidney-pancreas candidates. Am J Transplant. 2008;8(4 Pt 2):997–1011.
- Goring SM, Levy AR, Ghement I, et al. A network meta-analysis of the efficacy of belatacept, cyclosporine and tacrolimus for immunosuppression therapy in adult renal transplant recipients. Curr Med Res Opin. 2014;30(8):1473–1487.
- Rummo O, Carmellini M, Kamar N, et al. Long-term, prolonged-release tacrolimus-based immunosuppression in de novo kidney transplant recipients: 5-year prospective follow-up of the ADHERE study patients. Transpl Int. 2020;33(2):161–173.
- Parodi E, La Porta E, Russo R, et al. Ten-year efficacy and safety of once-daily tacrolimus in kidney transplant: a prospective cohort study. Transplant Proc. 2020;52(10):3112–3117.
- Krämer BK, Montagnino G, Krüger B, et al. Efficacy and safety of tacrolimus compared with ciclosporin‐A in renal transplantation: 7‐year observational results. Transpl Int. 2016;29(3):307–314.
- Schmitz R, Fitch ZW, Xu H, et al. Kidney transplantation using alemtuzumab, belatacept, and sirolimus: five-year follow-up . Am J Transplant. 2020;20(12):3609–3619.
- Ong SC, Gaston RS. Thirty years of tacrolimus in clinical practice. Transplantation. 2021;105(3):484–495.
- Claxton K, Sculpher M, McCabe C, et al. Probabilistic sensitivity analysis for NICE technology assessment: not an optional extra. Health Econ. 2005;14(4):339–347. Apr
- Baio G, Dawid AP. Probabilistic sensitivity analysis in health economics. Stat Methods Med Res. 2015;24(6):615–634. Dec
- ASTS. News results: CMS removes outcomes requirement for transplant center re-approval. 2019. [cited 2019 Dec 17]. Available from: https://asts.org/news-and-publications/asts-news/article/2019/09/27/cms-removes-outcomes-requirement-for-transplant-center-re-approval#.XZJf9SVOmEc.
- Aubert O, Reese PP, Audry B, et al. Disparities in acceptance of deceased donor kidneys between the United States and France and estimated effects of increased US acceptance. JAMA Intern Med. 2019;179(10):1365.
- Evans RW, Applegate WH, Briscoe DM, et al. Cost-related immunosuppressive medication nonadherence among kidney transplant recipients. Clin J Am Soc Nephrol. 2010;5(12):2323–2328.
- Lentine KL, Lam NN, Segev DL. Risks of living kidney donation: current state of knowledge on outcomes important to donors. CJASN. 2019;14(4):597–608.
- Sobolev BG, Kuramoto L, Levy AR, et al. Cumulative incidence for wait-list death in relation to length of queue for coronary-artery bypass grafting: a cohort study. J Cardiothorac Surg. 2006;1(1):21.
- El-Zoghby ZM, Stegall MD, Lager D, et al. Identifying specific causes of kidney allograft loss. Am J Transplant. 2009;9(3):527–535.
- Vincenti F, Rostaing L, Grinyo J, et al. Belatacept and long-term outcomes in kidney transplantation. N Engl J Med. 2016;374(4):333–343.
- Saengram W, Vadcharavivad S, Poolsup N, et al. Extended release versus immediate release tacrolimus in kidney transplant recipients: a systematic review and meta-analysis. Eur J Clin Pharmacol. 2018;74(10):1249–1260.
- Kumar J, Reccia I, Virdis F, et al. Belatacept in renal transplantation in comparison to tacrolimus and molecular understanding of resistance pattern: meta-analysis and systematic review. World J Transplant. 2021;11(3):70–86.
- Rozen-Zvi B, Schneider S, Lichtenberg S, et al. Association of the combination of time-weighted variability of tacrolimus blood level and exposure to low drug levels with graft survival after kidney transplantation. Nephrol Dial Transplant. 2017;32(2):393–399.
- Gaston RS. Improving long-term outocmes in kidney transplantation: towards a new paradigm of post-transplant care in the United States. Trans Am Clin Climatol Assoc. 2016;127:350–361.
- Cabrera J, Fernández-Ruiz M, Trujillo H, et al. Kidney transplantation in the extremely elderly from extremely aged deceased donors: a kidney for each age. Nephrol Dial Transplant. 2020;35(4):687–696.
- Sheldon S, Poulton K. HLA typing and its influence on organ transplantation. Methods Mol Biol. 2006;333:157–174.
- United States Renal Data System. 2020 ADR reference tables. 2020. [cited 2021 Mar 30]. Available from: https://www.usrds.org/reference.aspx.
- United States Renal Data System. 2019 ADR reference tables. 2019. [cited 2021 Mar 30]. Available from: https://www.usrds.org/reference.aspx.