
Abstract
Background
Antibody-mediated rejection (AMR) is one of the leading causes of graft loss in kidney transplant recipients but little is known about the associated cost and healthcare burden of AMR.
Methods
We developed an algorithm to detect AMR using the 2006–2011 Centers for Medicare & Medicaid Services (CMS) using ICD-10 and billing codes as there is no specific ICD-10 or procedure code for AMR. We then compared healthcare utilization, cost, and risk of graft failure or death in AMR. patients versus matched controls.
Results
The algorithm had a 39.4% true-positive rate (69/175) and a 4.1% false-positive rate (110/2,655). We identified 5,679/101,554 (5.6%) with AMR, who had a nearly 3-fold higher risk of graft failure (hazard ratio [HR], 2.75, 95% confidence interval [CI], 2.50 to 3.03; p < .0001) and death (HR, 2.59; 95% CI, 2.35 to 2.86; p < .0001) at 2 years, nearly 5 times the hospitalizations in the 60 d before AMR diagnosis, and increased nephrology and emergency department visits. Mean AMR attributable healthcare costs were 4 times higher than matched controls, at $13,066 more per patient in the 60 d before AMR diagnosis and $35,740 per patient per year higher in the 2 years after AMR diagnosis.
Conclusions
US kidney transplant recipients with AMR have substantially greater healthcare utilization and higher costs and risk of graft loss and mortality.
Introduction
Kidney transplant is the gold standard for the treatment of end-stage kidney disease (ESKD), but 10-year kidney allograft and patient survival remains suboptimal, at only 50% for deceased donors and 80% for living donor transplantsCitation1. Patients with failing transplants experience high mortality ratesCitation2, and those who survive must return to dialysis or seek a subsequent kidney transplant, resulting in high costs both financially and for quality of lifeCitation3. A major cause of graft loss is the rejection of the transplanted kidney. Two types of kidney transplant rejection can occur: T-cell mediated and antibody-mediated rejection (AMR). Previously underrecognized as a clinically significant issue beyond hyperacute rejection at the time of transplantation, antibody-mediated rejection (AMR) is now recognized as a major cause of late kidney graft failuresCitation4–6.
While T-cell mediated rejection is well characterized and treatable, systematic data on the outcomes of AMR in kidney transplant recipients are lacking, as most studies report the experience of single centers. Few studies have examined the costs of AMR, and most examined only the costs of the treatments per se, not the overall cost of increased health care utilization and hospitalizationCitation7. Irish et al. used data from the Premier database to examine costs associated with early AMR and determined that hospital costs were 50% higher in an AMR compared with a non-AMR cohortCitation8, but data on the overall inpatient and outpatient cost and health care utilization from AMR in the United States are lacking.
To better understand the outcomes and economic impact of AMR in the United States, we sought to identify cases of active or chronic active AMR identified in the United States Renal Data System (USRDS) Medicare claims database, and use these cases to describe cost, healthcare utilization, and outcomes associated with AMR in a national kidney transplant recipient sample.
Methods
This study was approved by the Hennepin Healthcare Research Institute Institutional Review Board.
Development of algorithm to identify AMR in Centers for Medicare & Medicaid Services (CMS) claims data
No ICD-10 or Current Procedural Terminology (CPT) billing code specific to AMR exists The only ICD-10 code related to kidney transplant rejection (T86.11) does not distinguish between T-cell mediated and antibody-mediated rejection, and this ICD-10 code was only added recently. There is no equivalent ICD-9 code for kidney transplant rejection, although there is a CPT code for kidney transplant rejection. Furthermore, the treatments commonly used for AMR are not used exclusively for this diagnosis. In addition, healthcare providers employ codes for the purpose of maximizing reimbursement rather than to ensure the capture of specific diagnoses. As a result, they often do not use codes if they do not change reimbursement. Therefore, identifying AMR in CMS claims data required developing an algorithm of a combination of diagnostic (for example, kidney biopsy) and treatment billing codes to identify cases of AMR in the CMS claims payment data. Known cases of AMR (active or chronic active) were selected using data from the Long-term Deterioration of Kidney Allograft Function (DeKAF) Genomics study as the gold standard, given the systematic follow-up and prospective data collection and documentation these in clinical research participants. DeKAF is a National Institutes of Health (NIH)-funded observational investigation of late allograft failure conducted at 5 transplant centers in the United States and 2 in Canada (www.clinicaltrials.gov; NCT00270712). DeKAF Genomics is an ancillary study of DeKAF linked to Medicare claims data for US patients. In DeKAF Genomics, both T-cell and antibody-mediated rejection events and treatments are systematically tracked, and defined by primary treating physicians and local kidney biopsy results. Of 3131 kidney transplant recipients,194 cases of AMR were identified in the DeKAF database (6.2% over a mean of 4.85 years of follow-up)Citation9. Of these subjects, 175 patients with AMR and 2655 patients without AMR were identified in the USRDS claims database, which includes claims data from CMS.
USRDS claims data contain CPT codes for medications as well as medical treatments and procedures commonly used for AMR. AMR diagnosis date, as defined by the DeKAF Genomics study, was used to explore USRDS CMS claims for patterns in the 2 months before and 12 months after that date to help determine which codes might define an AMR event. We compiled a list of frequently employed, clinically relevant codes, then constructed combinations of procedures and treatments associated with AMR detectable from both inpatient and outpatient billing codes (). We then iteratively assessed the different combinations to calculate each algorithm’s sensitivity, specificity, and positive and negative predictive values to predict AMR as defined by the gold-standard DeKAF Genomics data. CPT billing codes examined included those for kidney biopsy, intravenous immunoglobulin (IVIg) treatment, plasmapheresis, rituximab, and kidney transplant rejection. In evaluating each combination of codes to identify an algorithm for AMR in CMS claims data, we prioritized specificity over sensitivity, given that we sought to describe per-patient costs and outcomes associated with AMR and therefore wanted to have high confidence that AMR cases identified were true positives.
Table 1. Codes and time frames examined to determine an algorithm to detect AMR in CMS claims data.
Determining healthcare utilization, costs, and outcomes associated with AMR in CMS claims data
Using the algorithm described above, we identified AMR cases in the USRDS CMS claims database and conducted a Cox proportional hazards analysis to assess the risk of graft failure or death in patients with AMR compared with matched controls. We also compared both inpatient and outpatient costs and healthcare utilization for patients with AMR compared with matched patients without AMR. Controls in the USRDS CMS claims database were matched with AMR patients using the following variables: time from a kidney transplant, sex, age at transplant, diabetes status, living donor status, donor age, donation after circulatory death (DCD), and transplant year, based on a Cox proportional hazards model for the risk of graft failure ()Citation9. Matching was done on the xbeta (estimate of the linear predictor X’β) values among people still at risk when they developed AMR (including people who subsequently developed AMR), where xbeta is an array X of predictors in a vector of beta regression coefficients. This approach matches AMR patients to non-AMR patients with a similar risk of developing AMR. Matched controls are required to survive without an event for at least the number of days it took for the patient to show the first AMR event. The index date for the matched patients is defined as the date after transplant equal to the same number of days after transplant that its matched patient developed AMR. One control was selected for each case. Healthcare utilization was explored up to 60 d before and up to 2 years after the AMR event to allow time to capture costs incurred leading up to the diagnosis, such as clinic visits and hospitalizations, which typically occur shortly before biopsy, as well as costs incurred as a consequence of AMR.
Table 2. Matching variables by group after matching.
Results
Development of algorithm to identity AMR in CMS claims data
Of the 175 unique AMR patients from the DeKAF data with CMS claims, 95 had a biopsy claim within 4 d of the AMR diagnosis date. Of these patients, 69 showed treatments of rituximab, plasmapheresis, IVIg with rituximab, or IVIg with plasmapheresis within 60 d after the biopsy claim, given that most patients are treated within this period. Extending the biopsy date search range up to 1 year did not improve this result, and reducing it to less than 60 d resulted in decreased sensitivity. Of these 69 cases, 38 were treated with IVIg, 51 with plasmapheresis, and 29 with rituximab. None were treated with IVIg alone, 8 with all three, 18 with IVIg and plasmapheresis alone, 12 with IVIg and rituximab alone, 22 with plasmapheresis alone, 6 with rituximab alone, and 3 with plasmapheresis and rituximab alone.
Therefore, we defined the CMS claims AMR algorithm as a kidney biopsy claim followed by treatment with rituximab, plasmapheresis, or IVIg and plasmapheresis or rituximab within 60 d of the biopsy claim. This algorithm resulted in a 39.4% true-positive rate or sensitivity (69/175), and a 4.1% false-positive rate (110/2655, 95.9% specificity), based on the 2830 DeKAF patients in the CMS data.
Several other algorithm options were explored. For example, ignoring the biopsy date increased the true-positive rate to 50%, but it also increased the false-positive rate to 21%. Limiting the window of time after the biopsy during which treatment codes were found reduced the true-positive rate from 40% to 37% using a 30-day window and 30% using a 10-day window, while only slightly reducing the false-positive rate from 4.1% to 3.4% for a 30-day and 2.3% for a 10-day window.
Finally, we explored including the kidney transplant rejection diagnosis code as an indicator of AMR date. Of the 175 AMR patients with CMS claims, 86 had a kidney transplant rejection code within 4 d of the AMR diagnosis date. Of these 86 patients, 64 showed treatments of rituximab, IVIg, or plasmapheresis within 60 d after AMR diagnosis. Therefore, the AMR algorithm defined as a kidney transplant rejection diagnosis code followed by rituximab, IVIg, or plasmapheresis within 60 d of the kidney transplant rejection date only resulted in a 35% true positive rate (64/175), with an essentially unchanged 4% false-positive rate (107/2655). Similarly, including either the rejection diagnosis code or biopsy claim as an indicator of AMR date was also explored, but it only slightly increased the true-positive rate, to 42.3% (74/175), while also increasing the false-positive rate (144/2655, or 5.4%).
Determining outcomes, healthcare utilization, and costs associated with AMR in USRDS claims data
Applying the algorithm described above to CMS claims data from the same era as the gold-standard DeKAF patients (2006–2011), 5,679 of 101,554 (5.6%) kidney transplant recipients in the CMS claims database showed an AMR episode. The 5,679 patients with AMR were then matched to controls without AMR by time from a kidney transplant, sex, age at transplant, diabetes status, living donor status, donor age, DCD status, and transplant year.
Outcomes after AMR
Graft and patient survival were explored using transplants from 2006 to 2011, with outcomes ascertained through 31 December 2014. The 5,679 AMR patients based on the algorithm showed worse graft and patient survival than matched controls without AMR, with a nearly 3-fold higher risk of graft failure (HR, 2.752; 95% CI, 2.504 to 3.025; p < .0001) and death (HR, 2.590; 95% CI, 2.347 to 2.858; p < .0001).
Healthcare utilization
In the 60 d before the AMR diagnosis, patients with AMR experienced 5 times the number of hospitalizations (0.74 vs. 0.14 per patient), as well as twice as many nephrology visits (4.82 vs. 2.34 per patient) and 4 times as many emergency department (ED) visits (0.67 vs. 0.16 per patient) (). Similarly, after AMR diagnosis, AMR patients experienced more than 3 times as many hospitalizations (2.29 vs. 0.64 per patient per year (PPPY)), nephrology visits (15.11 vs. 4.58 PPPY), and ED visits (2.31 vs. 0.57 PPPY) (, ). Among patients identified as having AMR, treatment patterns in the CMS claim data varied, with 2762 (48.6%) showing rituximab only, 1379 (24.3%) plasmapheresis only, 488 (8.6%) plasmapheresis and rituximab, 398 (7.0%) IVIg and rituximab, 388 (6.8%) IVIg and plasmapheresis, and 264 (4.6%) IVIg, plasmapheresis, and rituximab.
Table 3. Healthcare utilization per patient in the 60 d prior to AMR event.
Table 4. Healthcare utilization per patient-year after AMR event (censored at death or 2 years years).
Healthcare costs
Reflecting increased healthcare utilization, healthcare costs were also substantially higher in the AMR group, both 60 d before and up to 2 years after diagnosis. In the 60 d leading up to diagnosis, AMR patients incurred a total cost of $17,135 each, compared with $4069 each in controls ($13,066 more per patient in the 60-day period). Most of this (69.5%) was attributable to inpatient costs, followed by physician visits, outpatient costs, and pharmacy costs (, ). In the 2 years after AMR diagnosis, AMR patients incurred $35,740 higher costs PPPY, with a total of $49,195.45 PPPY (inpatient: $24,682.08; physician visit, $11,812.01; outpatient, $8,398.72; pharmacy: $4,302.63); compared with $13,455.37 (inpatient: $5,173.06; physician visit, $4,731.28; outpatient, $1,380.65; pharmacy, $2,170.39) in matched controls (, and ). PPPY costs after AMR diagnosis were more than twice as high as those who did not die, at $40,088.61 PPPY for those that did not die, and $83,534.13 among those who did.
Figure 1. Cost per patient 60 d before AMR diagnosis for AMR-defined patients only.
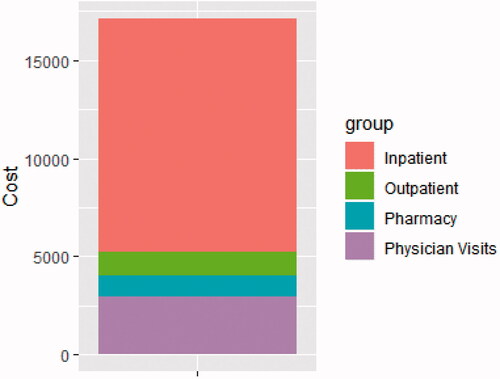
Figure 2. Cost per patient-year 2 years after AMR diagnosis for AMR-defined patients only.
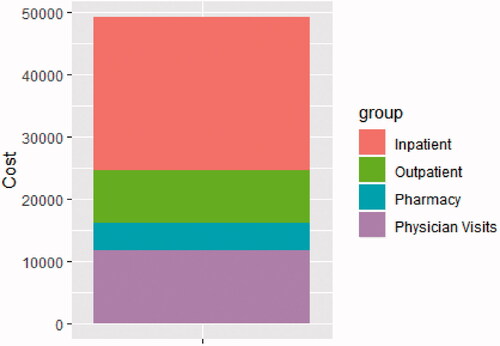
Figure 3. Cost over time in the 60 d before and 2 years after AMR diagnosis for inpatient costs (panel a), outpatient costs (b), pharmacy costs (c) and physician visits (d).

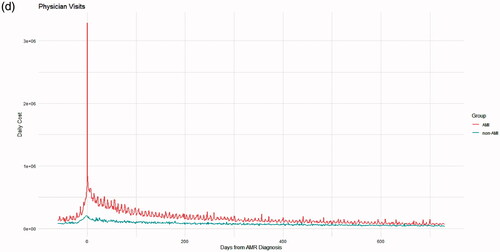
Table 5. Healthcare costs per patient up to 60 d before AMR event.
Table 6. Healthcare costs per patient-year after AMR event (censored at death or 2 years years).
Discussion
In this analysis of U.S. CMS claims data, we found that patients with AMR had a substantially greater risk of graft failure or death and healthcare utilization. These patients also had substantially greater healthcare costs, incurring, on average, $84,546 per person more than controls over the 26-month window evaluated. Some of this cost appears to be incurred before AMR diagnosis, suggesting that it is related to the diagnosis and potentially initial management of complications such as graft failure necessitating hospitalization for acute dialysis. AMR costs are also largely related to inpatient medical care, accounting for nearly 70% of pre-diagnosis costs and 50% of postdiagnosis costs in this analysis. However, the substantial cost and healthcare utilization differences between AMR and non-AMR patients remained evident up to 2 years after the AMR diagnosis.
Little data exist on the total cost associated with AMR. In an abstract describing an analysis of the Premier hospital database and therefore reflecting only inpatient costs, Irish et al. reported an increased inpatient cost of $44,645 attributable to AMRCitation8. However, this analysis did not capture patients treated entirely as outpatients, nor does it account for outpatient in addition to inpatient costs. Tanriover et al. described a case series of 7 AMR patients treated with IVIg and rituximab without plasmapheresis, with total estimated per-patient hospital costs of $47,000 to $171,000 (average, $90,000). While this analysis provides some information about different treatment costs, the analysis was based on the average local hospital charges for these treatments, not actual Medicare or private insurance reimbursementCitation10. Nor did this analysis include outpatient facility, pharmacy, or physician billing. Finally, a UK analysis estimated the cost of an AMR event-based only on the cost of medications and plasmapheresisCitation7. This likely represents a substantial underestimate of the total cost of AMR, given that it did not include the cost of biopsy, physician costs, or hospitalizations and therefore does not account for common second-line treatments, treatment-related complications, or return to dialysis.
While pre-AMR diagnosis costs may be largely related to diagnosis and the management of complications, such as a need for acute dialysis, much of the high post-AMR cost may be related to treatments as well as the long-term dialysis or need for retransplant in a substantial proportion of patients. In the DeKAF study, participants diagnosed with AMR used for this analysis, 25.3% experienced death-censored graft failure at nearly 5 years of follow-up. This analysis of patients with AMR in the CMS claims database limited post-AMR follow up to 2 years, during which time some patients may not have experienced graft loss resulting in retransplant or return to dialysis, and therefore may not reflect the total cost of an AMR event over a patient’s lifetime. However, we did find that the cost differential between AMR and non-AMR cases began to converge by 2 years after the AMR diagnosis (), suggesting that much of the total cost attributable to AMR is included. In addition, given the lower sensitivity in our algorithm, the possible presence of AMR cases among the matched controls suggests that the actual cost difference for AMR vs. non-AMR patients and the hazard of graft loss after AMR is even greater than estimated here.
Evaluating disease incidence and outcomes with claims data is always challenging, given that these data are for payment and billing purposes rather than health outcomes research. Institutions and providers submitting bills for reimbursement are less concerned with whether a specific diagnosis is captured than whether the total compensation is maximized. In the inpatient setting, in particular, individual procedures, labs, and medications are often not billed separately. When compared with the gold-standard DeKAF study database, our CMS claims algorithm for the detection of AMR had a high specificity but low sensitivity. The low sensitivity, likely related to a low rate of CMS claims for the kidney biopsy performed, may be related to a large number of these procedures being performed in the inpatient setting and therefore billed under the total hospitalization rather than for the individual procedure. In emphasizing specificity over sensitivity, we are ensuring that the cost of an episode of AMR is accurate even though the incidence of AMR and the total economic burden of AMR may be underestimated by Medicare claims data. Hence, to the extent that data other than Medicare claims show a higher incidence of AMR, the global cost of AMR is likely higher than we found in Medicare claims. However, this inference relies on our sample of AMR detected being a random sample of all AMR. Inferring the total cost of AMR from our sample of detected AMR assumes that the cost of AMR we did not detect is similar to the cost of AMR we did analyze, which may or may not be the case. However, the high specificity and low rate of false positives provide confidence that the cost assessment and estimated outcomes represent true AMR cases. It is notable that the substantial cost and healthcare utilization differences found in this analysis are likely a conservative estimate, given that there are likely AMR cases among the controls selected.
To our knowledge, this is the first comprehensive analysis of the inpatient and outpatient costs and healthcare utilization of AMR. However, this approach does have some important limitations. As discussed above, using CMS claims data to detect AMR resulted in a low sensitivity to detect AMR. The total cost is of AMR to the healthcare system is therefore likely underestimated. However, we were able to develop the algorithm using a gold standard of multisite data from a prospective clinical trial, and the algorithm did result in a high specificity. This result provides additional confidence in the cost and outcomes assessments for those patients identified as having AMR. Inpatient billing often does not parse out individual treatments, therefore we are unable to describe exactly what care was delivered using these data. In addition, the assessment is based on older data, which may not reflect the most recent costs or newer treatments occasionally employed such as Bortezomb. Nevertheless, the diagnosis and treatment of AMR have changed littleCitation11, and while the total cost amounts may differ, the difference between AMR and non-AMR cases would be expected to remain. Finally, the approach of using a treatment-based algorithm to detect AMR will result in no information provided on patients diagnosed with AMR but untreated. These patients are likely to be either too frail for treatment or were found to have advanced kidney fibrosis unlikely to be amenable to treatment. Therefore, the risk of patient and graft failure associated with AMR is likely underestimated by this approach, and one might more accurately describe this as the outcomes and cost of treated AMR.
Conclusion
Kidney transplant recipients with Medicare who develop AMR suffer a large burden of treatment in the form of both inpatient and outpatient healthcare utilization, incur high costs associated with diagnosis and treatment and have a substantially greater risk of graft failure and death compared with kidney transplant recipients without AMR. Increasing recognition of the role of AMR in graft loss, as well as data that describe the morbidity, healthcare utilization, and cost associated with AMR demonstrate that additional investment in data on the efficacy of both current and novel treatment strategies are needed. This analysis of the costs attributable to AMR provides the foundation for future cost-benefit analyses as treatment efficacy is investigated.
Transparency
Declaration of funding
This work was funded by CSL Behring, King of Prussia, PA, USA. However, this manuscript was written by the authors alone, with no restrictions from CSL Behring.
Declaration of financial/other relationships
Robbin Itzler is employed by CSL Behring.
Peer reviewers on this manuscript have no relevant financial or other relationships to disclose.
Authorship
AH – participated in research design, the writing of the paper, the performance of the research, and data analysis
DZ – Participated in research design, the writing of the paper, the performance of the research, and data analysis
RI – Participated in research design, the writing of the paper, and the performance of the research
DS – Participated in the writing of the paper, the performance of the research, and data analysis
AI – Participated in research design, the writing of the paper, and the performance of the research
BK – Participated in research design, the writing of the paper, the performance of the research, and data analysis
Acknowledgements
The authors acknowledge the help of Mary Van Beusekom, MS, ELS, for manuscript editing and Katherine Audette for project management.
Data availability statement
The data that support the findings of this study are available from the DeKAF investigators upon reasonable request, and CMS claims data are publicly available.
References
- Hart A, Smith JM, Skeans MA, et al. OPTN/SRTR 2017 annual data report: kidney. Am J Transplant. 2019;19 Suppl 2:19–123.
- Rao PS, Schaubel DE, Jia X, et al. Survival on dialysis post-kidney transplant failure: results from the scientific registry of transplant recipients. Am J Kidney Dis. 2007;49(2):294–300.
- Purnajo I, Beaumont JL, Polinsky M, et al. Trajectories of health-related quality of life among renal transplant patients associated with graft failure and symptom distress: analysis of the BENEFIT and benefit-ext trials. Am J Transplant. 2020;20(6):1650–1658.
- Einecke G, Sis B, Reeve J, et al. Antibody-mediated microcirculation injury is the major cause of late kidney transplant failure. Am J Transplant. 2009;9(11):2520–2531.
- Gaston RS, Cecka JM, Kasiske BL, et al. Evidence for antibody-mediated injury as a major determinant of late kidney allograft failure. Transplantation. 2010;90(1):68–74.
- Sellares J, de Freitas DG, Mengel M, et al. Understanding the causes of kidney transplant failure: the dominant role of antibody-mediated rejection and nonadherence. Am J Transplant. 2012;12(2):388–399.
- Muduma G, Odeyemi I, Smith-Palmer J, et al. Review of the clinical and economic burden of antibody-mediated rejection in renal transplant recipients. Adv Ther. 2016;33(3):345–356.
- Irish W, Boscoe A, Ryan MP, et al. Economic burden of antibody mediated rejection following kidney transplantation: comparative analysis using the premier hospital databse. Value Health. 2015;18(3):A187.
- Hart A, Schladt DP, Matas AJ, et al. Incidence, risk factors, and long-term outcomes associated with antibody-mediated rejection – the long-term deterioration of kidney allograft function (DeKAF) prospective cohort study. Clin Transplant. 2021;35(7):e14337.
- Tanriover B, Wright SE, Foster SV, et al. High-dose intravenous immunoglobulin and rituximab treatment for antibody-mediated rejection after kidney transplantation: a cost analysis. Transplant Proc. 2008;40(10):3393–3396.
- Wan SS, Ying TD, Wyburn K, et al. The treatment of antibody-mediated rejection in kidney transplantation: an updated systematic review and meta-analysis. Transplantation. 2018;102(4):557–568.