
Abstract
Aim
The purpose of this manuscript was to illustrate the impact of the place in the treatment sequence on the cost and cost-effectiveness of different biologics for patients with moderate-to-severe plaque psoriasis.
Materials and methods
We developed a treatment sequence model and focused on seven different biological treatment options and 840 combinations of treatment sequences. The model converted cost of treatment to a cost per responder by dividing treatment cost by expected number of patients achieving PASI100 after 52 weeks of treatment. We used Spanish ex-factory price levels, dosing recommendations and real-world data on drug survival to calculate the treatment costs.
Results
The most cost-effective treatment sequence was brodalumab–risankizumab–guselkumab–ixekizumab, with a cost per responder of €139,281 during the first five years of treatment. In comparison, if brodalumab was not recommended as first-line therapy, total costs would increase by 7.4% to €149,616. If brodalumab was not recommended as any of the first four lines of treatment, total costs would increase by 13.1% to €157,527 relative to the most cost-effective treatment sequence.
Conclusions
A sequential therapy model may improve efficiency in the treatment of psoriasis. According to our results, brodalumab as the first-line therapy in Spain leads to the most cost-effective treatment sequence.
Introduction
Psoriasis is a chronic, relapsing, immune-mediated skin disease associated with significant clinical morbidity. The most common type is psoriasis vulgaris, which is characterized by relapsing thick, scaling plaques that are itchy and sometimes painful. The prevalence of psoriasis in any given population ranges from 2% to 3%Citation1, with the majority remaining undiagnosed or underservedCitation2. Psoriasis often impacts quality of life, e.g. a National Psoriasis Foundation Survey found that emotional wellbeing was affected for 88% of psoriasis patients, and 82% reported adverse effects on their enjoyment of lifeCitation3. Around 20% of psoriasis vulgaris patients suffer from moderate-to-severe psoriasisCitation4, which is often defined with the “rule of ten” (body surface area (BSA)>10 or psoriasis area and severity index (PASI) >10) and dermatology life quality index (DLQI) >10Citation5.
According to the European Medicines Agency, biologic therapies are typically indicated for the treatment of adult patients with moderate-to-severe plaque psoriasis. Treatments with biologics have significantly decreased the severity of the disease for patients with moderate-to-severe psoriasis. Several biological treatments are available, e.g. the older anti-tumor necrosis factors (TNFs) (adalimumab, etanercept, infliximab, certolizumab pegol), anti-interleukin (IL)-12/23 (ustekinumab), and the modern biologics anti-IL-17s (brodalumab, secukinumab, ixekizumab), and anti-IL-23s (guselkumab, risankizumab, tildrakizumab). A majority of patients with psoriasis fail their biologic treatment over time due to loss and lack of efficacy, tolerability and other reasonsCitation6,Citation7. They will use a range of biologics over time, and as treatments have different cost and efficacy outcomes, selecting the right treatment sequence will have an impact on cost-effectiveness.
Since several biologics for moderate-to-severe plaque psoriasis have come to market, decision-makers need more insight to determine the optimal treatment sequence to maximize use of limited resources. Typically, health economic models within psoriasis research do not model treatment pathways and the order of treatment options. This is also indicated by recent systematic reviewsCitation8,Citation9. A study investigated cost-effectiveness of sequential biologic therapy in the UK with ixekizumab versus secukinumab as first-line treatmentCitation10. They compared two treatment sequences: “ixekizumab – ustekinumab – infliximab – best supportive care (BSC)” versus “secukinumab – ustekinumab – infliximab – BSC” and found that the ixekizumab treatment sequence provided slight advantages in cost savings and Quality Adjusted Life Years (QALY) versus the secukinumab sequence. Another study investigated biologic treatment sequences by use of a cost–utility analysis based on 10 years of real-world evidence from the BioCAPTURE registry in the NetherlandsCitation11. They compared six different consecutive lines of biologic treatments (adalimumab, etanercept and ustekinumab). They did not find any significant differences among these treatment sequences in terms of cost-effectiveness.
To date, there are no published treatment sequence analyses in psoriasis comparing both the older biologics as well as the newer biological treatment options (TNFs, IL-12/23, IL-17s and IL-23s). The purpose of this analysis was to illustrate the value and cost-effectiveness for seven different biological treatment options and numerous different treatment sequences for patients with moderate-to-severe plaque psoriasis. In total, 840 different combinations of treatments were analyzed and ranked from high to low cost-effectiveness.
Methods
To evaluate costs of different biological treatment sequences for psoriasis, we developed a treatment sequence model from a Spanish payer perspective with each possible treatment sequence ranked from the most cost-effective to the least cost-effective, defined as the lowest cost per patient reaching PASI100.
The model simulated a patient’s course of treatment over five years, beginning with initiation on first-line biological therapy. A decision-tree structure was applied with treatment cycles that cover four weeks each. Patients were assumed to leave the biological treatments gradually and switch to next-in-line therapy. This was driven by treatment discontinuation rates and implied that after each cycle, a patient would either continue treatment or switch to next-in-line therapy. This is presented graphically in .
Figure 1. Illustration of a treatment sequence. The figure presents the model outline. All patients are initiated on first-line therapy at the beginning of the mode. Afterwards, patients will discontinue gradually based on the discontinuation rates. After discontinuation, patients will start next-in-line therapy.
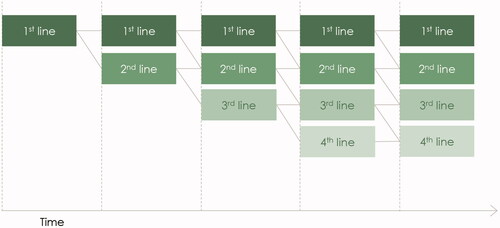
Model simulations indicated that a combination of a maximum of four biological therapies, over a time horizon of five years, was relevant for the average patient with moderate-to-severe plaque psoriasis. We therefore limited the model to evaluating costs associated with treatment of up to four biological therapies. Over five years, very few patients would discontinue the fourth-line treatment with the applied assumptions. Discontinuation was therefore set to zero following the fourth-line treatment to ensure that no patients were out of treatment.
The primary analysis was undertaken for seven different biological treatments. The following therapies were included: certolizumab pegol, ustekinumab, brodalumab, secukinumab, ixekizumab, guselkumab, and risankizumab. No biosimilars were included in the primary analysis, but a sensitivity analysis was undertaken to analyze the impact of biosimilars in the choice set, i.e. we included the lowest priced biosimilar adalimumab as an option.
Model inputs
Drug costs
Treatment costs were calculated for each patient in the model based on the combination of therapies they received, the treatment duration for each product in the sequence, and the cost of therapies. Costs associated with administration, monitoring and adverse events were not considered in the model as they comprise less than 2% of the overall costsCitation12.
For each biological therapy in the model, the associated cost was based on Spanish ex-factory price levels, excluding VAT. Calculations of treatment costs were based on the dosing recommendations in the summaries of product characteristics (SmPCs) for the different therapiesCitation13–20. There was a distinction between induction and maintenance doses, where induction was characterized by a period during which the treatment frequency or dose was higher than normal. We assumed that all patients would go through induction when initiating treatment and if they switched treatment.
Information on drug costs and dosing formulation during the induction and maintenance periods is summarized in .
Table 1. Posology and treatment drug cost.
Discontinuation
It was assumed that patients initiating biological treatments would discontinue treatments gradually. Discontinuation could be caused by, for example, loss and lack of efficacy, tolerability or adverse events requiring patients to terminate their current therapyCitation6,Citation7.
In this treatment sequence model, the risk of discontinuation was defined by drug survival curves published in Yiu et al.Citation7 Yiu et al. provided long-term drug survival data on adalimumab, ustekinumab and secukinumab in patients with moderate-to-severe psoriasis. The study was based on the British Association of Dermatologists Biologics and Immunomodulators Register (BADBIR), which is a large, ongoing pharmacovigilance registry of patients with psoriasis in the UK and the Republic of Ireland. The study used Kaplan–Meier’s survival analysis to estimate the drug survival one and two years after treatment initiation.
For adalimumab, ustekinumab and secukinumab, we converted the two-year drug survival rates to four-week discontinuation rates. Ixekizumab, brodalumab, guselkumab, risankizumab, and certolizumab pegol were not included in the study by Yiu et al. In the base case scenario, we therefore applied the discontinuation rate of adalimumab to all anti-TNF therapies, the discontinuation rate of ustekinumab to all IL-23 therapies, and the discontinuation rate of secukinumab to all IL-17 therapies. Furthermore, it was assumed, contrary to clinical trials, that patients seen in daily clinical practice did not undergo a washout period prior to initiation of next-in-line biological therapy. The per-cycle discontinuation rates for each considered therapy are presented in .
Table 2. Discontinuation rates.
It takes time to see the full effect of biological treatments, and the treatment response is usually evaluated after the first 12–16 weeks. For each therapy, we defined the relevant evaluation period based on the recommendations in the SmPCs. If not specified, the induction period in the SmPC was used. During this evaluation period, patients were assumed to stay on the treatment regardless of their clinical response, since the full effects of the treatment were not yet obtained. This would result in a larger share of patients leaving treatment after evaluation. The length of the evaluation period is summarized in .
Cost per responder
The effectiveness of treatments varies greatly across the investigated therapies. To account for these differences, the model converted the cost of treatment to a cost per responder by dividing the treatment cost by the expected number of patients who responded to the treatment. In the primary analysis, responders were defined as patients who achieved PASI100 after 52 weeks of treatment. The share of patients who achieved PASI100 was based on data from a published network meta-analysis by Yasmeen et al.Citation21 The network meta-analysis was based on a total of 28 randomized controlled trials, including 9,940 patients, identified through a systematic literature review on randomized controlled trials and long-term extensions assessing the efficacy of biologic therapies in adult patients with moderate-to-severe plaque psoriasis. The analysis included different PASI outcomes, i.e. PASI75, PASI90, and PASI100. Outcomes were measured between weeks 40 and 64. These estimates are presented in .
Table 3. PASI response rates.
Results
The analysis included 840 different combinations of treatments. The cost per responder was calculated for each combination and ranked from high to low cost-effectiveness.
Most cost-effective treatment sequences
presents the top five most cost-effective treatment sequences for patients with moderate-to-severe plaque psoriasis. The most cost-effective treatment sequence was brodalumab–risankizumab–guselkumab–ixekizumab (BRO–RIS–GUS–IXE), with a cost per responder of €139,283 during the first five years of treatment.
Table 4. Baseline results from the treatment sequence model: top five cost-effective treatment sequences (in €).
The table shows that brodalumab followed by risankizumab was the most cost-effective choice for first- and second-line therapies in all the top five most cost-effective treatment sequences. Moreover, the table indicates that it was optimal to include guselkumab or ixekizumab as a third-line treatment, and ixekizumab, guselkumab, ustekinumab, secukinumab or certolizumab pegol as a fourth-line treatment. The last column of the table shows that the cost per responder varied only modestly across the top five most cost-effective treatment sequences during the first five years of treatment.
When a full analysis of the 840 different treatment sequences was conducted, brodalumab was chosen as the first-line therapy in all the top 81 most cost-effective treatment sequences. This is because brodalumab has a high efficacy rate and a per-patient cost that is close to the median cost of all the available alternatives. Another important factor when determining the most cost-effective choice of first-line therapy is the higher cost of treatment during the induction period. By comparing the cost of treatment using brodalumab during the first year with the cost of treatment using brodalumab in future years, as presented in , it was seen that the induction period implied an added cost of €1,050, corresponding to a 7.7% increase. In contrast to this, the incremental cost of treatment during the first year with risankizumab was €7,667 higher as compared with the cost of treatment using risankizumab in future years, corresponding to a 50% increase.
To analyze the importance of introducing a new cost-effective first-line therapy, it is potentially more relevant to compare the most cost-effective treatment sequence with (1) a cost-effective treatment sequence in a scenario in which brodalumab is not recommended as first-line therapy and (2) a cost-effective treatment sequence in a scenario in which brodalumab is not recommended as any of the first four lines of treatment. These results are presented in .
Table 5. Cost-effective treatment sequences if brodalumab is not recommended as first-line therapy or any of the first four lines of therapy compared to rank 1 where brodalumab is allowed as first-line therapy (in €).
The table demonstrated that if brodalumab was not recommended as first-line treatment, risankizumab took over as the most cost-effective choice of first-line therapy. Of the 840 possible combinations of therapies, risankizumab–brodalumab–guselkumab–ixekizumab (RIS–BRO–GUS–IXE) represented the 82th ranked treatment sequence and would have an incremental cost per responder of €10,333 over the five-year time horizon relative to the most cost-effective treatment sequence. This corresponded to a cost increase of 7.42% and a total cost per responder of €149,616.
Finally, row 3 of presents the optimal treatment sequence if brodalumab was not recommended as any of the first four lines of treatment, risankizumab–ixekizumab–guselkumab–ustekinumab (RIS–IXE–GUS–UST). In this scenario, the total cost per responder during the five-year time horizon increased by 13.1% relative to the most cost-effective treatment sequence.
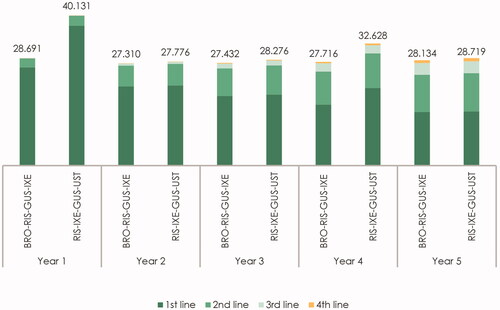
presents the estimated cost per responder by year after treatment initiation and line of therapy for the most cost-effective treatment sequence, i.e. row 1 in (BRO–RIS–GUS–IXE), and the most cost-effective treatment when brodalumab was not recommended as any of the first four lines of therapy (RIS–IXE–GUS–UST), in row 3 in . Due to a relatively low cost of brodalumab during induction, the “BRO–RIS–GUS–IXE” treatment sequence was associated with a cost of €28,691 per responder during the first year relative to the cost of €40,131 per responder in the first year for the “RIS–IXE–GUS–UST” treatment sequence.
Table 6. Estimated cost per responder per year by line of therapy and treatment sequence (in €) for the most cost-effective sequence with and without brodalumab.
In contrast to the first year, the cost per responder associated with treatment of the remaining patients on first-line therapy was relatively similar between brodalumab, in the “BRO–RIS–GUS–IXE” sequence, and risankizumab, in the “RIS–IXE–GUS–UST” sequence, for the remaining years. The exception in year 4 was caused by the fact that patients who are still treated with risankizumab would, due to the dosing scheme, require five administrations in year 4 as opposed to four administrations in years 2, 3, and 5.
Finally, from , it became evident that including a cost-effective first-line therapy also reduced the cost per responder associated with treatment of patients who initiated treatment with second-, third-, and fourth-line therapies. During the five-year time horizon, the costs per responder associated with treatment of patients in second-, third-, and fourth-line therapies were reduced by €1,903 when compared with the costs of these treatment lines in a scenario where brodalumab was not recommended as any of the first four lines of treatment. This accounted for 10.4% of the total savings.
The estimated costs per responder by year after treatment initiation and line of therapy for the “BRO–RIS–GUS–IXE” treatment sequence and the “RIS–IXE–GUS–UST” treatment sequence are graphically presented in .
Figure 2. Estimated cost per responder per year by line of therapy and treatment sequence (in €). The figure presents the total cost per year by line of therapy for the “BRO–RIS–GUS–IXE” treatment sequence (brodalumab–risankizumab–guselkumab–ixekizumab) and the “RIS–IXE–GUS–UST” treatment sequence (risankizumab–ixekizumab–guselkumab–ustekinumab). The cost of first-, second-, third- and fourth-line therapy represents the yearly cost per responder associated with treatment with the therapy in the specific treatment line.
Most cost-effective treatment sequences with an anti-IL-17 as first-line therapy
Several new biological therapies have been introduced over the past decades and these have had a major impact on the disease control of moderate-to-severe plaque psoriasis. One of the more recent classes of biological treatments are the anti-IL-17s. This class of therapies consists of secukinumab, ixekizumab, and brodalumab, approved by the European Medicines Agency between 2015 and 2017. These therapies have been shown to be highly efficacious in clinical trials and are therefore likely to be recommended as first-line therapies in the future.
presents the most cost-effective treatment sequences when either brodalumab, ixekizumab or secukinumab were included as first-line therapy. Again, the most cost-effective treatment sequence was the one with brodalumab as first-line treatment. We estimated the cost per responder for the combination of ixekizumab–brodalumab–risankizumab–guselkumab to be €153,883, which corresponded to an increase of 10.5% compared with first-line treatment with brodalumab. The cost per responder for secukinumab as first-line therapy (secukinumab–brodalumab–risankizumab–guselkumab) was €182,914 corresponding to an increase of 31.3%. presents the total cost per year by year after treatment initiation and line of therapy for each of the three above-mentioned treatment sequences. Once again it became evident that most of the savings were realized during the first year of treatment.
Figure 3. Estimated cost per responder per year by line of therapy for IL-17 treatment sequences (in €). The figure presents the total cost per year by line of therapy for the “BRO–RIS–GUS–IXE” treatment sequence (brodalumab–risankizumab–guselkumab–ixekizumab), the “IXE-BRO-RIS-GUS” treatment sequence (ixekizumab–brodalumab–risankizumab–guselkumab), and the “SEC-BRO-RIS-GUS” treatment sequence (secukinumab–brodalumab–risankizumab–guselkumab). The cost of first-, second-, third- and fourth-line therapy represents the yearly cost per responder associated with treatment with the therapy in the specific treatment line.
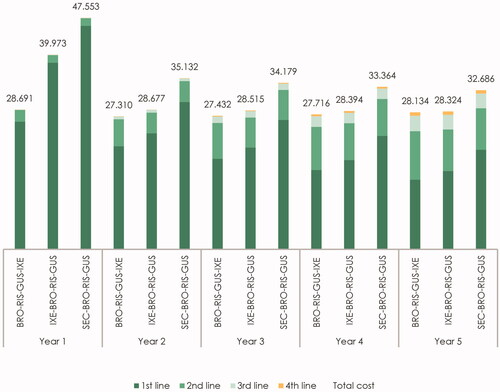
Table 7. Cost-effective treatment sequences where first-line therapy is an IL-17 (in €).
Sensitivity analysis
We undertook different sensitivity analyses to assess the robustness of different model parameters. We assessed how a change in the cost per responder definition impacted the outcomes. Specifically, the use of PASI75 and PASI90 measures was evaluated. Furthermore, we assessed how inclusion of biosimilars and different discontinuation rates impacted the ranking of the most cost-effective treatment sequence.
Change in definition of cost per responder
In the main analysis, we defined responders of biological therapy as patients who achieved skin clearance, i.e. PASI100, by week 52. Often, however, patients with moderate-to-severe plaque psoriasis are said to respond to a given type of treatment if PASI75 or PASI90 is achieved. Rows 1 and 2 in present the cost-effective treatment sequences when the definition of cost per responder was based on PASI75 and PASI90, respectively.
Table 8. Sensitivity analyses.
Changing the definition of responders to be based on PASI75 or PASI90 implied that more weight was put on the actual cost per patient, since a larger share of patients were now classified as responders. This caused the most cost-effective treatment sequences to become brodalumab–ixekizumab–guselkumab–ustekinumab (BRO–IXE–GUS–UST) when responders were defined as patients who achieved PASI75 after 52 weeks of treatment and brodalumab–ustekinumab–certolizumab pegol–ixekizumab (BRO–UST–CER–IXE) when responders were defined as patients who achieved PASI90 after 52 weeks of treatment.
Including biosimilars
In Spain and many other countries, it is advised to treat patients with biosimilars as a first-line therapy because these typically cost less. For many dermatologists, the relevant choice of treatment occurs after patients have discontinued on one or more biosimilars. As a sensitivity analysis, we added the older anti-TNF adalimumab, as this is the by far most used anti-TNF, to the treatment sequence analysis to evaluate how this lower-priced product would impact the ranking of the most cost-effective treatment sequences.
Row 3 of reports the optimal treatment sequence from this analysis. It is seen that the inclusion of adalimumab in the choice set did not change the optimal treatment sequence from the baseline analysis and thereby did not impact the estimated cost per responder. The reason that adalimumab was not included in the optimal treatment sequence in our model was due to its lower efficacy, as seen from , which implied a high cost per responder.
Change in discontinuation rates
One potential drawback of using observed real-world discontinuation rates is that the study by Yiu et al. provides real-world discontinuation data for only three of the eight investigated biological therapies and only two of the seven therapies included in the primary analysis. In order to ensure that the results are not driven by differences in discontinuation rates between the therapies evaluated in Yiu et al.Citation7 and the remaining therapies included in this analysis, we have performed a sensitivity analysis where the discontinuation rate is set to 1% for all the included therapies. From row 4 in , it is seen that the optimal treatment sequence as well as the cost per responder do not change when we carry out this sensitivity analysis. In addition to the above, we conducted a sensitivity analysis where we defined the risk of discontinuation from the survival curves published in Egeberg et al.Citation6,Citation22, which provided real-world data on long-term safety, efficacy, and drug survival data on anti-IL-12/23 and anti-TNF agents for Danish patients with moderate-to-severe psoriasis. We found similar results using this definition of treatment discontinuation.
Discussion
The most cost-effective treatment sequence was BRO–RIS–GUS–IXE, with a cost per responder of €139,283 during the first five years of treatment. In comparison, if brodalumab was not recommended as first-line therapy, total costs would increase by 7.4% to €149,616. If brodalumab was not recommended as any of the first four lines of treatment, total costs would increase by 13.1% to €157,529 relative to the most cost-effective treatment sequence. We also compared the three anti-IL17 treatment options (brodalumab, ixekizumab, secukinumab). Among the different anti-IL-17 treatment options, use of brodalumab as first-line treatment was the most cost-effective option. We undertook several sensitivity analyses and found that the model conclusions to be robust to changes in key model parameters.
Few studies investigated cost-effectiveness of sequential biologic therapy. One study investigated treatment sequences, including ixekizumab, ustekinumab and infliximab treatments, in a UK setting and another study focused on treatment sequences of adalimumab, etanercept and ustekinumab by use of real-world evidence from the NetherlandsCitation10,Citation11. The two analyses did not find any significant differences among the investigated treatment sequences in terms of cost-effectiveness.
To date, there are no published treatment sequence models in psoriasis comparing both the older biologics (TNFs and IL-12/23) as well as the newer biological treatment options (IL-17s and IL-23s) and focus has only been on comparing up to three different treatment options. To our knowledge, the model presented in this manuscript is the first treatment sequence model to evaluate the cost-effectiveness of more than 840 different combinations of currently available biological therapies (adalimumab, ustekinumab, secukinumab, ixekizumab, brodalumab, guselkumab, risankizumab and certolizumab pegol) for patients with moderate-to-severe plaque psoriasis.
One of the unique features of the model is its ability to incorporate the risk of treatment discontinuation when searching for the treatment sequence which maximizes the cost-effectiveness. One limitation of the model is that real-world data on drug discontinuation is currently very limited. The model employs the data from Yiu et al.Citation7, which is based on BADBIR, a large, ongoing pharmacovigilance registry of patients with psoriasis in the UK and the Republic of Ireland. To address this potential limitation, we tested how discontinuation rates of 1% across treatments would impact the ranking of cost-effectiveness among the different treatment sequence combinations. Very similar results were achieved. That said, the sensitivity analysis shows that the discontinuation rates in the model only have very modest effects on the ranking of cost-effectiveness among different treatment sequence combinations.
The model was set to search for the most cost-effective treatment sequences where cost per responder was lowest. Responders were defined by their expected PASI scores after 52 weeks based on estimates from Yasmeen et al.Citation21 By defining responders based on a point estimate of the expected efficacy after 52 weeks, the model implicitly assumed that the number of responding patients was the same throughout the analysis period. This was chosen even though efficacy increased over time for several therapies (comparing PASI in week 16 and week 52), at least during the first year of treatment. A limitation of the model was that the same efficacy measure was used to calculate cost per responder in years 2–5.
In addition to this, since the network meta-analysis performed by Yasmeen et al.Citation21 did not separately report the results for biologic-experienced and biologic-naive patients, the model assumed PASI response rates to be independent of patients’ treatment history.
Naturally, cost and efficacy of therapies constituted the most important parameters in the model, although many factors in addition to efficacy and cost must be considered when considering the optimal therapyCitation23,Citation24. The prices used for the cost calculations were Spanish ex-factory prices, excluding VAT, from May 2020. Drug costs vary significantly across markets and potentially also over time. Therefore, the results presented in this analysis represented the optimal combination of treatments in the Spanish market based on list prices at the time of the analysis (May 2020).
Conclusions
Based on this treatment sequence model, we found that the biological therapy sequence patients are offered is of importance to maximize the use of limited healthcare resources.
With the analyzed data, brodalumab seems to be the most advisable option as first-line therapy and would lead to the most cost-effective treatment sequence options. The most cost-effective treatment sequence was BRO–RIS–GUS–IXE. This was the case irrespective of whether adalimumab biosimilar was included in the treatment sequence choice set or not. The cost per responder was €139,283 during the first five years of treatment. In comparison, if brodalumab was not recommended as first-line therapy, the total costs would increase by 7.4%. If brodalumab was not recommended as any of the first four lines of treatment, the total costs would increase by 13.1%. The usage of sequential models may allow achievement of more efficiency in the selection of treatments for plaque psoriasis.
Transparency
Declaration of funding
This work was supported by LEO Pharma Denmark.
Declaration of financial/other relationships
AE has received research funding from Pfizer, Eli Lilly, Novartis, AbbVie, Janssen Pharmaceuticals, Bristol-Myers Squibb, the Danish National Psoriasis Foundation, the Simon Spies Foundation, and the Kgl. Hofbundtmager Aage Bang Foundation, and honoraria as consultant and/or speaker from AbbVie, Almirall, LEO Pharma, Samsung Bioepis Co., Ltd., Pfizer, Eli Lilly and Company, Novartis, Galderma, Dermavant, UCB, Mylan, Bristol-Myers Squibb, and Janssen Pharmaceuticals. AS and EB are employees at LEO Pharma Denmark. Incentive is a paid vendor of LEO Pharma Denmark. AD and MHP are employees at Incentive. JN has received consultancy/speakers' honoraria and/or participated in clinical trials sponsored by Abbvie, Almirall, Celgene, LEO Pharma, Janssen Pharmaceuticals, Eli Lilly, MSD, Novartis and Pfizer. A reviewer on this manuscript has disclosed that they are an employee of Mount Sinai and receives research funds from: Abbvie, Amgen, Arcutis, Avotres, Boehringer Ingelheim, Dermavant Sciences, Eli Lilly, Incyte, Janssen Research & Development, LLC, Ortho Dermatologics, Regeneron, and UCB, Inc., and is a consultant for Aditum Bio, Almirall, AltruBio Inc., AnaptysBio, Arcutis, Inc., Aristea Therapeutics, Arrive Technologies, Avotres Therapeutics, BiomX, Boehringer-Ingelheim, Bristol-Myers Squibb, Cara Therapeutics, Castle Biosciences, Corrona, Dermavant Sciences, Dr. Reddy’s Laboratories, Evelo Biosciences, Evommune, Inc., Facilitatation of International Dermatology Education, Forte Biosciences, Foundation for Research and Education in Dermatology, Helsinn Therapeutics, Hexima Ltd., LEO Pharma, Meiji Seika Pharma, Mindera, Pfizer, Seanergy, and Verrica. The other peer reviewers on this manuscript have no other relevant financial relationships or otherwise to disclose.
Author contributions
AD, MHP, AS and EB contributed to the study design, development of the economic model, interpretation of the results, and drafting of the manuscript. AE and JN contributed to the study design, interpretation of the results, revision of the manuscript, and provided clinical expert knowledge. All authors have approved the final version of the manuscript to be published and agree to be accountable for all aspects of the work.
Acknowledgements
None reported.
References
- Parisi R, Iskandar IYK, Kontopantelis E, et al. National, regional, and worldwide epidemiology of psoriasis: systematic analysis and modelling study. BMJ. 2020;369:1590.
- Strober BE, van der Walt JM, Armstrong AW, et al. Clinical goals and barriers to effective psoriasis care. Dermatol Ther. 2019;9(1):5–18.
- Kolli SS, Amin SD, Pona A, et al. Psychosocial impact of psoriasis: a review for dermatology residents. Cutis. 2018;102(5S):21–25.
- Goff KL, Karimkhani C, Weinstock MA, et al. The global burden of psoriatic skin disease. Br J Dermatol. 2015;172(6):1665–1668.
- Mrowietz U, Kragballe K, Reich K, et al. Definition of treatment goals for moderate to severe psoriasis: a European consensus. Arch Dermatol Res. 2011;303(1):1–10.
- Egeberg A, Ottosen MB, Gniadecki R, et al. Safety, efficacy and drug survival of biologics and biosimilars for moderate-to-severe plaque psoriasis. Br J Dermatol. 2018;178(2):509–519.
- Yiu Z, Mason K, Reynolds N, et al. Drug survival of adalimumab, ustekinumab and secukinumab in patients with psoriasis: a prospective cohort study from the British Association of Dermatologists Biologics and Immunomodulators Register (BADBIR). Br J Dermatol. 2020;183(2):294–302.
- Gutknecht M, Krensel M, Augustin M. Health economic analyses of psoriasis management: a systematic literature search. Arch Dermatol Res. 2016;308(9):601–616.
- Mauskopf J, Samuel M, McBride D, et al. Treatment sequencing after failure of the first biologic in cost-effectiveness models of psoriasis: a systematic review of published models and clinical practice guidelines. Pharmacoeconomics. 2014;32(4):395–409.
- Johansson E, Hartz S, Kiri S, et al. Cost-effectiveness analysis of sequential biologic therapy with ixekizumab versus secukinumab as first-line treatment of moderate-to-severe psoriasis in the UK. J Med Econ. 2018;21(8):810–820.
- Klijn S, van den Reek J, van de Wetering G, et al. Biologic treatment sequences for plaque psoriasis: a cost–utility analysis based on 10 years of Dutch real-world evidence from BioCAPTURE. Br J Dermatol. 2018;178(5):1181–1189.
- Augustin M, Wirth D, Mahlich J, et al. Cost per responder analysis of guselkumab versus targeted therapies in the treatment of moderate to severe plaque psoriasis in Germany. J Dermatolog Treat. 2020;1–7.
- European Medicines Agency. Cimzia®: summary of product characteristics [Internet]; 2020 [cited 2020 Jul 2]. Available from: https://www.ema.europa.eu/en/documents/product-information/cimzia-epar-product-information_en.pdf
- European Medicines Agency. Cosentyx®: summary of product characteristics [Internet]; 2020 [cited 2020 Jul 2]. Available from: https://www.ema.europa.eu/en/documents/product-information/cosentyx-epar-product-information_en.pdf
- European Medicines Agency. Hulio®: summary of product characteristics [Internet]; 2020 [cited 2020 Jul 2]. Available from: https://www.ema.europa.eu/en/documents/product-information/hulio-epar-product-information_en.pdf
- European Medicines Agency. Kyntheum®: summary of product characteristics [Internet]; 2019 [cited 2020 Jul 2]. Available from: https://www.ema.europa.eu/en/documents/product-information/kyntheum-epar-product-information_en.pdf
- European Medicines Agency. SkyriziTM: summary of product characteristics [Internet]; 2020 [cited 2020 Jul 2]. Available from: https://www.ema.europa.eu/en/documents/product-information/skyrizi-epar-product-information_en.pdf
- European Medicines Agency. Stelara®: summary of product characteristics [Internet]; 2020 [cited 2020 Jul 2]. Available from: https://www.ema.europa.eu/en/documents/product-information/stelara-epar-product-information_en.pdf
- European Medicines Agency. Taltz: summary of product characteristics [Internet]; 2020 [cited 2020 Jul 2]. Available from: https://www.ema.europa.eu/en/documents/product-information/taltz-epar-product-information_en.pdf
- European Medicines Agency. Tremfya®: summary of product characteristics [Internet]; 2020 [cited 2020 Jul 2]. Available from: https://www.ema.europa.eu/en/documents/product-information/tremfya-epar-product-information_en.pdf
- Yasmeen N, Sawyer L, Malottki K, et al. Targeted therapies for patients with moderate-to-severe psoriasis: a systematic review and network meta-analysis of PASI response at 1 year. J Dermatolog Treat. 2020.
- Egeberg A, Bryld L, Skov L. Drug survival of secukinumab and ixekizumab for moderate-to-severe plaque psoriasis. J Am Acad Dermatol. 2019;81:193–178.
- Kaushik SB, Lebwohl MG. Psoriasis: which therapy for which patient: psoriasis comorbidities and preferred systemic agents. J Am Acad Dermatol. 2019;80(1):27–40.
- Kaushik SB, Lebwohl MG. Psoriasis: which therapy for which patient: focus on special populations and chronic infections. J Am Acad Dermatol. 2019;80(1):43–53.