
Abstract
Background
Despite treatment guidelines recommending the use of oral anticoagulants (OACs) for patients with non-valvular atrial fibrillation (NVAF) and moderate to high risk of stroke (CHA2DS2-VASc score ≥1), many patients remain untreated. A study conducted among Medicare beneficiaries with AF and a CHA2DS2-VASc score of ≥2 found that 51% of patients were not prescribed an OAC despite being eligible for treatment. When left untreated, NVAF poses an enormous burden to society, as stroke events are estimated to cost the US healthcare system about $34 billion each year in both direct medical costs and indirect productivity losses. This research explored the short-term clinical implications and budget impact (BI) of increasing OAC use among Medicare beneficiaries with NVAF.
Methods
A decision-analytic model was developed from the payer and societal perspectives to estimate the impact of increasing treatment rates among Medicare-eligible NVAF patients with a moderate-to-high risk of stroke over 1 year. Results of the model compared (1) a base case scenario using literature-derived rates of OAC use, and (2) a hypothetical scenario assuming an absolute 5% increase in overall OAC use. Clinical outcomes included the incremental annual number of ischemic stroke, hemorrhagic stroke, and gastrointestinal bleeding events, and stroke-related deaths. Economic outcomes included incremental annual and per-member per-month (PMPM) direct medical costs for the payer perspective and the incremental sum of annual direct medical and indirect costs from productivity loss and caregiver burden for the societal perspective.
Results
In total, 1.95 million Medicare patients with NVAF were estimated to be treated with OACs in the base case (3.8% of beneficiaries). In the hypothetical scenario analysis, nearly 200,000 more patients were treated resulting in 3,705 fewer ischemic strokes, 14 fewer gastrointestinal bleeds, 141 more hemorrhagic strokes, and 175 fewer deaths. The total incremental BI was $399.16 million ($0.65 PMPM) from the payer perspective and $377.10 million from the societal perspective due to indirect cost savings ($22.06 million).
Conclusion
Our findings suggest that increased overall OAC use has a positive clinical benefit on the annual number of ischemic stroke events and deaths avoided in the Medicare population, while maintaining a modest increase in the overall BI to the Medicare system.
Introduction
Background
Atrial fibrillation (AF) is characterized by an irregular heartbeat that increases the risk of strokes and/or peripheral thromboembolismCitation1. AF is the most common form of cardiac arrhythmia, with 5.2 million prevalent cases in the United States (US) in 2010 and predictions that 12.1 million people will be affected by 2030Citation2.
Prevalence of AF among the general population is approximately 1%, but it increases with age to approximately 9% for persons 80 years or olderCitation3. The vast majority of patients with AF (95%) experience non-valvular AF (NVAF), defined as AF in the absence of moderate-to-severe mitral stenosis or a mechanical heart valveCitation3. Patients with NVAF are pre-disposed to a four- to five-fold increased risk of ischemic stroke as compared to the general population, due to the increased risk of clotting associated with the conditionCitation4.
NVAF poses a substantial economic burden to health systems worldwide. Fatal and non-fatal strokes are major contributors to the high cost of care for patients with NVAF. The economic burden of stroke care extends beyond the cost of managing the initial stroke event. Acute management of strokes in the US can incur costs up to $40,000 per event, while long-term recovery care can increase the total cost of stroke care to beyond $100,000 per eventCitation5. Additionally, the cost of caregiving associated with strokes among the elderly was found to be high. In an analysis of data from the 2008 Health and Retirement Study, the authors found that caregivers spend 8.5 h per week tending to elderly patients with stroke, resulting in stroke-related informal caregiving costs of $4,356 per patient-year (2008 USD)Citation6.
From both clinical and economic perspectives, the goals of oral anticoagulant (OAC) treatment among patients with NVAF are to reduce the risks, and by extension the consequences, of stroke and systemic embolism. To this end, OAC therapy is highly effective in reducing the risk of ischemic stroke events in NVAF patients at high-risk of stroke compared to no treatment and anti-platelet agents. In addition to several randomized clinical trials demonstrating this treatment benefit, a large-scale, real-world, retrospective cohort study found warfarin therapy was associated with a lower risk of ischemic stroke events (crude rate ratio: 0.51; 95% confidence interval (CI): 0.48–0.73) compared with no warfarin therapyCitation7.
Anticoagulant guidelines issued by the American College of Cardiology/American Heart Association Task Force on Clinical Practice Guidelines and the Heart Rhythm Society (AHA/ACC/HRS) in 2019 recommended OACs, including vitamin K antagonists (VKAs) and direct oral anticoagulants (DOACs), for patients with an elevated risk of stroke (CHA2DS2-VASc score of ≥2 in men or ≥3 in women)Citation8. DOACs, an alternative to VKAs, have been approved for stroke prevention in AF based on their noninferiority in efficacy and safety compared with warfarin in randomized controlled trials, and eliminate the need for frequent laboratory testing and dose adjustments that is a necessary component of warfarin treatmentCitation9. The 2019 AHA/ACC/HRS guidelines state that DOAC-eligible patients with NVAF and elevated stroke risk should be treated with DOACs rather than VKAs, such as warfarinCitation8. There are four FDA-approved DOACs available to reduce the risk of stroke and systemic embolism (SE) among patients with NVAF: dabigatran etexilate (PradaxaFootnotei) in October of 2010, rivaroxaban (XareltoFootnoteii) in November of 2011, apixaban (EliquisFootnoteiii) approved in December of 2012, and edoxaban (SavaysaFootnoteiv) in January of 2015Citation10–13.
Anticoagulation in patients with NVAF is associated with a lower likelihood of resource utilization, and thus an economic burden associated with the condition. For instance, compared to patients not receiving warfarin, patients with an elevated stroke risk who were highly-adherent to warfarin experienced significantly lower likelihoods of inpatient hospitalizations (odds ratio [OR]: 0.73; 95% CI: 0.61–0.86) and outpatient visits (OR: 0.84; 95% CI: 0.73–0.97), and shorter lengths of hospital stay (OR: 0.60; 95% CI: 0.55–0.66)Citation14.
Rationale & objective
Despite the most recent recommended guidelines from the AHA/ACC/HRS8 as well as a high proportion of patient eligibility for anticoagulationCitation15, a systematic literature review of real-world evidence studies plus a recent Medicare claims analysis suggest that the proportion of NVAF patients treated with OACs remains low, with up to 51% of eligible patients not receiving OAC treatmentCitation16,Citation17. A prior health economic modeling exercise estimated the financial implications for Medicare of increased thromboprophylaxis among Medicare-eligible patients with moderate-to-high risk of strokeCitation18. However, this model was developed before the widespread introduction of DOACs, and therefore could not estimate their clinical and economic impact.
Given the potential of anticoagulant use to result in large reductions in stroke costs, an updated analysis is required to evaluate financial implications associated with DOAC market uptake using contemporary epidemiologic and economic data. The goal of this study was to develop an economic model to explore the short-term clinical implications and budget impact associated with improving adherence to the 2019 AHA/ACC/HRS NVAF treatment guidelines in a Medicare-eligible population. The model will help inform clinicians, individual health plan administrators, and policy makers about the clinical and economic benefits of treating previously untreated patients with NVAF with OACs.
Methods
Model overview
A decision-analytic model was developed to estimate the number of clinical events and corresponding costs among Medicare beneficiaries diagnosed with NVAF over a 1-year time horizon. The base case of the model was conducted among all Medicare beneficiaries, while a subgroup analysis was conducted among a subset of Medicare beneficiaries ages 85+ years with highest risk of stroke. The model was conducted from both the payer and societal perspectives, with the latter adding costs of lost productivity (optimized for a mostly retired population) and caregiver time. A model time horizon of 1 year was selected as the basis for analysis in an effort to simplify model assumptions and increase the interpretation of model results. The intention of the model was to generate insights into the short-term clinical and economic implications of increasing anticoagulation among untreated patients with AF, framed as a pilot, short-term intervention. Additional sensitivity analyses with a longer time horizon and/or more complex model frameworks (e.g. cost-effectiveness analysis) would allow for better reflecting the chronic nature of AF; however, doing so would require incorporation of several additional assumptions and calculations related to projecting health and cost outcomes of untreated patients in the long-term, which would increase complexity in model interpretation. Literature-derived clinical estimates were obtained from a number of published sources, including a global systematic literature review presented at the American Heart Association Scientific Sessions 2020 in Dallas, TexasCitation16. All calculations for this model were developed and executed in Microsoft Excel for Mac version 16.42.
Alterations to the rate of OAC treatment
Results of the model compared two scenarios: (1) a base case scenario using current rates of OAC treatment from literature-derived estimates, and (2) a hypothetical scenario based on assumed increases in the overall rate of OAC treatment. For the base case scenario, the proportion of AF patients treated with OACs was based on a retrospective observational data analysis of Medicare beneficiariesCitation17. The proportion of patients prescribed DOACs versus warfarin among those treated with OACs was obtained from the Global Registry on Long-Term Oral Antithrombotic Treatment in Patients with Atrial Fibrillation (GLORIA-AF); the registry enrolled patients with newly-diagnosed NVAF and moderate-to-high risk of stroke (i.e. CHA2DS2-VASc score ≥1)Citation15. Estimates for the proportion of AF patients treated with OACs, along with the intervention mix between DOACs and warfarin, is provided in . In the hypothetical scenario, the overall OAC treatment rate was increased by an absolute 5% over baseline observed rates, which was described by expert opinion as a feasible one-year increase in treatment rates (co-author GDB). The intervention mix between DOACs and warfarin in the hypothetical scenario was assumed to be the same as the base case intervention mix which resulted in an absolute percent increase of 3.27% and 1.73% in DOAC and warfarin use, respectively. A graphical depiction of the population flow and intervention mix for the base case and hypothetical scenario analyses can be found in . A second hypothetical scenario was conducted such that the 5% absolute increase in OAC use was associated only with DOAC use (i.e. 5% absolute increase in DOAC use, no increase in warfarin use).
Figure 1. Population and intervention mix in base case and hypothetical scenario analyses.
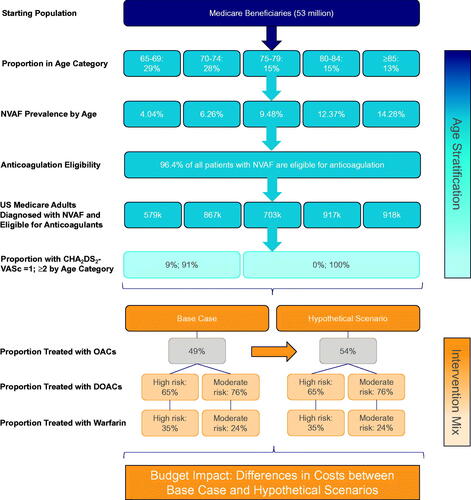
Table 1. Model input parameters and values.
Table 2. Annual clinical and economic outcomes for the overall Medicare population and 85+ subgroup, presented for the base case and hypothetical scenario analyses.
Model structure
The model population was based on the age distribution of Medicare beneficiaries as well as age-specific prevalence rates of NVAF, both of which were applied according to 5-year age increments for patients ages 65–84 years and for all beneficiaries ages 85+. Since Medicare patients with age 65+ have an automatic minimum CHA2DS2-VASc score of 1, low-risk patients were excluded from the analysis by default. Moreover, all patients ages 75 and above were assumed to have a high risk of stroke, since patients in these age categories are assigned a CHA2DS2-VASc score ≥2 based on age alone. The prevalent NVAF population, which must have been eligible for anticoagulation therapy, was further stratified based on stroke risk, focusing on patients with moderate and high risks of stroke (i.e. CHA2DS2-VASc score = 1 and CHA2DS2-VASc score ≥2, respectively). Since age is already a component of the CHA2DS2-VASc algorithm, the distribution of CHA2DS2-VASc scores was applied consistently across age groups to avoid double-counting stroke risk.
The ensuing model structure was based on the framework from Patel 2014, with updates incorporated to accommodate DOACs as a treatment option, which were not included in that modelCitation18. See for the model flow diagram.
Figure 2. Model structure diagram. Abbreviations. DOAC, direct oral anticoagulant; NVAF, non-valvular atrial fibrillation; US, United States.
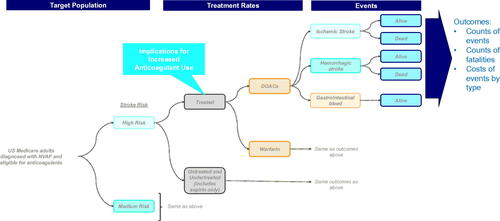
Following construction of the model population, a proportion of patients were assigned anticoagulant treatment while the remaining proportion were untreated, with overall treatment rates stratified by moderate and high risks of stroke. Due to limited data, the proportion of patients eligible for anticoagulation therapy was assumed to be equal across all age categories. Patients treated with an anticoagulant were administered either DOACs or warfarin and were similarly stratified by moderate and high risks of stroke. DOACs were modeled as an aggregated class of therapies and included rivaroxaban, dabigatran, apixaban, and edoxaban. Real-world evidence studies, using data from administrative claims or registries, were sometimes unable to distinguish between patients on aspirin and patients untreated with anticoagulants; as a result, patients not prescribed OACs were defined as those not receiving any anticoagulant or who may have been treated with aspirin only.
The risks of fatal and nonfatal ischemic stroke events, fatal and nonfatal hemorrhagic stroke events, and gastrointestinal (GI) bleeding events were subsequently applied separately to patients treated with DOACs or warfarin and to those patients not on treatment. The risk of ischemic stroke events was further stratified by age (65–85 and 85+ years) as well as by moderate and high risks of stroke for age 65–74 years; patients age 75+ years were assumed to all be high risk based on CHA2DS2-VASc score.
Patients may have died from an index ischemic or hemorrhagic stroke event; mortality for GI bleed was not modeled, in line with prior modeling practiceCitation5,Citation18. Due to limited data, mortality rates associated with ischemic and hemorrhagic stroke events could not be further stratified by age categories; the same proportion that died due to an event did so regardless of age. Because of the short model time horizon of 1 year, patients did not die from causes other than ischemic or hemorrhagic stroke events.
Cost calculations
Per event costs for GI bleed events and index fatal ischemic and hemorrhagic stroke events were applied to the number of respective events observed in the model. Additionally, index costs and 11 months of follow-up costs for nonfatal ischemic stroke and hemorrhagic stroke were applied to patients surviving the index event. All clinical events, including ischemic strokes, hemorrhagic strokes, and GI bleeds, were assumed to occur at the end of the first month of the model for the purposes of calculating costs.
Patients treated with DOACs or warfarin were assigned annual drug acquisition costs; warfarin-treated patients were also assigned international normalized ratio (INR) monitoring costs based on the number of INR tests per year. Patients who died from ischemic or hemorrhagic stroke incurred one month of treatment costs based on the assumption that events occurred at the end of the first month. Patients surviving the index clinical event were assumed to be perfectly adherent to oral anticoagulants for the 1-year model horizon. By extension adherence, or the lack thereof, was not assumed to affect the annual event risk.
For the purposes of a societal perspective analysis, indirect costs of productivity loss and caregiver burden were applied to stroke and bleeding events.
Model inputs and data sources
All model input parameters and values are provided in .
Population inputs
The base population of the model was representative of the US Medicare system, and included the total Medicare population of 51.3 million beneficiaries with a minimum age of 65 enrolled in Medicare Parts A and BCitation19. The distribution of Medicare beneficiaries by age category (65–69, 70–74, 75–79, 80–84, and ≥85 years) was derived from CMS statistics based on the most recent data available (2018), with the assumption that ten-year cohorts (age 65–74, age 75–94) were evenly split between their five-year halvesCitation19. The diagnosed prevalence of AF by age category was derived from a retrospective cohort modeling study using Medicare administrative claims data from 2004 to 2010Citation20. The proportion of the NVAF population eligible for anticoagulation was based on an analysis of the National Cardiovascular Data Registry PINNACLE registry, where 3.6% of NVAF patients were found to have prior contraindication to OACs or had prior cardiac valve therapyCitation21.
Clinical inputs
The distribution of stroke risk scores, including CHA2DS2-VASc score =1 and CHA2DS2-VASc score ≥2, was obtained from a prospective, national, US registry of cardiovascular care of outpatients with AF and a moderate-to-high risk of thromboembolismCitation22. The baseline risk of ischemic stroke for untreated patients age 65–84, categorized by CHA2DS2-VASc score, came from commonly cited studies of untreated NVAF patientsCitation23–25. For the 85+ subgroup analysis, separate risks of stroke for the untreated and warfarin treated population were obtained from a registry study of European AF patientsCitation26. The risk of hemorrhagic stroke for AF patients treated with warfarin was based on findings from the ARISTOPHANES study of US Medicare and commercial claims databasesCitation27.
Absolute rates of GI bleeds for untreated patients and patients on warfarin were based on the ATRIA real-world study of hemorrhage and anticoagulationCitation28; the aspirin cohort in the ATRIA study was used as a proxy for untreated patients in our model, based on the implied equivalence between aspirin and non-treatment in the 2019 AHA/ACC/HRS guidelinesCitation8.
The effects of treatment on risks of ischemic stroke, hemorrhagic stroke, and GI bleeds were obtained from a combination of clinical trials and real-world evidence. Ischemic stroke risk was assumed to be identical between DOACs and warfarin based on findings from a meta-analysis of four phase 3 randomized clinical trials comparing the efficacy and safety of DOACs with warfarin for stroke prevention in patients with AF; DOACs included dabigatran, rivaroxaban, apixaban, and edoxabanCitation29. The risk of ischemic stroke for warfarin and aspirin were based on an evaluation of adults with NVAF using real-world data from a large integrated healthcare system in Northern California; the crude rate ratio for aspirin was used as a proxy for the baseline risk of ischemic strokeCitation7. The same assumption about the comparative effectiveness of DOACs and warfarin was applied to the 85+ subpopulation. GI bleed rates for DOACs were generated by applying relative risks to the bleed rates for the warfarin population, the source for which also reported GI bleed rates for the general populationCitation28. Based on the AVERROES trial of apixaban and the assumption of comparable risks across the DOAC class, the risk of hemorrhagic stroke for nontreatment was assumed to be identical to the risk for DOACsCitation30.
Mortality rates for index ischemic and hemorrhagic stroke events were obtained from a retrospective analysis of administrative claims data, from 2005 to 2011, among adult (≥18 years) AF patientsCitation31.
Economic inputs
Economic inputs were sourced from a drug pricing database, economic models, administrative claims data analyses, and other published economic studies. All costs were inflated to 2020 USD using the medical care component of the Consumer Price Index (CPI)Citation32.
A 2018 CMS analysis was used to extract annual Medicare medication costs for the four DOACs under study, with unit costs coming from CMS and dosing from each DOAC’s product labelCitation10–13,Citation33. A weighted average annual drug cost was estimated based on the wholesale acquisition cost (WAC) and projected market share for each DOAC, the latter of which came from the ARISTOPHANES study of US Medicare and commercial claims databasesCitation27. The drug acquisition cost for warfarin was obtained from a previous cost-effectiveness analysis of oral anticoagulants, and included the two INR monitoring tests per year based on warfarin’s product labelCitation34.
Ischemic and hemorrhagic stroke events were stratified based on fatal and non-fatal events according to data available from an analysis of Medicare administrative claims data and the Rochester Stroke RegistryCitation5,Citation18,Citation35,Citation36. Generally, fatal ischemic and hemorrhagic stroke events assumed a one-time index event cost whereas non-fatal ischemic and hemorrhagic stroke events additionally assumed 11 months of follow-up costs. Index event costs were based on the Medicare analysis which classified hospital discharge data by ICD-9 primary diagnosis code groups. Monthly follow-up costs were based off inpatient and outpatient acute care activity 12 months after an initial stroke event. Additionally, the direct medical cost of a GI bleeding event (all non-fatal) was assumed to be equivalent to the median payment of a GI hemorrhage with complication, using data from the Healthcare Cost and Utilization Project (HCUP) as detailed in Patel 2014Citation5,Citation18.
For the societal perspective, to calculate productivity loss, average wages and age-specific rates of employment were obtained from the Bureau of Labor Statistics (BLS), and days in hospital per stroke or per bleeding event were obtained from published literatureCitation37–41. Caregiver burden was calculated on a per-stroke basis based on published literatureCitation6. For both productivity loss and caregiver burden, stroke-specific costs were applied to both ischemic and hemorrhagic strokes.
Model outcomes
Clinical and economic outcomes were estimated for the overall population as well as for the subgroup of patients 85+ years of age. Clinical outcomes included the total annual number of ischemic stroke, hemorrhagic stroke, and GI bleeding events, as well as the total annual number of deaths from ischemic and hemorrhagic strokes. For the payer perspective, economic outcomes included total annual direct medical costs, with disaggregated results presented for pharmacy and non-pharmacy medical costs. The societal perspective adds productivity and caregiver costs.
Clinical and economic outcomes in the hypothetical scenario analysis matched the base case analysis. Incremental differences in event counts and total annual direct medical costs across base case and hypothetical scenarios were reported. For the payer perspective, incremental costs were presented in aggregate and per-member per-month (PMPM).
Sensitivity analysis
To test the robustness of the base case results against potential variation in input parameters, multiple one-way sensitivity analyses (OWSA) were conducted using base case model parameters. All parameters, including population input parameters, the overall OAC treatment rate, the intervention mix, the increase in the proportion treated in the hypothetical scenario, clinical input parameters, and economic input parameters, were tested to evaluate the variability of model findings based on alterations to base case input values. Each parameter was varied individually by 15% above and below the corresponding base case value. Only the top 20 parameters, based on influence on model results, are presented in the tornado diagram.
Results
Base case and scenario analysis results for the overall and subgroup populations are provided in .
Base case analysis
Overall population
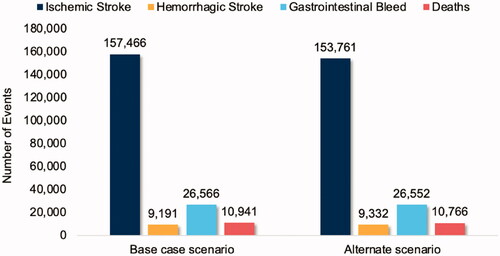
Using CMS Medicare enrollment statistics, 51.3 million Medicare beneficiaries entered the model, of whom 3,985,087 were diagnosed with NVAF and were eligible for anticoagulation. Based on observed real-world treatment rates, 1,952,693 (49%) Medicare patients with NVAF were treated with anticoagulants, 1,889,624 of them high-risk patients (CHA2DS2-VASc score ≥2) and 63,069 moderate risk patients (CHA2DS2-VASc score = 1). Over the course of a year, observed treatment rates were associated with 166,657 total stroke events, comprised of 157,466 ischemic stroke events and 9,191 hemorrhagic stroke events. Among the total stroke events, 10,941 events were found to be fatal. In addition, 26,566 GI bleeds occurred, all nonfatal. presents annual clinical outcomes for the overall Medicare population.
Figure 3. Annual clinical outcomes for the overall Medicare population, presented for the base case and hypothetical scenario analyses.
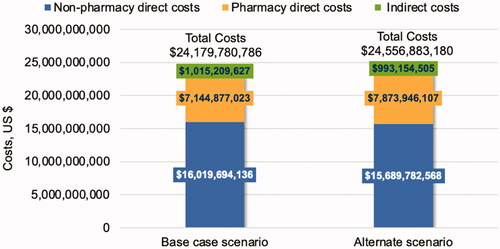
When considering the payer perspective, the one-year base case direct cost burden of NVAF was estimated to be $23.16 billion, which was comprised of $14.72 billion in ischemic stroke costs followed by $7.14 billion in pharmacy costs, $1.07 billion in hemorrhagic stroke costs, and $222 million in GI bleed costs. When considering the societal perspective, indirect costs associated with work productivity lost and caregiver burden contributed more than $1.02 billion in additional costs, totaling $24.18 billion in direct plus indirect costs per year. Moreover, more than 2.5 million work days were lost due to stroke and GI bleed events. presents annual economic outcomes for the overall Medicare population from the societal perspective.
Figure 4. Annual economic outcomes for the overall Medicare population from the societal perspective, presented for the base case and hypothetical scenario analyses.
Subgroup population
Using CMS Medicare enrollment statistics, 6,669,000 high-risk elderly (85+ years of age) Medicare beneficiaries entered the model, of whom 918,049 were diagnosed with NVAF and were eligible for anticoagulation. Twenty-three percent (N = 449,844) of eligible high-risk elderly Medicare beneficiaries were treated with anticoagulants. Over the course of a year, 50,961 total stroke events were observed, including 48,840 and 2,121 ischemic and hemorrhagic stroke events, respectively. Among the total stroke events, 3,225 events were found to be fatal. In addition, 6,118 non-fatal GI bleeds were estimated.
Total direct costs of NVAF care for the Medicare subpopulation were $6.52 billion based on observed treatment rates, including $4.58 billion in ischemic stroke costs followed by $1.64 billion in pharmacy costs, $248 million in hemorrhagic stroke costs, and $51 million in GI bleed costs. When considering the societal perspective, indirect costs associated with work productivity lost and caregiver burden contributed $306.53 million in additional costs, resulting in $6.83 billion in direct plus indirect costs per year. Indirect costs in this subgroup population were due mostly to the caregiver burden ($295.27 million). This subgroup contributes to 28% of both direct and indirect costs, as well as 29% of fatal events, of the overall Medicare population.
Scenario analysis
Overall population
After applying alternate treatment rates based on an assumed 5% increase in the overall rate of OAC treatment, 192,819 more high-risk patients and 6,436 more moderate risk patients were treated as compared to the base case. Over the course of a year, there were 3,705 fewer ischemic stroke events and 14 fewer GI bleed events, but an increase of 141 hemorrhagic stroke events, resulting in a net reduction of 175 deaths.
Compared to the base case, the one-year direct cost burden of NVAF for the Medicare system resulted in cost savings of $346.26 million in ischemic stroke costs and $114,494 in GI bleed costs, but an increase of $729.07 million in pharmacy costs and $16.47 million in hemorrhagic stroke costs. The total incremental budget impact associated with a 5% increase in overall OAC use was found to be $399.16 million, which translates to $0.65 PMPM.
In the second hypothetical scenario analysis, assuming a 5% absolute increase in DOAC use and no increase in warfarin use, the model yielded 3,705 fewer ischemic stroke events, 85 additional GI bleeds, and the same number of hemorrhagic stroke events, resulting in 207 fewer deaths as compared to the base case. Corresponding cost differences for ischemic stroke events (savings of $346.2 million), GI bleeds ($708,429), and NVAF-related pharmacy costs ($1.06 billion) summed to an additional total cost burden of $718.0 million. Compared to the base case, a 5% absolute increase in DOAC use leads to a $1.17 PMPM budget impact.
When considering the societal perspective, an assumed 5% increase in overall OAC use led to indirect cost savings of $22.06 million, comprised mostly of savings in caregiver burden ($20.96 million), and total incremental costs of $377.10 million.
Subgroup population
With a 5% increase in the overall rate of OAC treatment in this subpopulation, 45,902 more patients were treated as compared to the base case. Over the course of a year, 885 fewer strokes and 44 fewer deaths were observed, resulting in a total incremental budget impact of $84.8 million (PMPM incremental budget impact of $0.14). When considering the societal perspective, indirect cost savings of $5.4 million were found, leading to total incremental costs of $79.4 million.
Sensitivity analysis
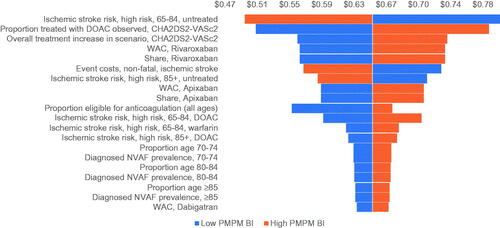
Multiple OWSAs were conducted to evaluate the sensitivity of the incremental PMPM budget impact to variations in model input values. As shown in , the payer perspective model was most sensitive to variations in the ischemic stroke risk for ages 65–84, followed by the intervention mix (i.e. the proportion of patients with CHA2DS2-VASc score >2 treated with DOACs), the annual cost of non-fatal ischemic stroke events, and the increase in the proportion treated in the hypothetical scenario for patients with CHA2DS2-VASc score >2. Model outputs are also sensitive to variation in treatment costs for the most commonly used DOACs, suggesting that potential rebates for treatment costs could have a major impact on budget impact. The societal perspective generally follows the behavior of the payer perspective regarding the sensitivity of model results to the input parameters listed above; it is important to note that the model was not found to be sensitive to variations in productivity losses or informal care costs in the societal perspective.
Figure 5. Sensitivity analysis results for the overall Medicare population from the payer perspective, presented as PMPM. Abbreviations. BI, budget impact; DOAC, direct oral anticoagulant; NVAF, non-valvular atrial fibrillation; PMPM, per-member per-month; WAC, wholesale acquisition cost.
Discussion
In this analysis, we developed and implemented a decision-analytic model to evaluate the annual clinical outcomes and financial implications of increasing the rate of OAC treatment among Medicare beneficiaries with NVAF. Based on a hypothetical 5% increase in the overall OAC treatment rate, the annual number of ischemic stroke events in the Medicare population would be reduced by 3,705 events (2.35% reduction from the base case), leading to a reduction in annual ischemic stroke-related direct medical costs of over $346 million. When also considering the direct medical costs associated with the reduction in GI bleed events, the increase in hemorrhagic stroke events, and the increase in pharmacy use, the total annual financial impact to the Medicare system resulted in additional costs of nearly $400 million or $0.65 PMPM. Based on a hypothetical 5% increase in DOAC use, the total annual financial impact to the Medicare system resulted in additional costs of $718.0 million, or $1.17 PMPM, due to the reduction in ischemic stroke event costs and the increase in GI bleeds and NVAF-related pharmacy costs. When accounting for the societal perspective, including patient-related productivity loss and caregiver burden, the total annual financial impact was reduced to $377 million. In a subset of the Medicare population, among those patients with the highest risk of stroke (i.e. those ≥85 years of age), the total financial impact was reduced to $0.14 PMPM when considering the impact on direct medical costs only, providing evidence of the costs and benefits of treating the most at-risk patients with OACs.
These model findings can be considered conservative based on our approach and the availability of select model input values. The model was constructed using a short, 1-year time horizon and did not evaluate the risks of subsequent stroke events following the abbreviated model time horizon. The literature indicates up to a 30% risk of a recurrent stroke event by 5 years following an index stroke eventCitation42–45. The risks, direct medical costs, and indirect costs of recurrent stroke events beyond the first year were therefore not included in our model. Extending the model time horizon beyond 1 year would have resulted in greater avoidable stroke-related costs in subsequent years, but would have also increased pharmacy costs for management of this chronic condition. Additionally, the model assumed perfect adherence to anticoagulant use in the 1-year model time horizon, despite this unlikely observation in the real-world. Doing so required that patients were treated with a distribution of DOACs and warfarin for the full 1-year period, thus leading to the maximum possible costs and OAC treatment effect associated with pharmacy use during that period. Moreover, the model does not include treatment rebates, as existing sources are unclear about how broadly they would apply across Medicare; including treatment rebates would yield lower pharmacy costs and thus a lower overall financial impact while maintaining the same clinical implications of increased OAC use. Finally, during the development of this model, practicing clinicians noted that efficacy assumptions based on published trial results and older real-world studies may underestimate the current real-world efficacy of anticoagulants in general and DOACs in particular. In fact, sensitivity analyses suggest that increased rates of anticoagulant treatment substantially reduce incremental PMPM costs when modeling with a higher relative reduction in ischemic stroke events compared to the untreated population. The findings from this economic model are based on conservative estimates of treatment efficacy and cost, and further research in these areas could provide additional clarity into the financial implications of increased anticoagulant use.
Comparison to literature
There are few published economic models evaluating the impact of increased anticoagulant use among patients with NVAF. In a prior economic analysis, Patel et al. assessed the impact of increased rates of anticoagulant therapy among Medicare-eligible patients in the USCitation18. The authors found that a hypothetical 10% increase in anticoagulant use among NVAF patients would reduce ischemic stroke events by approximately 9%. In comparison, our model found a 2% decrease in ischemic stroke events assuming a 5% increase in anticoagulant use. Differences in model assumptions and input values likely resulted in differences in model findings, as our model applied more conservative input values from newer sources, including real-world baseline stroke risks and efficacy of warfarinCitation7,Citation23. As a result, Patel et al. found annual direct medical cost savings to Medicare of $187 million (2008 USD) for every 1 million eligible patients with AF. In contrast, increased use of anticoagulant use in our model led to additional costs of $377 million to Medicare assuming a 5% increase in anticoagulant use and 4 million Medicare beneficiaries with AF. However, the Patel et al. model was developed before the widespread introduction of DOACs, and only included the relatively inexpensive cost of generic warfarin, thus not incorporating the clinical benefits or costs associated with DOACs.
Limitations
The limitations of our study were centered around selected model input values. One of the primary input parameters included the proportion of NVAF patients treated with OACs entering the model, stratified by moderate and high risks of stroke. At the time of model development, the value for this parameter was based on a poster presentation of Medicare patients with NVAF and had not undergone review in a peer-reviewed journalCitation17. However, sensitivity analyses demonstrated little to no variation in the incremental difference between the base case and hypothetical scenario analysis when this input value was tested. Moreover, further details on age-specific inputs including eligibility for anticoagulation, event risks, and treatment efficacy would have benefitted the model; instead, assuming identical proportions eligible for anticoagulation, event risks, and treatment efficacy across age groups may have conceded further specificity in model findings. Furthermore, further details regarding the risk of ischemic stroke based on sex and/or CHA2DS2-VASc score would have provided further specificity in model calculations; however, estimates specifically from the US Medicare setting were unavailable from the literature at the time of model development. Further study is also warranted to update direct medical costs of ischemic and hemorrhagic strokes and GI bleeds, as the sources used by this model are nearly 10 years old and may be considered obsolete given changes to practice patterns over time. Also, while ischemic and hemorrhagic stroke events were stratified based on fatal and non-fatal events, non-fatal strokes were not further stratified by severity level due to the limited published data on DOAC efficacy and US direct medical costs associated with stroke severity. Additionally, societal cost input parameters were limited to work productivity loss and informal caregiver cost; due to the lack of US-based estimates in the literature specific for Medicare patients with AF, we were unable to incorporate productivity losses from travel to warfarin INR monitoring centers for patients or caregivers or work days lost following recovery from a non-fatal stroke. Exclusion of productivity losses from travel and/or work days lost following stroke recovery underestimated the societal benefit of increased OAC use in the hypothetical scenario; in other words, the difference in total direct and indirect costs between the hypothetical and base case scenarios would have been reduced further in the societal perspective had these parameters been included.
Conclusions
The cost implications of stroke events among Medicare-eligible beneficiaries with NVAF may have an unsustainable financial impact on the Medicare system in the coming years as the number of Medicare beneficiaries continues to increase over time. Based on the findings from our analysis, increasing the overall rate of OAC use among Medicare-eligible beneficiaries with NVAF, even modestly, led to reductions in direct medical costs associated with ischemic stroke events, a slight increase to the overall budget impact to the Medicare system, and a reduction in the indirect costs borne by society.
Transparency
Declaration of funding
This study was sponsored by the Bristol Myers Squibb/Pfizer Alliance.
Declaration of financial/other interests
MDF, JG, IS, and MC are employees of Pfizer Inc. MF and JG are employees of Bristol Myers Squibb. MS, CT, and NA are employees of Panalgo who were paid consultants to the Bristol Myers Squibb/Pfizer Alliance in connection with the development of this manuscript. GB received consulting honoraria with regards to the development of the project design and interpretation. GB received no honoraria for his authorship activities of this manuscript.
Peer reviewers on this manuscript have received an honorarium from JME for their review work but have no other relevant financial relationships to disclose.
Acknowledgements
There are no further acknowledgements.
Correction Statement
This article has been corrected with minor changes. These changes do not impact the academic content of the article.
Notes
i Pradaxa is a registered trademark of Boehringer-Ingelheim, Connecticut, USA.
ii Xarelto is a registered trademark of Janssen, New Jersey, USA.
iii Eliquis is a registered trademark of Pfizer, New York, USA & Bristol Myers Squibb, New Jersey, USA.
iv Savaysa is a registered trademark of Daiichi Sankyo, New Jersey, USA.
References
- January CT, Wann LS, Alpert JS, et al. 2014 AHA/ACC/HRS guideline for the management of patients with atrial fibrillation: a report of the American College of Cardiology/American Heart Association Task Force on practice guidelines and the Heart Rhythm Society. Circulation. 2014;130(23):e199–e267.
- Colilla S, Crow A, Petkun W, et al. Estimates of current and future incidence and prevalence of atrial fibrillation in the U.S. Adult population. Am J Cardiol. 2013;112(8):1142–1147.
- Go AS, Hylek EM, Phillips KA, et al. Prevalence of diagnosed atrial fibrillation in adults: National implications for rhythm management and stroke prevention: the AnTicoagulation and risk factors in atrial fibrillation (ATRIA) study. JAMA. 2001;285(18):2370.
- Wolf PA, Abbott RD, Kannel WB. Atrial fibrillation as an independent risk factor for stroke: the framingham study. Stroke. 1991;22(8):983–988.
- Freeman JV, Zhu RP, Owens DK, et al. Cost-effectiveness of dabigatran compared with warfarin for stroke prevention in atrial fibrillation. Ann Intern Med. 2011;154(1):1–11.
- Joo H, Dunet DO, Fang J, et al. Cost of informal caregiving associated with stroke among the elderly in the United States. Neurology. 2014;83(20):1831–1837.
- Go AS, Hylek EM, Chang Y, et al. Anticoagulation therapy for stroke prevention in atrial fibrillation: how well do randomized trials translate into clinical practice? JAMA. 2003;290(20):2685–2692.
- January CT, Wann LS, Calkins H, et al. 2019 AHA/ACC/HRS focused update of the 2014 AHA/ACC/HRS guideline for the management of patients with atrial fibrillation: a report of the american college of cardiology/american heart association task force on clinical practice guidelines and the heart rhythm society in collaboration with the society of thoracic surgeons. Circulation. 2019;140(2):e125–e151.
- Stangier J, Clemens A. Pharmacology, pharmacokinetics, and pharmacodynamics of dabigatran etexilate, an oral direct thrombin inhibitor. Clin Appl Thromb Hemost. 2009;15(1_suppl):9S–16S.
- Food & Drug Administration. Pradaxa highlights of prescribing information. Published online October 2010; [cited 2020 July 16]. Available from: https://www.accessdata.fda.gov/drugsatfda_docs/label/2010/022512s000lbl.pdf.
- Food & Drug Administration. Xarelto highlights of prescribing information. Published online November 2012; [cited 2020 July 16]. Available from: https://www.accessdata.fda.gov/drugsatfda_docs/label/2012/022406s001s002s003lbl.pdf.
- Food & Drug Administration. Eliquis highlights of prescribing information. Published online December 2012; [cited 2020 July 16]. Available from: https://www.accessdata.fda.gov/drugsatfda_docs/label/2012/202155s000lbl.pdf.
- Food & Drug Administration. Savaysa highlights of prescribing information. Published online January 2015; [cited 2020 July 18]. Available from: https://www.accessdata.fda.gov/drugsatfda_docs/label/2015/206316lbl.pdf.
- Casciano JP, Dotiwala ZJ, Martin BC, et al. The costs of warfarin underuse and nonadherence in patients with atrial fibrillation: a commercial insurer perspective. J Manag Care Pharm. 2013;19(4):302–316.
- Mazurek M, Huisman MV, Rothman KJ, et al. Regional differences in antithrombotic treatment for atrial fibrillation: insights from the GLORIA-AF phase II registry. Thromb Haemost. 2017;117(12):2376–2388.
- Di Fusco M, Sussman M, Barnes G, et al. The burden of nontreatment or undertreatment among non-valvular atrial fibrillation patients with elevated stroke risk: a systematic literature review of real-world evidence. Circulation. 2020;142(Suppl_3):A15651.
- Munir B, Hlavacek P, Keshishian A, et al. Underutilization of oral anticoagulant therapy among elderly patients with atrial fibrillation: insights from the United States medicare database. J Am Coll Cardiol. 2021;77(18):1641.
- Patel AA, Ogden K, Veerman M, et al. The economic burden to medicare of stroke events in atrial fibrillation populations with and without thromboprophylaxis. Popul Health Manag. 2014;17(3):159–165.
- Centers for Medicare & Medicaid Services. 2018 medicare enrollment section of CMS program statistics. Published online February 13, 2020; [cited 2021 April 7]. Available from: cms.gov/research-statistics-data-systems/cms-program-statistics/2018-medicare-enrollment-section.
- Turakhia MP, Shafrin J, Bognar K, et al. Estimated prevalence of undiagnosed atrial fibrillation in the United States. PLoS One. 2018;13(4):e0195088.
- Marzec LN, Wang J, Shah ND, et al. Influence of direct oral anticoagulants on rates of oral anticoagulation for atrial fibrillation. J Am Coll Cardiol. 2017;69(20):2475–2484.
- Hsu JC, Maddox TM, Kennedy KF, et al. Oral anticoagulant therapy prescription in patients with atrial fibrillation across the spectrum of stroke risk: insights from the NCDR PINNACLE Registry. JAMA Cardiol. 2016;1(1):55–62.
- Friberg L, Rosenqvist M, Lip GYH. Evaluation of risk stratification schemes for ischaemic stroke and bleeding in 182,678 patients with atrial fibrillation: the Swedish atrial fibrillation cohort study. Eur Heart J. 2012;33(12):1500–1510.
- Lip GYH, Nieuwlaat R, Pisters R, et al. Refining clinical risk stratification for predicting stroke and thromboembolism in atrial fibrillation using a novel risk Factor-Based approach: the euro heart survey on atrial fibrillation. Chest. 2010;137(2):263–272.
- Singer DE, Chang Y, Borowsky LH, et al. A new risk scheme to predict ischemic stroke and other thromboembolism in atrial fibrillation: the ATRIA study stroke risk score. JAHA. 2013;2(3):250.
- Patti G, Lucerna M, Pecen L, et al. Thromboembolic risk, bleeding outcomes and effect of different antithrombotic strategies in very elderly patients with atrial fibrillation: a sub-analysis from the PREFER in AF (PREvention of thromboembolic Events-European registry in atrial fibrillation). J Am Heart Assoc. 2017;6(7):5657.
- Lip GYH, Keshishian A, Li X, et al. Effectiveness and safety of oral anticoagulants among nonvalvular atrial fibrillation patients: the ARISTOPHANES study. Stroke. 2018;49(12):2933–2944.
- Fang MC, Go AS, Hylek EM, et al. Age and the risk of Warfarin-Associated hemorrhage: the anticoagulation and risk factors in atrial fibrillation study: age and warfarin-associated hemorrhage risk. J Am Geriatr Soc. 2006;54(8):1231–1236.
- Ruff CT, Giugliano RP, Braunwald E, et al. Comparison of the efficacy and safety of new oral anticoagulants with warfarin in patients with atrial fibrillation: a meta-analysis of randomised trials. The Lancet. 2014;383(9921):955–962.
- Connolly SJ, Eikelboom J, Joyner C, et al. Apixaban in patients with atrial fibrillation. N Engl J Med. 2011;364(9):806–817.
- Sussman M, Menzin J, Lin I, et al. Impact of atrial fibrillation on stroke‐related healthcare costs. J Am Heart Assoc. 2013;2(6):479.
- US Bureau of Labor Statistics. Consumer price index for all urban consumers: medical care in U.S. City Average. Published online August 2020; [cited 2020 Aug 21]. Available from https://data.bls.gov/timeseries/CUUR0000SAM.
- Centers for Medicare & Medicaid Services. Medicare part D drug spending dashboard & data. Published online December 22, 2020; [cited 2021 Aug 7]. Available from: https://www.cms.gov/Research-Statistics-Data-and-Systems/Statistics-Trends-and-Reports/Information-on-Prescription-Drugs/MedicarePartD.
- Wang C-Y, Pham PN, Thai TN, et al. Updating the cost effectiveness of oral anticoagulants for patients with atrial fibrillation based on varying stroke and bleed risk profiles. Pharmacoeconomics. 2020;38(12):1333–1343.
- Leibson CL, Hu T, Brown RD, et al. Utilization of acute care services in the year before and after first stroke: a population-based study. Neurology. 1996;46(3):861–869.
- Holloway RG, Witter DM, Lawton KB, et al. Inpatient costs of specific cerebrovascular events at five academic medical centers. Neurology. 1996;46(3):854–860.
- US Bureau of Labor Statistics. Average hours per day spent in selected activities by age. Published online June 25, 2020; [cited 2021 Aug 6]. Available from: https://www.bls.gov/charts/american-time-use/activity-by-age.htm.
- US Bureau of Labor Statistics. Average hourly and weekly earnings of all employees on private nonfarm payrolls by industry sector, seasonally adjusted; [cited 2021 Aug 18]. Available from: https://www.bls.gov/news.release/empsit.t19.htm.
- Charlton B, Adeboyeje G, Barron JJ, et al. Length of hospitalization and mortality for bleeding during treatment with warfarin, dabigatran, or rivaroxaban. PLoS One. 2018;13(3):e0193912.
- Fanikos J, Grasso-Correnti N, Shah R, et al. Major bleeding complications in a specialized anticoagulation service. Am J Cardiol. 2005;96(4):595–598.
- Thygesen SK, Frost L, Eagle KA, et al. Atrial fibrillation in patients with ischemic stroke: a population-based study. Clin Epidemiol. 2009; 1:55–65.
- Burn J, Dennis M, Bamford J, et al. Long-term risk of recurrent stroke after a first-ever stroke. The oxfordshire community stroke project. Stroke. 1994;25(2):333–337.
- Kolominsky-Rabas PL, Weber M, Gefeller O, et al. Epidemiology of ischemic stroke subtypes according to TOAST criteria: incidence, recurrence, and long-term survival in ischemic stroke subtypes: a population-based study. Stroke. 2001;32(12):2735–2740.
- Mohan KM, Crichton SL, Grieve AP, et al. Frequency and predictors for the risk of stroke recurrence up to 10 years after stroke: the South london stroke register. J Neurol Neurosurg Psychiatry. 2009;80(9):1012–1018.
- Mohan KM, Wolfe CDA, Rudd AG, et al. Risk and cumulative risk of stroke recurrence: a systematic review and meta-analysis. Stroke. 2011;42(5):1489–1494.