
Abstract
Objective
To evaluate the predictive performance of logistic and linear regression versus machine learning (ML) algorithms to identify patients with rheumatoid arthritis (RA) treated with target immunomodulators (TIMs) using only pharmacy administrative claims.
Methods
Adults aged 18–64 years with ≥1 TIM claim in the IBM MarketScan commercial database were included in this retrospective analysis. The predictive ability of logistic regression to identify RA patients was compared with supervised ML classification algorithms including random forest (RF), decision trees, linear support vector machines (SVMs), neural networks, naïve Bayes classifier, linear discriminant analysis (LDA), quadratic discriminant analysis (QDA), and K-nearest neighbors (k-NN). Model performance was evaluated using F1 score, accuracy, precision, sensitivity, area under the receiver operating characteristic curve (AUROC), and Matthews correlation coefficient (MCC). Analyses were conducted in all-patient and etanercept-only samples.
Results
In the all-patients sample, ML approaches did not outperform logistic regression. RF showed small improvements versus logistic regression that were not considered remarkable, respectively: F1 score (84.55% vs 83.96%), accuracy (84.05% vs 83.79%), sensitivity (84.53% vs 82.20%), AUROC (84.04% vs 83.85%), and MCC (68.07% vs 67.66%). Findings were similar in the etanercept samples.
Conclusion
Logistic regression and ML approaches successfully identified patients with RA in a large pharmacy administrative claims database. The ML algorithms were no better than logistic regression at prediction. RF, SVMs, LDA, and ridge classifier showed comparable performance, while neural networks, decision trees, naïve Bayes classifier, and QDA underperformed compared with logistic regression in identifying patients with RA.
Introduction
Research over the past decade has shown that classification algorithms are useful in healthcare-related analysis to identify patients with chronic conditionsCitation1,Citation2. These algorithms rely on the use of large administrative datasets such as medical and pharmacy insurance claims, which typically capture medical diagnoses, procedures, drug utilization, hospitalizations, costs, and mortality, and are commonly used for epidemiological and health services research purposes, such as identification of safety signals and assessment of healthcare resource utilizationCitation3,Citation4. While the identification of patients with chronic conditions may be useful by itself, the development and validation of novel machine learning (ML) methods should be tied to a pragmatic end. As Lindsell et al.Citation5 point out, it is necessary to examine “what system change the artificial intelligence tool is expected to precipitate”.
Rheumatoid arthritis (RA) is one such chronic autoimmune disease characterized by pain, stiffness, swelling, and tenderness of the synovial joints leading to severe disability and premature mortalityCitation6. The disease has a significant negative impact on the ability to perform daily activities and impairs health-related quality of life. It is estimated to affect approximately 1.3 million adults in the US with a lifetime prevalence of 0.5 to 1%Citation7–9. Supervised ML algorithms have been used to predict the risk of major chronic diseases with low incidence rates, including cardiovascular diseases, chronic kidney disease, diabetes, and hypertensionCitation10. Previous studies of supervised ML in RA showed that ML models were used to predict disease activityCitation11–13, disease phenotypesCitation14, treatment responseCitation15,Citation16, flaresCitation17, radiographic destructionCitation18, and RA-related mortalityCitation19 using claims data paired with electronic medical records. Curtis et al.Citation3 developed and validated an administrative claims data–based algorithm to predict the effectiveness of biologic disease-modifying antirheumatic drugs, which showed good performance with acceptable sensitivity, specificity, and positive and negative predictive values. The algorithms developed to date to measure treatment effectiveness depend on the use of medical and pharmacy claims, where medical diagnostic codes are readily available. However, none of the studies to date assessed the predictive performance of these algorithms in identifying patients with RA using pharmacy claims data alone, which is more accessible to pharmacies and payers, and may therefore facilitate more efficient, informed decisions. While linked medical plus pharmacy claims provide richer, more accurate data for researchers and policymakers, these tend to be more complex and costly. Pharmacy claims are cheaper and may be more accessible to non-institutional researchers and some policymakers looking to help patients with their medication adherence and remove barriers to treatment. Pharmacy claims-based analyses may also help payers and manufacturers assess treatment patterns, drug utilization, healthcare resource utilization and costs, and design and evaluate value-based care arrangements, such as those focused on prescribed treatment effectiveness.
In this study, we sought to identify patients with RA using only pharmacy claims data without medical diagnostic codes, to support future work exploring measurement of therapeutic effectiveness based on pharmacy claims alone. Our primary objective was to derive and test the predictive performance of linear and logistic regression and supervised ML algorithms to classify patients with RA among those prescribed target immunomodulators (TIMs) according to pharmacy claims data for commercially insured adults in the US.
Methods
Data source
This study used pharmacy administrative claims data for commercially insured adults from the IBM MarketScan commercial claims and encounters database (IBM Watson Health, www.ibm.com/products/marketscan-research-databases, Armonk, NY, USA). The MarketScan databases are constructed from privately and publicly insured paid medical and prescription drug claims that are linked and fully adjudicated. The data contributors are large employers, health plans, and state Medicaid agencies. The commercial claims database contains the inpatient, outpatient, and outpatient prescription drug claims of approximately 148 million employees and their dependents between 1995 and 2017Citation20,Citation21. Healthcare for these individuals is provided under a variety of health plans with fee-for-service and capitated payment arrangements, including preferred provider organizations (PPOs), point-of-service plans, indemnity plans, and health maintenance organizations (HMOs)Citation20. The commercial database includes diagnosis codes (in International Classification of Diseases, Ninth and Tenth Revision, Clinical Modification), procedure codes (in Current Procedural Terminology code-4 and Healthcare Common Procedure Coding System formats), and both retail and mail order prescription records. Additional data elements include demographic variables (age, gender, geographic region), product type (e.g. HMO, PPO), payer type (e.g. commercial, self-pay), and eligibility dates related to plan enrollment and participation. No data elements from medical claims were used in this study except the diagnostic codes data elements to evaluate model performance (see data processing and model development section).
Study population
We analyzed commercial claims and encounters from US adults using TIMs between 1998 and 2019. Patients aged 18–64 years with complete demographic and enrollment data and ≥1 pharmacy claim for etanercept, adalimumab, certolizumab pegol, golimumab, abatacept, tocilizumab, sarilumab, or tofacitinib during the study period were included. We did not include infliximab, as this TIM was not dispensed at the pharmacy. Patients aged <18 years or ≥65 years were excluded, as were those with a claim for >1 TIM of interest on a single date. The date of the first claim meeting the eligibility criteria was defined as the index date, and the TIM was the index TIM for that patient.
Data processing and model development
Patients were assigned to RA and TIM treatments based on their index TIM. A drug matrix was constructed so that each patient was represented by a unique row, and each of the 500 most frequently used drugs plus 8 TIMs were represented in columns. Thus, the drug matrix contains the claims data of all prior and concomitant medications used along with the index TIM. Each value in the matrix was presented in a binary format based on whether the patient had been exposed (1) or not exposed (0) to a certain drug. Five different data samples were constructed: (1) All-patients sample, included all patients who met the eligibility criteria described above; (2) all-etanercept sample, included patients who used etanercept at any timepoint during the study period; (3) etanercept-90, included patients who received etanercept for 90 days in a year (i.e. patients with at least another claim between the first claim and the end of period [90 days]); (4) etanercept-180, included patients who received etanercept for 180 days in a year; and (5) etanercept-270, included patients who received etanercept for 270 days in a year. These four etanercept-only samples were designed to evaluate whether the models would perform as well using a single drug, and whether assigning increasingly stricter drug usage criteria for patient inclusion would improve the performance of the predictive algorithms. Patients received more than one TIM during the study period and this analysis included those with any number of claims with minimum data processing.
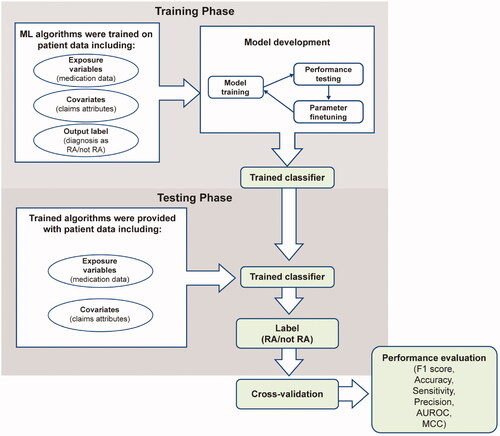
The training data consisted of a 650+ column matrix containing medication data of all prior and/or concomitant medications used along with TIMs, claims attributes (treatment start date, treatment end date, NDC code, quantity, days of supply, dispensing fee, ingredient cost, metric quantity, mail/retail order, refill number, treatment cost, average wholesale price, net payment, physician specialty flag, sales tax, capitated service indicator, coordination of benefits and other savings, coinsurance, copay, etc.), and a label for the presence or absence of an RA diagnosis. The testing dataset consisted of medication data and claims attributes without the RA diagnosis label (). The output obtained from the testing algorithm was cross-validated using the diagnostic code from the medical claims in MarketScan to evaluate model performance. The diagnostic code that was closest to the index date and to subsequent pharmacy claims for each medication was used for this purpose.
Figure 1. Overview of model development and evaluation. AUROC, area under the receiver operating characteristic curve; MCC, Matthews correlation coefficient; ML, machine learning; RA, rheumatoid arthritis.
Prediction models and performance metrics
We applied statistical and ML algorithms appropriate for analysis of binary variables to the pharmacy claims dataset to test their predictive performance in identifying a patient with an RA diagnosis. We compared our benchmark methods, linear (Ordinary Least Squares [OLS]) and logistic regression models to supervised ML algorithms, including K-nearest neighbors (k-NN), linear and quadratic discriminant analysis, naïve Bayes classifier, decision trees, random forest (RF), support vector machines (SVMs), and neural networks, in terms of sensitivity, specificity, accuracy, precision, F1 score, area under the receiver operating characteristic curve (AUROC), and Matthews correlation coefficient (MCC). We chose the ML algorithms that were commonly used in most studies, and linear and logistic regression models were the standard regression methods so considered as benchmarks in this study.
True positives (TPs) were defined as the total number of patients accurately predicted to have RA, false positives (FPs) as negative cases incorrectly classified as positive, and false negatives (FNs) as positive cases incorrectly classified as negative. Sensitivity was defined as the frequency of correctly predicted positive samples among all real positive samples, and specificity as the frequency of correctly predicted negative samples among all real negative samples. Accuracy was defined as the ability of a predictor to correctly identify all samples, whether positive or negative, and precision (or positive predictive value) as the frequency of TPs among all positive outputsCitation22.
F1 score is a measure of model accuracy that considers both precision and recall, defined as the harmonic mean of precision and sensitivityCitation22. In some cases, especially those in which classes are imbalanced, it is a better metric for predictive performance than a simple accuracy score. An F1 score reaches its best value at 1 and worst score at 0.
AUROC represents the probability that a classifier will rank a randomly chosen positive sample over a randomly chosen negative sample as more positive, where the ROC curve describes the relationship between the TP rate (sensitivity) and FP rate. The nearer the AUC is to 1, the better the model. MCC measures classification quality considering true and false positives and negatives. The MCC ranges from −1 and 1, where 1 represents a perfect model, 0 represents a model no better than random prediction, and −1 represents a model in disagreement with observationCitation22.
Data analysis
We implemented a nested cross-validation scheme to evaluate how well each model generalizes to unseen data, based on the traditional K-fold validation approachCitation23. This method consists of an outer loop, which splits the dataset into training and test folds, and an inner loop, which does a K-fold cross-validation on each of the training sets for hyperparameter optimization. Model performance is reported as the average accuracy, F1 score, and AUROC across all held-out folds in the outer loop (). For a stable model, it is expected that the hyperparameters are the same for each iteration of the outer loop. We trained all models on medication data, pharmacy claims attributes, and diagnosis as RA/not RA. We compared the performance of the ML algorithms to conventional logistic and linear regression models. In the case of disagreement between measures, where individual metrics suggested different models were better, we considered F1 to be the overall indicator of the better model.
To improve interpretability and help illustrate a “good” result, we conducted a threshold analysis between the performance of the benchmark regression models and the ML method, where a prespecified threshold of ≥10% improvement versus the best performing benchmark regression method (logistic or linear regression) would indicate a meaningful difference. We considered ≥10% change in magnitude in the F1 score as an initial, yet imperfect, approach to determining whether a model is “better” than others. The algorithm development, implementation, parameter finetuning, and performance evaluation were all performed using Python.
Results
Patient samples and treatments
A total of 410,403 patients met the eligibility criteria during the study period and were included in the all-patients sample, of which, 211,819 (51.6%) had a diagnosis of RA. Of the total patients, 184,457 (45.0%) had received etanercept at any timepoint and were included in the all-etanercept sample. Of the all-etanercept patients, 147,197 (79.9%) received etanercept for 90 days, 113,756 (61.7%) for 180 days, and 82,254 (44.6%) for 270 days in a given year and comprised the etanercept subsamples accordingly. As for the rest of the TIMs, 225,804 (55.0%) patients had a claim for adalimumab, followed by 32,500 (7.9%) for abatacept, 21,460 (5.2%) for certolizumab pegol, 19,143 (4.7%) for golimumab, 13,248 (3.2%) for tocilizumab, 13,183 (3.2%) for tofacitinib, and 962 (0.2%) for sarilumab (note: the sum of all percentages exceeds 100% as some patients received more than 1 TIM during the study period).
Predictive performance of ML algorithms versus regression models
Of all the ML algorithms, none showed an overall improvement of ≥10% versus the regression models in the F1 score. RF had numerically higher F1 score, AUROC, accuracy, sensitivity, and MCC than logistic regression in the all-patients sample, but the precision of logistic regression was greater than that of RF ( and , ).
Figure 2. F1 scores for regression models and machine learning algorithms across analytic samples. ETN, etanercept; LDA, linear discriminant analysis; QDA, quadratic discriminant analysis; RF, random forest; SVM, support vector machine.
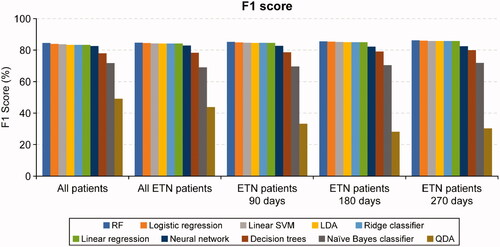
Figure 3. AUROC for regression models and machine learning algorithms across analytic samples. AUROC, area under the receiver operating characteristic curve; ETN, etanercept; LDA, linear discriminant analysis; QDA, quadratic discriminant analysis; RF, random forest; SVM, support vector machine.
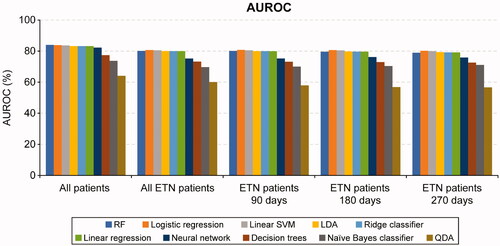
Table 1. Predictive performance of statistical functions and machine learning algorithms (all-patients sample).
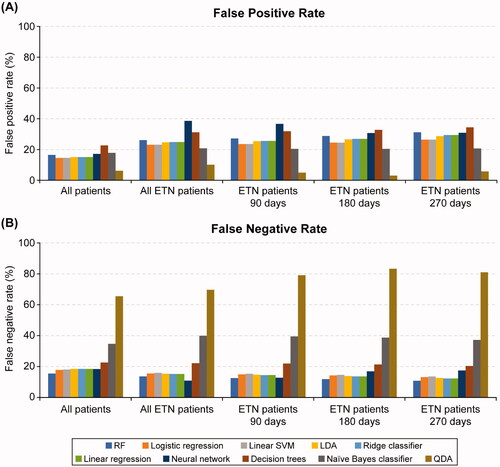
The F1 scores and AUROC metrics were generally similar for logistic regression, linear SVM, LDA, linear regression, and ridge classifier. Other ML methods including neural networks, decision trees, naïve Bayes classifier, and QDA underperformed compared with RF, linear SVM, logistic and linear regression models ( and ). Of the ML algorithms, QDA had the lowest FP rate (6.22%) while decision trees had the highest (22.65%) in the all-patients sample. RF had the lowest FN rate, while QDA, naïve Bayes classifiers, and decision trees had higher FN rates in the all-patients sample ().
Figure 4. False positive rate (A) and false negative rate (B) for regression models and machine learning algorithms across analytic samples. ETN, etanercept; LDA, linear discriminant analysis; QDA, quadratic discriminant analysis; RF, random forest; SVM, support vector machine.
We observed similar results in the all-etanercept sample, where RF showed higher F1 score (84.73% vs 84.51%) and sensitivity (86.38% vs 84.48%) than logistic regression, but logistic regression showed higher AUROC, accuracy, precision, and MCC (). Further, the other etanercept-only subsamples showed marginal improvements in performance metrics, with the etanercept-90, etanercept-180, and etanercept-270 subsamples showing no meaningful differences compared with the all-patients and all-etanercept samples ().
Table 2. Predictive performance of statistical functions and machine learning algorithms (all-etanercept patients sample).
Discussion
Identification of patients with chronic conditions such as RA has been historically limited by the lack of validated algorithms to accurately predict a diagnosis in the absence of medical diagnostic codes in pharmacy claims databases. Our study evaluates whether it is possible to identify RA patients with ML models or linear and logistic regression using variables collected in pharmacy claims data alone. While successfully identifying RA patients using pharmacy claims, our results demonstrated that the ML algorithms tested in this study did not offer any remarkable advantage over logistic regression in the accurate classification of patients with RA.
Our findings are consistent with those in other applications and conditions showing that logistic regression performs equally well or better than more complex ML methodsCitation24–26. Feng et al.Citation24 compared the predictive performance of 22 ML models against logistic regression for survival prediction in patients with severe traumatic brain injury and reported the ML models to have comparable abilities to logistic regression for outcome prediction; however, the accuracy, AUROC, sensitivity, F1 score and sensitivity of cubic SVM, quadratic SVM, and linear SVM were better than those of logistic regression. Stylianou et al.Citation26 found similar observations when comparing logistic regression with neural network, SVM, RF, and naïve Bayes classifier for mortality risk prediction from burn injury. Although some ML methods performed marginally better than logistic regression, the differences were rarely statistically significant, and logistic regression performed well against more complex ML alternatives. Kuhle et al.Citation25 reported that ML methods elastic net, classification tree, RF, gradient boosting, and neural networks did not offer any advantage over logistic regression in the prediction of fetal growth abnormalities including small for gestational age and large for gestational age outcomes. We were not surprised to see similar performance of ML approaches and traditional logistic regression, as previous studies have reached the same conclusion. These results suggest that policymakers and clinical practice professionals with no access, due to cost or other factors, to linked medical and pharmacy claims may use logistic regression to identify RA status in commercial populations. Our findings point to an easy-to-implement approach in data analysis without the need to look to other, more complex methods.
We evaluated the predictive performance of different ML models in classifying patients with RA using only pharmacy claims data and found that the investigated ML models did not consistently or meaningfully outperform logistic regression. Although RF performed marginally better than logistic regression in terms of sensitivity, accuracy, F1 score, AUROC and MCC in the all-patients sample, the differences were not substantial and did not meet the prespecified threshold of at least 10% improvement, except for FN rate with the RF technique in the all-patients sample. Since the latter was the only metric to outperform logistic regression, and the F1 score and other metrics were essentially the same, we do not consider this as enough evidence that RF is better than logistic regression at identifying RA patients. The etanercept-only subsamples, which used stricter drug usage criteria and additional data pre-processing, showed marginal gains in identification success with no meaningful differences relative to the all-patients sample and all-etanercept subsample, further strengthening the robustness of our main analysis. It is also expected that a classifier would more accurately identify a patient has RA if patient receives a TIM with a smaller number of indications (e.g. sarilumab) than a TIM with many indications. However, this additional analysis was beyond the scope of this manuscript.
Limitations and strengths
Administrative claims data are generated for the processing of payments related to healthcare resource utilization such as provider reimbursement for clinical services and prescription use, not for research purposes. As such, inherent limitations common to analyses of claims data are applicable. The diagnosis and procedure codes used to define the outcomes are subjected to potential miscoding, which may have influenced our testing, training, and analysis datasets. Our findings were limited to patients with commercial insurance, though this may not have influenced the integrity of evaluating the prediction methods as the internal validity of our study is not threatened by this study population. Since the ML models use existing data to establish predictiveness, there is a possibility that the models are overfitted or overoptimized to the training data and may not work well with unseen or new data. Further, we couldn’t find a standard threshold for comparing different statistical approaches against each other, hence we used a threshold of ≥10% improvement as a meaningful difference. Thus, future studies aiming to generalize the results of this study may look at different populations, both in commercially insured and Medicare and Medicaid patients, and at different threshold levels. In addition, diagnostic codes found in claims data are not the gold standard for identification of patients with a given illness. This is a limitation of our study. To address this, future analysis with electronic health record diagnoses may be needed to validate our results. However, they are a reasonable standard for the purposes of our study.
To the best of our knowledge, our study is the first of its kind to explore the predictive performance of supervised ML algorithms to classify patients without the addition of medical claims data. The data used for this study are fully adjudicated and <1% of patients were excluded from the study due to missing data issues. We used a large administrative claims database comprising a nationally representative sample of commercially insured adults in the US over a long study period. We were able to evaluate 8 different ML algorithms alongside linear and logistic regression model approaches, offering a substantive evaluation of modern ML techniques.
Conclusions
Our results show promising applications of prediction models in chronic disease patient identification, in particular for RA patients. Our findings also suggest that it is feasible to use pharmacy claims alone to identify patients with RA as these tend to be less expensive than medical and pharmacy claims combined. While our results are not generalizable to patient populations other than RA, researchers may use a similar approach to ours in order to help identify patients with other chronic diseases.
Transparency
Declaration of funding
This study was funded by Immunex, a wholly owned subsidiary of Amgen Inc.
Declaration of financial/other relationships
At the time of writing, E.J.M.H. was an employee and stockholder of Amgen Inc. I.T., L.A., and J.T., reports receiving consulting fees, fees for lectures, presentations, and speakers’ bureaus from Amgen Inc.
Peer reviewers on this manuscript have received an honorarium from JME for their review work but have no other relevant financial relationships to disclose.
Author contributions
All authors were involved in study conception and design, acquisition, analysis, and interpretation of data, revising the article critically for important intellectual content and approved the final version to be submitted for publication.
Data sharing policy
Qualified researchers may request data from Amgen clinical studies. Complete details are available at the following: https://wwwext.amgen.com/science/clinical-trials/clinical-data-transparency-practices/clinical-trial-data-sharing-request/Journals
Acknowledgements
The authors would like to thank Harman Dhatt for her excellent research assistance during the development of the study protocol for this project. Medical writing support was funded by Amgen Inc. and provided by Julie Wang of Amgen Inc. and Lakshmi Narendra Bodduluru, of Cactus Life Sciences (part of Cactus Communications).
References
- Austin PC, Tu JV, Ho JE, et al. Using methods from the data-mining and machine-learning literature for disease classification and prediction: a case study examining classification of heart failure subtypes. J Clin Epidemiol. 2013;66(4):398–407.
- Huber CA, Szucs TD, Rapold R, et al. Identifying patients with chronic conditions using pharmacy data in Switzerland: an updated mapping approach to the classification of medications. BMC Public Health. 2013;13:1030.
- Curtis JR, Baddley JW, Yang S, et al. Derivation and preliminary validation of an administrative claims-based algorithm for the effectiveness of medications for rheumatoid arthritis. Arthritis Res Ther. 2011;13(5):R155.
- Lauffenburger JC, Balasubramanian A, Farley JF, et al. Completeness of prescription information in US commercial claims databases. Pharmacoepidemiol Drug Saf. 2013;22(8):899–906.
- Lindsell CJ, Stead WW, Johnson KB. Action-informed artificial intelligence-matching the algorithm to the problem. JAMA. 2020;323(21):2141–2142.
- Grassi W, De Angelis R, Lamanna G, et al. The clinical features of rheumatoid arthritis. Eur J Radiol. 1998;27(Suppl 1):S18–S24.
- Hunter TM, Boytsov NN, Zhang X, et al. Prevalence of rheumatoid arthritis in the United States adult population in healthcare claims databases, 2004-2014. Rheumatol Int. 2017;37(9):1551–1557.
- Smolen JS, Aletaha D, McInnes IB. Rheumatoid arthritis. Lancet. 2016;388(10055):2023–2038.
- Wasserman A. Rheumatoid arthritis: common questions about diagnosis and management. Am Fam Physician. 2018;97(7):455–462.
- Nusinovici S, Tham YC, Chak Yan MY, et al. Logistic regression was as good as machine learning for predicting major chronic diseases. J Clin Epidemiol. 2020;122:56–69.
- Feldman CH, Yoshida K, Xu C, et al. Supplementing claims data with electronic medical records to improve estimation and classification of rheumatoid arthritis disease activity: a machine learning approach. ACR Open Rheumatol. 2019;1(9):552–559.
- Lin C, Karlson EW, Canhao H, et al. Automatic prediction of rheumatoid arthritis disease activity from the electronic medical records. PLoS One. 2013;8(8):e69932.
- Norgeot B, Glicksberg BS, Trupin L, et al. Assessment of a deep learning model based on electronic health record data to forecast clinical outcomes in patients with rheumatoid arthritis. JAMA Netw Open. 2019;2(3):e190606.
- Zhou SM, Fernandez-Gutierrez F, Kennedy J, et al. Defining disease phenotypes in primary care electronic health records by a machine learning approach: a case study in identifying rheumatoid arthritis. PLoS One. 2016;11(5):e0154515.
- Guan Y, Zhang H, Quang D, et al. Machine learning to predict anti-tumor necrosis factor drug responses of rheumatoid arthritis patients by integrating clinical and genetic markers. Arthritis Rheumatol. 2019;71(12):1987–1996.
- Tao W, Concepcion AN, Vianen M, et al. Multiomics and machine learning accurately predict clinical response to adalimumab and etanercept therapy in patients with rheumatoid arthritis. Arthritis Rheumatol. 2021;73(2):212–222.
- Gossec L, Guyard F, Leroy D, et al. Detection of flares by decrease in physical activity, collected using wearable activity trackers in rheumatoid arthritis or axial spondyloarthritis: an application of machine learning analyses in rheumatology. Arthritis Care Res. 2019;71(10):1336–1343.
- Hirano T, Nishide M, Nonaka N, et al. Development and validation of a deep-learning model for scoring of radiographic finger joint destruction in rheumatoid arthritis. Rheumatol Adv Pract. 2019;3(2):rkz047.
- Lezcano-Valverde JM, Salazar F, León L, et al. Development and validation of a multivariate predictive model for rheumatoid arthritis mortality using a machine learning approach. Sci Rep. 2017;7(1):10189.
- IBM MarketScan Research Databases; [cited 2020 Dec 29]. Available from: https://www.ibm.com/in-en/products/marketscan-research-databases.
- Blauvelt A, Shi N, Zhu B, et al. Comparison of health care costs among patients with psoriasis initiating ixekizumab, secukinumab, or adalimumab. J Manag Care Spec Pharm. 2019;25(12):1366–1376.
- Jiao Y, Du P. Performance measures in evaluating machine learning based bioinformatics predictors for classifications. Quant Biol. 2016;4(4):320–330.
- Krstajic D, Buturovic LJ, Leahy DE, et al. Cross-validation pitfalls when selecting and assessing regression and classification models. J Cheminform. 2014;6(1):10.
- Feng JZ, Wang Y, Peng J, et al. Comparison between logistic regression and machine learning algorithms on survival prediction of traumatic brain injuries. J Crit Care. 2019;54:110–116.
- Kuhle S, Maguire B, Zhang H, et al. Comparison of logistic regression with machine learning methods for the prediction of fetal growth abnormalities: a retrospective cohort study. BMC Pregnancy Childbirth. 2018;18(1):333.
- Stylianou N, Akbarov A, Kontopantelis E, et al. Mortality risk prediction in burn injury: comparison of logistic regression with machine learning approaches. Burns. 2015;41(5):925–934.