
Abstract
Aims
A budget impact analysis (BIA) comparing transcatheter aortic valve replacement (TAVR) with SAPIEN 3 and surgical aortic valve replacement (SAVR) for severe, symptomatic aortic stenosis among patients of low, intermediate, and high surgical risk from the perspective of the public and private sectors in Saudi Arabia.
Materials and methods
A Markov model was developed with six states to calculate the budget impact from time of either TAVR or SAVR intervention up to 5 years. We compared the budget effects of new permanent pacemaker implantation (PPI), new onset atrial fibrillation (AF), major/disabling stroke (MDS), and surgical site infections (SSI). One-way sensitivity analyses (OWSA) were performed on cost and probability inputs.
Results
Analysis of the base case parameters suggests TAVR vs. SAVR is budget saving among intermediate- and high-risk patients at 5 years. TAVR vs. SAVR for low surgical risk reaches budget neutrality at 5 years. TAVR is associated with higher costs for PPI and budget savings for MDS, AF, and SSI. TAVR also results in savings for non-device costs due to fewer human resource uses and shorter procedure durations. Similarly, TAVR is associated with cost savings due to shorter hospital intensive care unit (ICU) and non-ICU stays. The OWSA consistently revealed that SAVR non-device theater costs were the leading cost driver across all surgical risk levels.
Limitations
This is the first budget impact analysis of its kind in Saudi Arabia and future research is needed on costing TAVR and SAVR procedures, the economic impact of SSI, and corroborating estimates for the public and private sectors.
Conclusions
Payers, providers, and policymakers increasingly turn to results of BIA to inform technologies affordability decisions. TAVR with SAPIEN 3 appears to generate savings vs. SAVR from a budget impact perspective across various surgical risk levels in Saudi Arabia.
Introduction
Aortic stenosis (AS) is an end stage disease characterized by a narrowing of the aortic valve commonly due to calcification but also associated with infection, rheumatic fever, or a congenital heart defectCitation1. As a result, a patient’s blood flow from the left ventricle to the aorta is reduced, leading to an increased likelihood of mortality and reductions in quality-of-life, whilst increasing healthcare costs for the patient and healthcare systemCitation2–6.
The prevalence of AS in patients >60 years is 2–7% in advanced economies and increases with age up to 13.3% among patients >75 yearsCitation7–9. In the Kingdom of Saudi Arabia (KSA), increasing life expectancy is anticipated to increase the number of AS casesCitation10, and the total cost to the healthcare system. Although some patients are medically managed due to multiple comorbidities and higher surgical riskCitation5, most undergo either surgical aortic valve replacement (SAVR) or transcatheter aortic valve replacement (TAVR). Patients that undergo SAVR experience longer recovery times and longer hospital lengths of stay (LOS) compared with TAVR procedures that are less invasive and associated with improved patient outcomesCitation11–15.
Since April 2018, patients with severe AS of all surgical risk levels in KSA have access to the balloon-expandable SAPIEN 3Footnotei System (hereafter S3) for TAVR procedures. S3 is the third generation of the SAPIEN valve and builds on numerous trials and evidence across various surgical risk groupsCitation16–28. Overall, TAVR procedures with S3 vs. SAVR are associated with improved survival, reduced complications, shorter hospital LOS, and reduced post-procedure wound infections. However, the acquisition cost of S3 is higher compared to valves used in SAVR leading to the core question on the budget impact assessing potential peri- and post-procedure cost offsets due to reduced healthcare consumptions in KSA.
Payers, providers, and policy-makers increasingly turn to results of budget impact analyses (BIA) to inform decisions on the adoption of new healthcare technologiesCitation29–31. In KSA, BIA is not yet required for reimbursement of medical devices. This will change when BIA becomes an essential part of dossiers submissions requirements with the formalized introduction of a health technology assessment (HTA) system in KSACitation32,Citation33. There are no published results of a budget impact analyses among severe AS patients in KSA or the Middle East. Payers, providers, and policymakers lack decision-analytic tools to determine budget offsets associated with innovative technologies such as S3 and the impact on healthcare resource consumption. To this end, determining the budget impact of S3 is a challenge in KSA due to the lack of epidemiological data, costing of SAVR and TAVR procedures in both the public and private sectors, and patient registries with clinical outcomes for TAVR and SAVR.
This study therefore employs the best available evidence and validated assumptions to analyze the budget impact associated with S3 among severe AS patients in low, intermediate, and high surgical risk patients from the perspective of the public and private sectors in KSA.
Methods
The BIA estimates the financial consequences of adopting S3 for TAVR vs. SAVR procedures over a 5-year time horizon from the perspective of both public and private sector payers in KSA. Guidelines by the International Society for Pharmacoeconomics and Outcomes Research (ISPOR) for BIA were used to guide the development of the model and presentation of the resultsCitation29.
Model structure
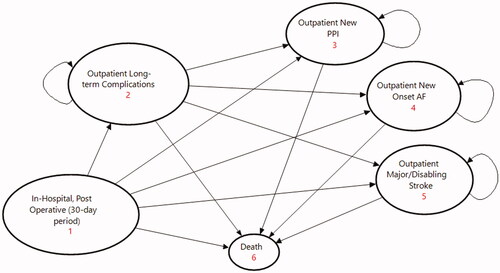
A Markov model compares TAVR with S3 to SAVR among severe symptomatic aortic stenosis patients across low-, intermediate-, and high-risk surgical levels. The model calculates the expected cost that a patient accumulates as they progress through mutually exclusive states defined by a patient’s journey from the time of either a TAVR or SAVR intervention. These states include an in-hospital, post-operative 30-day period covering all outcome-related costs, a state in the outpatient setting for patients at risk of long-term complications, three maintenance states for outpatients with either a new permanent pacemaker implantation (PPI), new onset atrial fibrillation (AF), or major/disabling stroke (MDS), and a final absorptive state for aggregating mortality in the model (see ). Monthly cycles and transition probabilities determine how patients move between states over a duration of 5 years. The model includes a half-cycle correction to account for over counting in Markov processes.
Figure 1. State transition diagram.
Patient population and clinical outcomes
All patients start in the state “in-hospital, post-operative (30-day period)” and enter the model at different ages based on low, intermediate, or high-risk surgical levels ()Citation18,Citation22,Citation23,Citation26. In this initial state, patients at risk of death transitioned based on published mortality rates, and up to 1 year thereafter in any subsequent state, based on period-specific transition probabilitiesCitation11,Citation18,Citation22,Citation23,Citation26. TAVR-related mortality is consistently lower across all surgical risk levels compared with SAVR. Thereafter, and for the remaining duration of the model, patient mortality reverted to the general population life tables for the KSACitation34.
Table 1. Model parameters – patient population and clinical outcomes (base case parameters).
Patients that undergo TAVR or SAVR procedures are at risk of complications. The co-authors prioritized a list of complications based on clinical relevancy and higher healthcare resource consumption; and included PPI, MDS, AF, and surgical site infections (SSI). Under clinical relevance we considered complications with statistically meaningful differences in event rates and high absolute event rates relative to other complications. Paravalvular leak, acute kidney injury, endocarditis, major vascular complications, life-threatening bleeding, and history of AF prior to either TAVR or SAVR were all excluded due to low, insignificant event rates when compared to the major complications, or low healthcare resource impact. Treatment goals for TAVR include minimizing complications and reducing downstream, recurring expenses. Event rates for patients at risk of in-hospital or outpatient complications were derived from published clinical evidence ().
TAVR procedures are associated with lower event rates for AFCitation11,Citation16,Citation19,Citation22,Citation26 across all surgical risk levels during the in-hospital, post-operative 30-day period, and the state for patients at risk of long-term complications in the outpatient setting. Similarly, TAVR is associated with lower event rates for MDS across all surgical risk levels except among high-risk patients at 1 year where the event rate for SAVR is lower compared to TAVRCitation11,Citation17,Citation18,Citation22,Citation26. Although numerically lower, this is most likely not statistically significant due to data sourced from different clinical studies with different patient samples. PPI event rates are higher across all risk levels for TAVR with SAPIEN 3 vs. SAVR (30-day period and 1 year) – except in low-risk patients with numerical but not statistically significant differences reported between TAVR with SAPIEN 3 and SAVR. We assumed that published 1 year event rates for any complication are relevant for the duration of the model.
SSI among patients undergoing TAVR or SAVR is an important determinant of mortality, hospital length of stay, and hospitalization costs (intensive care unit (ICU) and non-ICU)Citation35–45. Wound disorders are significantly lower in TAVR vs. SAVR (1% vs. 8%, p = 0.035)Citation42, and deep surgical wound infection and mediastinitis after median sternotomy are associated with mortality as high as 50%Citation35. Overall, patients undergoing TAVR develop fewer infectious complications and consume fewer healthcare resources. In the absence of published evidence, we assumed that incidence rates for SSI were uniformly applicable across all surgical risk levels ().
Table 2. Model parameters – costs (in SAR) and hospital length-of-stay (base case parameters).
Costs and resource consumption
The model considers only direct costs in 2021 Saudi Riyal (SAR) from the perspective of both the public and private sectors. Costs for the in-hospital, post-operative 30-day period were disaggregated into Procedure/Theater covering Device and Non-Device Costs; Post-Procedure for the total ICU and non-ICU stays, and In-Hospital Complications for PPI, AF, MDS, and SSI. Cost for long-term complications in the outpatient setting were disaggregated per complication. In the first two states ( – #1 and #2), costs were calculated per procedure or per event. In-hospital complications (under the first state, – #1) considered only the additional cost, while in the outpatient setting, long-term complication costs included hospitalization. The remaining maintenance states aggregated monthly costs to manage patients with PPI, AF, or MDS.
Procedure/theater and post-procedure costs
Device costs included the private sector acquisition of S3 for TAVR and assumed SAVR procedures used Inspiris Resilia (Edwards Lifesciences) (). Private sector acquisition costs result in conservative results as prices are lower when acquired through the centralized procurement agency National Unified Procurement Company (NUPCO) for the public sector. An additional 10.2% cost was added to the device cost, based on expert opinion, to cover consumables, such as catheter balloon, introducer sheath, device vascular closure, etc.
The model included non-device costs to estimate human resources for TAVR and SAVR during the initial state such as surgeon/cardiologist, anesthesiologist, and theater assists. Total costs were based on the mean of published procedure durationsCitation46–48, number of human resources per procedure, and a resource cost per minuteCitation49. Shorter TAVR procedure durations are associated with lower total non-device costs compared to SAVR (). We made no assumptions on capital costs that could be included under non-device costs but would vary, considerably, between the private and public sectors. We assumed that non-device costs remained fixed for each surgical risk level.
The model considers that SSI are initially identified in-hospital and a cost per event accrues to each patient. The average hospital cost of postoperative sternal infection was double that of noninfected patientsCitation38. In a different study, costs were 2.8-times higher for patients with sternal would complications compared with uncomplicated postoperative casesCitation39. We assumed SSI in SAVR doubled the post-procedure total costs per admission (only ICU and non-ICU stay) and, in the absence of available evidence, we assumed a 10% increase for TAVR. The final estimate for additional SSI costs were different per surgical risk level given differences in hospital LOS.
Hospital length of stay
Hospital LOS is an important multiplier for total hospitalization costs and accounts for significant differences between TAVR and SAVRCitation22,Citation26,Citation50. When a data source did not report ICU and non-ICU stay separately, the total LOS was split between 40% for ICU and the remaining 60% for non-ICU stay based on published dataCitation51. TAVR is associated with substantial reductions in LOS consistent across all surgical risk levels ().
Complication costs
The model accounts for state costs covering in-hospital and long-term complication-related costs. Given the lack of structured costing data on TAVR vs. SAVR in KSA, three independent approaches to data collection included intermarket cost-ratios, published evidence, and institutional inputs from co-authors. An intermarket cost-ratio analysis assumes that costs in KSA are proportional to other countriesCitation52. In this first approach, costs reported in published studiesCitation49,Citation53–58 were extracted and expressed as a ratio of in-country device costs. Unlike prior studies that indexed the KSA vs. the United Kingdom (UK) physician visit costsCitation52, this study estimated event costs in KSA as a proportion of device costs in KSA.
An intermarket cost-ratio analysis may bias estimates due to differences in healthcare delivery systems (public vs. private) and level of economic development. This approach was strengthened with searches on PubMed and Google Scholar for cost inputs related to PPI, MDS, AF, and SSI in KSA. Inputs from all available studiesCitation52,Citation59–62 were extracted, adjusted to the present value, and compared with calculated estimates. These were complemented with institutional costs provided by co-authors and included expert opinion on reimbursement tariffs using Disease-Related Groups (DRG) for the private and public sectors. AR-DRG codes F03A/B, F04A/B/C, and F19A/B/Z used in KSA describe open vs. percutaneous approaches in cardiac valve replacement interventions. Although the AR-DRG is a well-developed medical coding framework, TAVR currently groups to the same DRG “as cardiac valve replacement interventions performed using an open approach”Citation63 (p.27). Addressing weaknesses in this approach is a work-in-progress.
Final cost estimates for all states were subjected to internal consistency and face validity checks among co-authors. Published evidence was preferred as a source, followed by expert opinion, and then Intermarket Cost-Ratio Analysis. No discounting was applied to cost estimates as recommended by ISPOR Guideline for BIACitation29. All costs and prices are based on the Saudi Arabian Riyal (SAR), equal to 3.75 SAR per United States Dollar (USD).
Sensitivity analysis
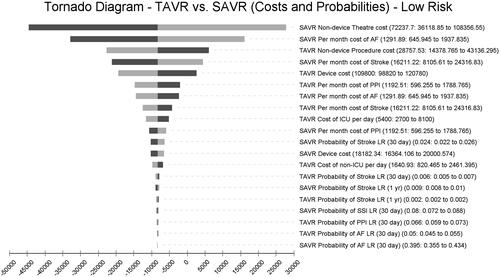
A challenge in KSA is uncertainty around cost estimates. One-way sensitivity analyses were performed on cost estimates with broad 50% bands covering values from the lower to the upper extremes. All one-way sensitivity analyses on cost inputs were arranged in a tornado diagram to facilitate analysis. Probabilities in the model were analyzed in a separate tornado diagram but with inputs varied by ±20% given that these were derived from published evidence.
Results
Overall results of the BIA by surgical risk level and disaggregated by period (30-day and annual) are presented in .
Table 3. Budget impact results (in SAR) disaggregated by period and cost categories.
Analysis of the base case parameters suggests TAVR vs. SAVR in KSA is overall budget saving among high- and intermediate-risk patients at 5 years. However, TAVR vs. SAVR is not budget-saving for low surgical risk but approaches budget neutrality after the fifth year. Results are determined by initial in-hospital, post-procedure (30-day period) costs offset by downstream costs. While procedure costs are higher among low- and intermediate-risk groups, these are offset by cost reductions in all cost categories except New PPI. Cost savings in high-risk patients are eroded as the model progresses due to significantly lower TAVR mortality. During the initial phase, procedure costs are the main contributor, costing more in TAVR vs. SAVR among low- and intermediate-risk patients, but costing less in high-risk patients. TAVR vs. SAVR is associated with higher expected costs for PPI and budget savings for MDS, AF, and SSI ().
Device costs impact total procedure/theater costs the most and remain fixed across all surgical risk levels (). However, TAVR results in savings for non-device costs due to lower human resource use and shorter procedure durations. Similarly, TAVR is associated with substantial cost savings due to shorter hospital ICU and Non-ICU stays, with the greatest savings among high-risk patients.
Sensitivity analysis
Results of the one-way sensitivity analyses () of costs and probabilities among low-risk patients suggests that SAVR non-device theater costs, monthly maintenance cost to manage SAVR patients with AF, and TAVR non-device procedure costs are the three most impactful variables in the model.
Figure 2. Tornado diagram – TAVR vs. SAVR (costs and probabilities), low-risk.
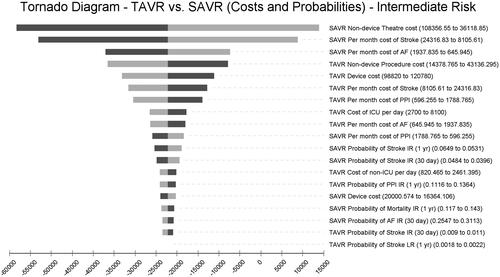
Among intermediate-risk patients, SAVR non-device theater costs, SAVR monthly maintenance cost of stroke, and SAVR monthly maintenance cost of AF are the most impactful variables ().
Figure 3. Tornado diagram – TAVR. vs. SAVR (costs and probabilities), intermediate-risk.
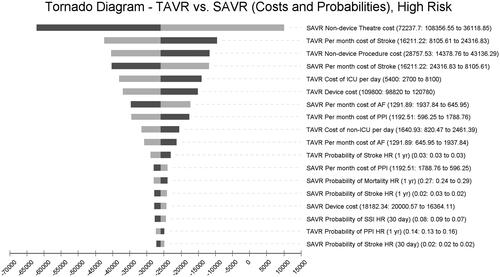
Finally, among high-risk patients, SAVR non-device theater costs, TAVR monthly maintenance costs for stroke, and TAVR non-device procedure costs are the top three cost drivers ().
Figure 4. Tornado diagram – TAVR. vs. SAVR (costs and probabilities), high-risk.
Discussion
To the authors’ knowledge, this is the first BIA in KSA to calculate the financial consequences of using TAVR vs. SAVR in low-, intermediate-, and high-surgical risk patients. The results are specific to SAPIEN 3 and were modeled on clinical evidence and costing inputs specific to this technology. Results are therefore not generalizable to other technologies that may be used in TAVR procedures. The analysis demonstrates that TAVR is cost saving due to reductions in MDS, AF, SSI, and LOS-related costs. TAVR vs. SAVR in intermediate-risk and high-risk patients is budget saving after 5 years. TAVR in low-risk patients may become budget saving within 5 years if non-device procedure costs are reduced to same-day proceduresCitation64,Citation65.
The one-way sensitivity analyses consistently revealed that SAVR non-device theater costs were the single, leading cost driver in the model across all surgical risk levels. These costs relate to human resource use and procedure durations. The cost of complications varied in impact across risk levels, with monthly maintenance costs of stroke patients as a leading contributor in this category.
In the literature, there are no other budget-impact results in KSA or the Middle East to compare these results. However, comparing costs only reported in prior studiesCitation49,Citation53–58 suggests results in this analysis are comparable. SAVR LOS and the cost per day of hospitalization were also leading cost drivers in a tornado diagram for intermediate risk patients in AustraliaCitation54. The Health Information and Quality Authority (HIQA) in Ireland reported TAVR vs. SAVR was budget neutral in a mix of 67% low-risk and 33% intermediate-risk patientsCitation56. Their analysis included an up-front capital cost for additional catheterization laboratory capacity which was offset by reduced procedure costs in subsequent years. The Norwegian Institute of Public Health (NIPH) reported a cost-neutral impact of TAVR vs. SAVR in low- and intermediate-risk patientsCitation57. The French HTA agency, Haute Autorité de Santé (HAS), reported budget savings of €67 million among low-risk patients (TAVR with SAPIEN 3 vs. SAVR) and positive recommendation for the reimbursement of the technologyCitation66. A key difference compared to other studies is higher non-device procedure/theater costs in Canada vs. KSA (CAD34395 vs. USD8511, respectively). Differences in costing hospitalizations and whether capital costs are included may determine overall budget impact results across countries.
Unlike prior studies comparing TAVR vs. SAVR, this analysis included the budget-impact of SSI. Sternotomy wound infections (deep or superficial) in SAVR are costly events with high mortality rates. Although the costs and probabilities related to SSI were not among the most impactful variables in the model, they nonetheless contributed higher cost savings for TAVR than the other complications: PPI, MDS, and AF. The cost of managing SSI may be an important goal in aortic valve replacement procedures, both in KSA and other countries.
Limitations
Assumptions were used to facilitate this analysis, so results should be considered carefully before adoption by payers, providers, and policymakers in KSA. First, collecting costs in KSA is challenging given the absence of structured costing data for TAVR vs. SAVR. The costing approach in this analysis included an intermarket cost-ratio analysis, published evidence, and expert opinion. Despite efforts to strengthen the costing methodology, there may still be bias included in the costing estimates. In the future, a health system-wide adoption of DRGs or a micro-costing analysis may help refine results. Similarly, additional analysis may be required to determine the contribution of capital costs under non-device procedure/theater costs on the overall budget impact of TAVR vs. SAVR.
We assumed that non-device costs remained fixed for each surgical risk level. In reality, and if published evidence were available, non-device costs may be lower among low-risk patients due to shorter procedure durations, and higher in high-risk patients. The result of this assumption is conservative budget impact results, meaning that TAVR may become budget saving in low-risk patients within 5 years. We also assumed that SSI in SAVR doubled the post-procedure total costs per admission. This was based on dated studies (2000 and 2001) and since then wound infection practices and technologies may have improved. To this end, the accuracy of this analysis may improve with future research on SSI in TAVR and SAVR patients in KSA and other countries.
The results reported herein are from the perspective of both the public and private sectors in KSA. Each sector is different and repeating this analysis per sector may yield different results. Moreover, given the absence of epidemiological data in KSA for AS, a separate analysis that quantifies the prevalence and incidence across surgical risk groups, age, geographical region, public and private sector, and changes over time, may add to our future understanding of TAVR vs. SAVR budget impact. However, the sensitivity analysis included broad 50% bands (low and high values) and may already include cost estimates relevant in separate analyses. The results reported herein point to cost drivers that may lead to critical differences between the public and private sectors. Future research may corroborate the relevance of these estimates for either sector.
Conclusion
The results of this analysis suggest that the higher, initial cost of S3 is offset by cost savings in MDS, AF, SSI, and LOS. The leading cost driver is SAVR non-device theater costs due to longer procedure durations and human resource use. TAVR is budget saving among intermediate- and high-risk patients and approaches budget neutrality among low-risk patients. Payers, providers, and policymakers increasingly turn to results of BIA to inform technologies affordability decisions. TAVR with SAPIEN 3 appears to generate savings vs. SAVR from a budget impact perspective across various surgical risk levels in Saudi Arabia.
Transparency
Declaration of funding
This work was supported by a grant from Edwards Lifesciences.
Declaration of financial/other interests
JLC is a consultant for Edwards Lifesciences. HAA, FA, and SAS are supported by their employing institutions. PC is an employee at Edwards Lifesciences.
Peer reviewers on this manuscript have no relevant financial or other relationships to disclose.
Acknowledgements
The authors would like to acknowledge the initial conceptualization of the project by Sarrah Barakat, former employee at Edwards Lifesciences.
Notes
i SAPIEN 3 is a registered trademark of Edwards Lifesciences Corporation, Irvine, CA, USA.
References
- Otto CM, Prendergast B. Aortic-Valve stenosis — from patients at risk to severe valve obstruction. Massachusetts Med Soc. 2014;371:744–756. https://doi.org/10.1056/NEJMra1313875.
- Go AS, Mozaffarian D, Roger VL. et al. Heart disease and stroke statistics-2013 update: a report from the American Heart Association. Circulation. 2013;127(1):e6–e245.,
- Lloyd-Jones D, Adams RJ, Brown TM. et al. Executive summary: heart disease and stroke statistics-2010 update: a report from the American Heart Association. Circulation. 2010;121(7):948–954.,
- Varadarajan P, Kapoor N, Bansal RC, et al. Clinical profile and natural history of 453 nonsurgically managed patients with severe aortic stenosis. Ann Thorac Surg. 2006;82(6):2111–2115.
- Nishimura RA, Otto CM, Bonow RO, et al. 2014 AHA/ACC guideline for the management of patients with valvular heart disease: executive summary: a report of the American college of cardiology/American heart association task force on practice guidelines. Circulation. 2014;129(23):2440–2492.,
- Coylewright M, Palmer R, O’Neill ES, et al. Patient-defined goals for the treatment of severe aortic stenosis: a qualitative analysis. Health Expect. 2016;19(5):1036–1043.
- Nkomo VT, Gardin JM, Skelton TN, et al. Burden of valvular heart diseases: a population-based study. The Lancet. 2006;368(9540):1005–1011.
- De Sciscio P, Brubert J, De Sciscio M, et al. Quantifying the shift toward transcatheter aortic valve replacement in low-risk patients: a meta-analysis. Circ Cardiovasc Qual Outcomes. 2017;10(6):e003287.
- Iung B, Baron G, Butchart EG, et al. A prospective survey of patients with valvular heart disease in Europe: the euro heart survey on valvular heart disease. Eur Heart J. 2003;24(13):1231–1243.
- Alatawi FO, Abuelatta RA, AlAhmedi AB, et al. Clinical outcomes with transcatheter aortic valve implantation at a single cardiac center in Saudi Arabia. Ann Saudi Med. 2018;38(3):167–173.
- Smith CR, Leon MB, Mack MJ, et al. Transcatheter versus surgical aortic-valve replacement in high-risk patients. N Engl J Med. 2011;364(23):2187–2198.
- Kodali SK, Williams MR, Smith CR, et al. Two-year outcomes after transcatheter or surgical aortic-valve replacement. N Engl J Med. 2012;366(18):1686–1695.
- Mack MJ, Leon MB, Smith CR, et al. 5-year outcomes of transcatheter aortic valve replacement or surgical aortic valve replacement for high surgical risk patients with aortic stenosis (PARTNER 1): a randomised controlled trial. Lancet. 2015;385(9986):2477–2484.
- Reynolds MR, Magnuson EA, Wang K, et al. Health-Related quality of life after transcatheter or surgical aortic valve replacement in High-Risk patients with severe aortic stenosis: results from the PARTNER (placement of AoRTic TraNscathetER valve) trial (cohort a). J Am Coll Cardiol. 2012;60(6):548–558.
- Arnold SV, Reynolds MR, Wang K, et al. Health status after transcatheter or surgical aortic valve replacement in patients with severe aortic stenosis at increased surgical risk: results from the CoreValve US pivotal trial. JACC Cardiovasc Interv. 2015;8(9):1207–1217.,
- EuroPCR. 2015. The SAPIEN 3 Trials – One Year Outcomes | Radcliffe Cardiology [Internet]; [cited 2021 Sep 15]. Available from: https://www.radcliffecardiology.com/video-index/europcr-2015-sapien-3-trials-one-year-outcomes.
- Herrmann HC, Thourani VH, Kodali SK, et al. One-Year clinical outcomes with SAPIEN 3 transcatheter aortic valve replacement in High-Risk and inoperable patients with severe aortic stenosis. Circulation. 2016;134(2):130–140.
- Kodali S, Thourani VH, White J, et al. Early clinical and echocardiographic outcomes after SAPIEN 3 transcatheter aortic valve replacement in inoperable, high-risk and intermediate-risk patients with aortic stenosis. Eur Heart J. 2016;37(28):2252–2262.
- Webb J, Gerosa G, Lefèvre T, et al. Multicenter evaluation of a next-generation balloon-expandable transcatheter aortic valve. J Am Coll Cardiol. 2014;64(21):2235–2243.
- Romano M, Frank D, Cocchieri R, et al. Transaortic transcatheter aortic valve implantation using SAPIEN XT or SAPIEN 3 valves in the ROUTE registry†. Interact Cardiovasc Thorac Surg. 2017;25(5):757–764.
- Cocchieri R, Petzina R, Romano M, et al. Outcomes after transaortic transcatheter aortic valve implantation: long-term findings from the European ROUTE†. Eur J Cardiothorac Surg. 2019;55(4):737–743.
- Thourani VH, Kodali S, Makkar RR, et al. Transcatheter aortic valve replacement versus surgical valve replacement in intermediate-risk patients: a propensity score analysis. Lancet. 2016;387(10034):2218–2225.
- Kodali S. SAPIEN 3 transcatheter aortic valve replacement compared with surgery in intermediate-risk patients: a propensity-matched analysis of 5-year outcomes [Internet]. TCTMD.com. 2020; [cited 2021 Sep 15]. Available from: https://www.tctmd.com/slide/sapien-3-transcatheter-aortic-valve-replacement-compared-surgery-intermediate-risk-patients-0.
- Tuzcu EM. Real world outcomes of TAVR with the SAPIEN 3 valve in intermediate risk patients: comparison of data form the TVT registry with PARTNER S3 studies. Paris, France; 2018.
- Edwards Lifesciences. A prospective, randomized, controlled, multi-center study to establish the safety and effectiveness of the SAPIEN 3 Transcatheter heart valve in low risk patients who have severe, Calcific, Aortic Stenosis Requiring Aortic Valve Replacement [Internet]. clinicaltrials.gov. 2021; [cited 2021 Sep 13]. Report No.: NCT02675114. Available from: https://clinicaltrials.gov/ct2/show/NCT02675114.
- Mack MJ, Leon MB, Thourani VH, et al. Transcatheter Aortic-Valve replacement with a Balloon-Expandable valve in low-risk patients. N Engl J Med. 2019;380(18):1695–1705.
- Waksman R, Rogers T, Torguson R, et al. Transcatheter aortic valve replacement in low-risk patients with symptomatic severe aortic stenosis. J Am Coll Cardiol. 2018;72(18):2095–2105.
- Leon MB, Mack MJ, Hahn RT, et al. Outcomes 2 years after transcatheter aortic valve replacement in patients at low surgical risk. J Am Coll Cardiol. 2021;77(9):1149–1161.,
- Mauskopf JA, Sullivan SD, Annemans L, et al. Principles of good practice for budget impact analysis: report of the ISPOR task force on good research practices-budget impact analysis. Value Health. 2007;10(5):336–347.
- Orlewska E, Gulácsi L. Budget-impact analyses: a critical review of published studies. Pharmacoeconomics. 2009;27(10):807–827.
- van de Vooren K, Duranti S, Curto A, et al. A critical systematic review of budget impact analyses on drugs in the EU countries. Appl Health Econ Health Policy. 2014;12(1):33–40.
- Al-Omar HA, Aljuffali IA, Solà-Morales O. Value drivers for pharmaceutical products in health technology assessment (HTA) in Saudi Arabia: results from a capacity building, multi-stakeholder workshop. Saudi Pharm J. 2021;29(9):946–954.
- Al-Omar HA, Attuwaijri AA, Aljuffali IA. Pharmaceutical companies’ views on a health technology assessment (HTA) entity in Saudi Arabia. Saudi Pharm J. 2020;28(6):662–668.
- World Health Organization. Global Health Observatory, Life tables [Internet]. WHO. World Health Organization; [cited 2021 Sep 21]. Available from: https://apps.who.int/gho/data/view.main.61440?lang=en.
- Chello C, Lusini M, Nenna A, et al. Deep sternal wound infection (DSWI) and mediastinitis after cardiac surgery: current approaches and future trends in prevention and management. Surg Technol Int. 2020;36:212–216.
- Hawkins RB, Mehaffey JH, Charles EJ, et al. Cost-effectiveness of negative pressure incision management system in cardiac surgery. J Surg Res. 2019;240:227–235.
- Schiraldi L, Jabbour G, Centofanti P, et al. Deep sternal wound infections: evidence for prevention, treatment, and reconstructive surgery. Arch Plast Surg. 2019;46(4):291–302.
- Tegnell A, Arén C, Ohman L. Coagulase-negative staphylococci and sternal infections after cardiac operation. Ann Thorac Surg. 2000;69(4):1104–1109.
- Ridderstolpe L, Gill H, Granfeldt H, et al. Superficial and deep sternal wound complications: incidence, risk factors and mortality. Eur J Cardiothorac Surg. 2001;20(6):1168–1175.
- Sjögren J, Malmsjö M, Gustafsson R, et al. Poststernotomy mediastinitis: a review of conventional surgical treatments, vacuum-assisted closure therapy and presentation of the lund University Hospital mediastinitis algorithm. Eur J Cardiothorac Surg. 2006;30(6):898–905.
- Heilmann C, Stahl R, Schneider C, et al. Wound complications after median sternotomy: a single-centre study. Interact Cardiovasc Thorac Surg. 2013;16(5):643–648.
- Shehada S-E, Wendt D, Peters D, et al. Infections after transcatheter versus surgical aortic valve replacement: mid-term results of 200 consecutive patients. J Thorac Dis. 2018;10(7):4342–4352.
- Tirado-Conte G, Freitas-Ferraz AB, Nombela-Franco L, et al. Incidence, causes, and impact of in-Hospital infections after transcatheter aortic valve implantation. Am J Cardiol. 2016;118(3):403–409.
- Falcone M, Russo A, Mancone M, et al. Early, intermediate and late infectious complications after transcatheter or surgical aortic-valve replacement: a prospective cohort study. Clin Microbiol Infect. 2014;20(8):758–763.
- Nakamura M, Chakravarty T, Jilaihawi H, et al. Complete percutaneous approach for arterial access in transfemoral transcatheter aortic valve replacement: a comparison with surgical cut-down and closure. Catheter Cardiovasc Interv. 2014;84(2):293–300.
- Wu Y-C, Zhang J-F, Shen W-F, et al. Transcatheter aortic valve implantation versus surgical aortic valve replacement for severe aortic stenosis: a meta analysis. Chin Med J. 2013;126(6):1171–1177.
- Shehada S-E, Elhmidi Y, Öztürk Ö, et al. Transcatheter versus surgical aortic valve replacement after previous cardiac surgery: a systematic review and meta-analysis. Cardiol Res Pract. 2018;2018:1–11.
- Klein H, Boleckova J. Resource utilization and procedure-related costs associated with transfemoral transcatheter aortic valve replacement. J Med Econ. 2017;20(6):640–645.
- Tam DY, Azizi PM, Fremes SE, et al. The cost-effectiveness of transcatheter aortic valve replacement in low surgical risk patients with severe aortic stenosis. Eur Heart J Qual Care Clin Outcomes. 2020;2020:qcaa058.
- Doble B, Blackhouse G, Goeree R, et al. Cost-effectiveness of the Edwards SAPIEN transcatheter heart valve compared with standard management and surgical aortic valve replacement in patients with severe symptomatic aortic stenosis: a Canadian perspective. J Thorac Cardiovasc Surg. 2013;146(1):52–60.e3.
- Baron SJ, Wang K, House JA. et al. Cost-Effectiveness of transcatheter versus surgical aortic valve replacement in patients with severe aortic stenosis at intermediate risk. Circulation. 2019;139(7):877–888.
- Hersi AS, Osenenko KM, Kherraf SA, et al. Cost-effectiveness of apixaban for stroke prevention in non-valvular atrial fibrillation in Saudi Arabia. Ann Saudi Med. 2019;39(4):265–278.
- Tarride J-E, Luong T, Goodall G, et al. A Canadian cost-effectiveness analysis of SAPIEN 3 transcatheter aortic valve implantation compared with surgery, in intermediate and high-risk severe aortic stenosis patients. Clinicoecon Outcomes Res. 2019;11:477–486.
- Zhou J, Liew D, Duffy SJ, et al. Cost-effectiveness of transcatheter aortic valve implantation compared to surgical aortic valve replacement in the intermediate surgical risk population. Int J Cardiol. 2019;294:17–22.
- Shah KK, Elder D, Nguyen MTH, et al. Transcatheter aortic valve implantation (TAVI) versus surgical aortic valve replacement for aortic stenosis (SAVR): a cost-comparison study. Heart Lung Circ. 2021;2021:S1443-9506(21)00550-3.
- Health Information and Quality Authority. Health Technology Assessment of transcatheter aortic valve implantation (TAVI) in patients with severe symptomatic aortic stenosis at low and intermediate risk of surgical complications [Internet]. Health Information and Quality Authority; 2019; [cited 2021 Sep 23]. Available from: https://www.hiqa.ie/sites/default/files/2019-12/TAVI_HTA.pdf.
- Norwegian Institute of Public Health. Transcatheter aortic valve implantation (TAVI) versus surgical aortic valve replacement (SAVR) for patients with severe aortic stenosis and low surgical risk and across surgical risk groups [Internet]. Norwegian Institute of Public Health. 2021; [cited 2021 Sep 23]. Available from: https://www.fhi.no/en/publ/2021/TAVI-vs-SAVR-for-patients-with-severe-aortic-stenosis-and-low-surgical-risk-and-across-surgical-risk-groups/.
- Gilard M, Eltchaninoff H, Iung B, et al. Cost-effectiveness analysis of SAPIEN 3 transcatheter aortic valve implantation procedure compared with surgery in patients with severe aortic stenosis at low risk of surgical mortality in France. Value in Health. 2021;22(4):289–296. https://www.valueinhealthjournal.com/article/S1098-3015(21)01786-1/fulltext.
- Al-Senani F, Al-Johani M, Salawati M, et al. A national economic and clinical model for ischemic stroke care development in Saudi Arabia: a call for change. Int J Stroke. 2019;14(8):835–842.
- Alharthy A, Karakitsos D. King saud medical city intensive care unit: a critical and cost-focused appraisal. Saudi Crit Care J. 2019;3(1):19–23.
- Altowaijri A, Alshehri N, Balkhi B, et al. PCV50 economic burden of major cardiovascular diseases and ischemic stroke in Saudi Arabia: a cost of illness study. Value in Health. 2020;23:S495–S496.
- Johnston KM, Osenenko KM, Qatami L, et al. Health care resource utilization and costs in individuals with atrial fibrillation in United Arab Emirates and kingdom of Saudi Arabia: a retrospective cohort study. Int J Int Med. 2015;4:17–25.
- Independent Hospital Pricing Authority. Development of the admitted care classifications: Public Consultation [Internet]. Independent Hospital Pricing Authority; 2021; [cited 2021 Sep 23]. Available from: https://www.ihpa.gov.au/sites/default/files/development_of_the_admitted_care_classifications_pdf_0.pdf.
- Rai D, Tahir MW, Chowdhury M, et al. Transcatheter aortic valve replacement same-day discharge for selected patients: a case series. Eur Heart J Case Rep. 2021;5(2):ytaa556.
- Butala N. Economics of minimalist TAVR: the 3M TAVR economic study. Boston, USA; 2021.
- Haute Autorité de Santé. EDWARDS SAPIEN 3, bioprothèse valvulaire aortique implantée par voie transfémorale (système COMMANDER) [Internet]. Commission Nationale d’Evaluation des Dispositifs Medicaux et des Technologies de Sante; 2021; [cited 2021 May 2]. Available from: https://www.has-sante.fr/upload/docs/evamed/CNEDIMTS-6294_EDWARDS_SAPIEN3_16_03_2021_(6294)_avis.pdf.