
Abstract
Background
There is significant over-prescription of antibiotics for suspected community-acquired pneumonia (CAP) patients as bacterial and viral pathogens are difficult to differentiate. To address this issue, a host response diagnostic called MeMed BV (MMBV) was developed that accurately differentiates bacterial from viral infection at the point of need by integrating measurements of multiple biomarkers. A literature-based cost-impact model was developed that compared the cost impact and clinical benefits between using the standard of care diagnostics combined with MMBV relative to standard of care diagnostics alone.
Methods
The patient population was stratified according to the pneumonia severity index, and cost savings were considered from payer and provider perspectives. Four scenarios were considered. The main analysis considers the cost impact of differences in antibiotic stewardship and resulting adverse events. The first, second, and third scenarios combine the impacts on antibiotic stewardship with changes in hospital admission probability, length of hospital stay and diagnosis related group (DRG) reallocation, and hospital admission probability, length of stay, and DRG reallocation in combination, respectively.
Results
The main analysis results show overall per-patient savings of $37 for payers and $223 for providers. Scenarios 1, 2, and 3 produced savings of $137, $189, and $293 for payers, and $339, $713, and $809 for providers, respectively.
Limitations
Models are simulations of real-world clinical processes, and are not sensitive to variations in clinical practice driven by differences in physician practice styles, differences in facility-level practice patterns, and patient comorbidities expected to exacerbate the clinical impact of CAP. Hospital models are limited to costs and do not consider differences in revenue associated with each approach.
Conclusions
Introducing MMBV to the current SOC diagnostic process is likely to be cost-saving to both hospitals and payers when considering impacts on antibiotic distribution, hospital admission rate, hospital LOS, and DRG reallocation.
Introduction
Community-acquired pneumonia (CAP) is an acute infection of the pulmonary parenchyma in patients who were not hospitalized or residing in a long-term care facility for ≥14 days before the onset of symptoms. CAP is caused by both bacterial and viral pathogens and is one of the most common infectious syndromes worldwide, with between 12.5 million to 104.5 million reported cases annuallyCitation1. Unlike most infections of the upper respiratory tract that are self-limiting, CAP leads to over 3 million deaths worldwide each year. Treatment of CAP represents a financial burden on the healthcare system. A 2020 assessment of the economic burden of CAP utilizing the IQVIA Real-World Data Adjudicated Claims US Database found the mean per-patient CAP-attributable cost to be $13,788 after adjustmentCitation2. As the number of at-risk individuals continues to grow with the aging population, the future impact of CAP in both financial and clinical terms is projected to growCitation3.
One of the major clinical conundrums in the management of patients with CAP is identifying the etiology; the pathogen is not defined in as many as 62% of patientsCitation4. It is important to determine if CAP is caused by bacteria or a virus as this information impacts management decisions. However, the ability to differentiate between bacterial and viral infection presents a challenge for physicians as there is no effective “gold standard” diagnostic. Current diagnostic guidelines suggest a multi-pronged approach, including radiography, blood tests, and blood culturesCitation5. Biomarkers to aid with diagnosis [e.g. procalcitonin (PCT), C-reactive protein (CRP), and lactate level measures] are routinely employed, but due to their variable performance, clinical judgement of disease severity and symptom presentation drive the majority of treatment decisions for patients presenting with infectionCitation6,Citation7.
Typically, physicians err on the side of caution and prescribe antibiotics to most CAP-presenting patients. Physicians have described this overcompensation to be driven by diagnostic uncertainty, time pressure, and the eagerness of patients to return to their normal livesCitation8. As a result, over-prescription of antibiotics is a serious issue in CAP, with a 2020 observational study estimating that up to 34.8% of antibiotic days prescribed for potential CAP patients were unnecessaryCitation9. Overuse of antibiotic treatment contributes to the risk for adverse events and is a driver of antimicrobial-drug resistance (AMR)Citation10.
To address the need to improve appropriate antibiotic use for patients with suspected infection, and particularly for CAP patients, a host response diagnostic called MeMed BV (MMBV) was developed that is capable of accurately differentiating bacterial and viral infection at the point of need by integrating measurements of the TRAIL, IP-10, and CRP immune-protein biomarkers in bloodCitation11–13. The MMBV result is a score from 0 to 100 that is interpreted based on classification into one of five potential outcome bins. Bins for scores 0–10 and 10–35 indicate a viral diagnosis, bins for scores 65–90 and 90–100 indicate a bacterial diagnosis, and results in the 35–65 range are considered equivocal. As a host response diagnostic based on circulating immune-response proteins, MMBV has the capability to diagnose inaccessible infections and does not elicit false alarms due to innocuous microbiome inhabitants. In multiple clinical studies, MMBV demonstrated higher diagnostic performance than standard of care (SOC) diagnostics in patients with suspected CAP. Importantly, a newly developed measurement platform enables results within 15 min from serum, potentially fitting the test into the routine workflow to help physicians avoid prescribing antibiotics to patients with viral infectionCitation11,Citation13–16.
Because hospital reimbursement and antimicrobial stewardship programs are increasingly tied to quality, efficiency, and cost of care, we developed a cost-impact model (CIM) that compared the cost impact and clinical benefits between using SOC combined with MMBV (SOC + MMBV) relative to SOC alone. The patient population was stratified according to the pneumonia severity index (PSI) in recognition of the different treatment pathways likely to align with disease severity. Value drivers considered in this analysis include the costs of antibiotic use, hospital admissions, hospital length of stay, antibiotic-related adverse events, and Clostridioides difficile (CDI). The main expected benefit captured by this analysis will be avoiding antibiotic overuse and decreasing inappropriate underuse. Economic results are considered from the payer and provider perspective as cost savings per CAP-presenting ED patient, while clinical outcomes are presented per 1,000 patients as antibiotic patients avoided, antibiotic days saved, hospital admissions avoided, and hospital days saved.
Methods
Model structure
The conceptual model was designed to estimate net costs associated with the two diagnostic arms from both the payer and the provider perspective. We utilized probabilities from literature to populate the model; however, the model functions as a deterministic analysis as we wanted to model real-world scenarios. By using literature-based inputs, we were able to implement scenario analyses that depict specific real-world situations, which would not have been achievable in a probabilistic model. The study population was 1,000 theoretical adult patients experiencing observable symptoms consistent with CAP presenting to the hospital ED, diagnosed with either SOC or SOC + MMBV. In the first treatment arm, patients experienced the SOC diagnostic process for a potential CAP infection, including X-ray, complete blood count, and viral PCR testing. The second cohort utilized MMBV diagnostics in combination with SOC. In this arm, patients whose MMBV scores fell in the equivocal bin were then diagnosed using SOC. The conceptual basis for the model is illustrated by a decision tree (). In , patients diagnosed with SOC receive either a bacterial or viral diagnosis, are either admitted to the hospital or treated in the ED alone, and are finally categorized according to the accuracy of the diagnosis as a true positive (TP; correctly identified bacterial diagnosis), false positive (FP; viral etiology diagnosed as bacterial), true negative (TN; correctly identified viral diagnosis), or false negative (FN; bacterial etiology diagnosed as viral). Patients can also experience antibiotic-related adverse events or CDI within the model, with probabilities varying based on patient diagnosis, diagnostic accuracy, length of treatment, the hospital admission decision, and length of stay in the hospital.
Figure 1. Decision tree structure. Abbreviations. CDI, Clostridioides difficile; ED, emergency department; SOC, standard of care; SOC + MMBV, standard of care + MeMed BV. *Patients entering the model are stratified based on Pneumonia Severity Index level. **At each end node of the decision tree, patients have the probability of experiencing antibiotic-related adverse events or CDI as shown in the smaller trees.
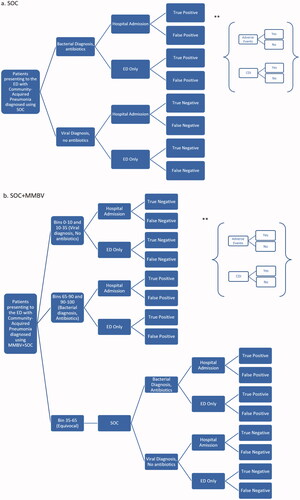
With SOC + MMBV, the bacterial and viral diagnosis pathways function in a manner similar to the SOC pathways but were based on MMBV scores. For scores 65–90 and 90–100, patients were assumed to have a bacterial infection and received antibiotics. Scores 0–10 and 10–35 result in viral diagnoses and patients did not receive antibiotics. Patients receiving equivocal test results (scores 35–65) were assumed to follow the SOC-guided treatment path.
The patient cohort was disaggregated into 4 different sets according to disease severity (PSIs 1 or 2, PSI 3, PSI 4, and PSI 5). The probability of hospitalization, length of hospital stays, and probability of antibiotic treatment varied between PSI severities. We also considered a cohort encompassing all severities that were weighted by the expected distribution of patients within each PSI category; results based on this cohort are considered the model’s “overall” results. All 4 cohorts were assumed to contain 1,000 patients in each diagnostic pathway.
Analyses
The primary goal of this analysis was to determine the antibiotic stewardship-driven impact of utilizing SOC + MMBV to differentiate between bacterial and viral infection in CAP patients for each PSI group. Therefore, our main analysis assesses both the clinical and economic impact of MMBV on antibiotic use, reported as antibiotic days saved and incremental cost between SOC and SOC + MMBV. One-way sensitivity analysis was conducted by varying each input by 20% in either direction. We then conducted three additive scenario analyses that incorporate the impact on antibiotic use with the expected benefit from the influence of (1) hospital admission rate, (2) hospital length of stay (LOS) for providers and diagnosis related group (DRG) reallocation for payers, and (3) hospital admission rate and LOS/DRG reallocation. One-way sensitivity analyses were again conducted for each scenario analysis.
Clinical inputs
Baseline clinical inputs and their sources for the model are reported by the diagnostic arm in . Any fields that do not show stratification by PSI score were assumed to have the same input value across all risk classes. Calculations and source justifications are described in the text below.
Table 1. Baseline clinical inputs.
Patient bacterial and viral etiology was obtained from a population-based surveillance study for hospitalized CAP patientsCitation24. By assuming that reported coinfections would be treated as bacterial diagnoses, the patient etiology was calculated using the ratio of these pathogens (23% to 14%), equating to an estimated 62% viral etiology and 38% bacterial etiology. Test sensitivity and specificity for SOC diagnostics were implemented as reported in a 2018 comparison of antibiotic prescribing for various disease areas by setting in the U.S., which assessed the appropriateness of antibiotic distribution based on patient diagnosis upon discharge. The study reported that viral pneumonia patients received antibiotics 21.7% of the time (FP), while non-viral (assumed bacterial) patients were given antibiotics in 66.4% of the cases (TP)Citation25. These values equate to a SOC sensitivity of 66.4% and specificity of 78.3%. Meanwhile, MMBV shows a sensitivity of 96.7% and specificity of 89.8% in a recent study of 1,016 patients with an acute infection where expert panel adjudication was applied to develop the reference standard for etiologies (96.7% TP; 3.3% FN; 89.8% TN; 10.2% FP), with 8.3% of tests yielding equivocal results (thus receiving the same diagnostic process and accuracy of SOC testing)Citation26.
The average proportions of CAP patients with each PSI risk score were used to inform the distribution of patient severity presenting to the ED and were reported by Fine et al., a commonly referenced study on hospitalization decision making across the varying levels of CAP severityCitation20. The probability of hospital admission (also sourced from Fine et al.) increased with each PSI risk score and was assumed to be the same for the SOC and SOC + MMBV arms in the main analysisCitation20. The average baseline LOS values of admitted patients for each PSI risk class were pulled from a 2020 analysis of CAP hospital admissions in the U.S. from Lodise et al., which analyzed data from over 400 hospitals across 42 U.S. statesCitation21.
Antibiotic treatment length as recommended by the American College of Physicians is 5 days; however, this is not current practiceCitation27. We, therefore, utilized an average value of 6.2 days of treatment as reported in a meta-analysis of PCTCitation19. This average value was utilized for patients who received antibiotics due to a TP or FP diagnosis. Alternatively, patients with an FN diagnosis were assumed to require more extensive treatment due to increased disease progression from delayed antibiotics, an assumption supported by various reports despite a lack of published CAP-specific dataCitation28–30. The impact on disease severity is implemented in our model as an extended antibiotic treatment length; these patients, therefore, received 50% more antibiotic treatment days than TP or FP patients, resulting in an estimated 9.3 days of antibiotic treatment.Footnotei
We assumed that bacterial or viral diagnoses would have varying levels of influence on a physician’s decision to administer antibiotics according to pneumonia severity. Therefore, each arm’s test result was assumed to account for 100%, 80%, 50%, and 0% of the antibiotic administration decisions for PSI scores 1 or 2, 3, 4, and 5, respectively. This means that for patients in PSI 1 or 2, physicians would follow diagnostic results completely when deciding whether patients should receive antibiotics (with bacterial results indicating antibiotic treatment and viral results indicating no antibiotic treatment), while patients in PSI 5 would not be impacted by diagnostic results and would receive antibiotic treatment regardless. Patients with false-negative test results were attributed the respective extended duration of antibiotic treatment under the assumption that they would eventually receive the appropriate antibiotic treatment. Although FN test results would likely have a further impact on patient outcomes that would influence hospitalizations, the main analysis focused on the benefits of avoided antibiotic treatment and considered further impacts in additional scenario analyses discussed later in the report.
Patients in the SOC arm were assumed to receive pre-diagnostic inpatient antibiotic treatment 75% of the time for PSI 1 or 2, 90% of the time for PSI 3, and 100% of the time for PSIs 4 and 5. When considering a weighted average of these probabilities based on the expected distribution of populations within each severity class, this estimation aligns with NHS evidence reporting that 86% of patients receive empirical antibiotics before test-result-based antibiotic decisions are madeCitation31. Pre-diagnostic treatment, defined as antibiotic prescription before microbiological confirmation by culture, was assumed to continue for an average of 1.5 days (36 h), a conservative estimate according to literature and clinical opinion, as obtaining blood culture results is often cited as a 24–48 h process, but can take up to 5 daysCitation32,Citation33. Patients who continued to receive diagnosis-based antibiotics received only 4.7 additional days after pre-diagnostic antibiotics to reach the 6.2-day total length of treatment (while FN patients received their full additional 9.3-day total). This resulted in a conservative estimate of the impact of pre-diagnostic antibiotic treatment, as evidence shows that many physicians restart the antibiotic treatment timeline when prescribing outpatient antibioticsCitation34. SOC + MMBV patients were assumed to be free of receiving pre-diagnostic antibiotics due to the short turnaround time in test results, allowing the physician to wait for the test result before prescribing.
The probability of experiencing antibiotic-related adverse events (AEs) for each arm was calculated using a rate of antibiotic-associated AEs (excluding CDI) of 0.002 per antibiotic day for each PSI levelCitation10. This calculation resulted in a greater likelihood of AEs for SOC compared to SOC + MMBV for each PSI score, as the likelihood of receiving diagnosis-based antibiotic treatment is greater with SOC and patients in the SOC + MMBV arm did not experience any pre-diagnostic antibiotic treatment. Similarly, the calculated risk of CDI was based on a hazard ratio of 1.09 for each additional day of antibiotic treatmentCitation35. The impacts of AEs and CDI were accounted for as additional hospital days with evidence from the literatureCitation22,Citation23.
Economic inputs
lists the economic inputs utilized in the model alongside their data sources. The cost of diagnostic testing for SOC was calculated by combining the costs of each of the elements involved in the standard diagnostic process for presenting CAP patients according to guidelines and other literatureCitation5,Citation6. This included chest X-ray, complete blood count, and viral PCR testing, and were priced according to the CPT codeCitation36. Given that the MMBV test was “pre-launch” at the time of this study, the models omit the costs of the test. The cost of an ED visit for pneumonia was acquired from a 2018 analysis of MarketScan data conducted by Tong et al.Citation37 According to data from the Healthcare Cost and Utilization Project (HCUP), the average cost of one day in the hospital for the cohort (i.e. a weighted average of pneumonia-related diagnosis codes) was approximately $2,209 per dayCitation38. The average cost of inpatient antibiotic treatment for SOC patients was reported as $174 per day in a study for a similar cohortCitation40. Outpatient antibiotic treatment cost was calculated to be about $3 per day, a weighted average of specific antibiotic costs and frequency of use according to Pfoh et al.Citation39
Table 2. Economic inputs.
Scenario analysis 1: Hospital admission rate impact
In the first scenario analysis, we considered the potential impact from MMBV on the hospitalization rate from the ED while holding all other input fields equal to the baseline values. The admission probability of SOC + MMBV patients was calculated utilizing an estimation of the proportion of admission decisions that were likely to be made according to the test result. We estimated this to be 20% for PSI scores 1 or 2, 40% for PSI 3, 30% for PSI 4, and 0% for PSI 5. The resulting hospital admission probability was then calculated by attributing the base-case admission probability from the main analysis to all patients not influenced by test results, while result-driven bacterial diagnoses were assumed to indicate hospital admissions and viral diagnoses would indicate discharges. SOC patients have attributed baseline admission probabilities of hospital admission for each PSI risk score, and admission probabilities for SOC + MMBV were calculated using the difference in bacterial diagnosis probabilities between SOC and SOC + MMBV. This analysis also incorporated an additional risk of hospitalization for FN patients who were initially discharged from the ED without hospital admission, under the assumption that these patients would be returning to receive the appropriate antibiotic treatment. The resulting hospital admission probabilities for each PSI cohort are shown in .
Table 3. Scenario-specific clinical inputs.
Scenario analysis 2: Length of stay impact and DRG reallocation
The second scenario analysis implemented an influence of MMBV on patient severity, resulting in shorter LOS (benefiting hospitals) and cheaper DRG allocations (benefiting payers). The LOS benefit was quantified due to an expected reduction in the proportion of hospital admissions that are bacterial-diagnosed patients, as literature reports a shorter length of stay for viral-diagnosed patients. Both arms utilized the baseline hospitalization probabilities. The average stays for the SOC arm were assumed to be equivalent to the baseline LOS values for each PSI score. Meanwhile, the LOS for the SOC + MMBV arm were recalculated assuming that each diagnostic pathway resulted in a different LOS. The hospital stays for patients diagnosed as bacterial (TP or FP) was assumed to be equal to the baseline LOS values. Length of correctly diagnosed viral stays (TN) was calculated assuming a 31% reduction in LOS compared to bacterial patients, as reported in a 2016 comparison of viral and bacterial hospital-acquired pneumonia patientsCitation41. Meanwhile, this analysis assumed that incorrectly diagnosed viral stays (i.e. bacterial patients diagnosed as viral; FN) would experience a longer hospital stay than bacterial patients who were correctly diagnosed upon admission. Underdiagnosis would delay antibiotic treatment initiation, logically enabling disease progression and increased severity while patients remained untreated. Although there is limited literature on the impact of drastic delays to antibiotic treatment (multi-day as opposed to hourly delays) in CAP cohorts, there is evidence that implies the heavy influence of delays on patient treatment pathwaysCitation28,Citation42. We averaged the percent differences between delayed-antibiotic patients and non-delayed antibiotic patients reported in two studies reporting on the impact of treatment delays (50%) and attributed an additional LOS of this magnitude to FN patients’ hospital stays in the modelCitation28,Citation42. The SOC + MMBV average LOS was then calculated, which was weighted according to the expected frequency of each test outcome (i.e. TP, FN, TN, FP). The resulting overall LOS values for SOC and SOC + MMBV are shown for each PSI cohort in .
Payers would not expect to benefit directly from shorter hospital stays, as they generally pay via a fixed price fee schedule categorized by DRG codes attributed at discharge. The current cohort falls under three DRG codes as previously discussed, which consist of varying levels of comorbidities and complications. The baseline hospital cost was calculated using the weighted average of these codes according to the frequency reported by HCUP. However, we would expect that SOC + MMBV would generally decrease the portion of patients who are given the more severe DRG classifications as a result of less severe patient cases. This impact was quantified in the model as a reallocation of DRG scores, where the DRG code was decreased one tier for the percentage of patients that would “avoid” FN diagnosed hospital admissions with SOC + MMBV in comparison to SOC. This simulates how increased patient severity would impact hospital stays and the DRGs assigned at discharge for MMBV. The difference in FN admissions between SOC and SOC + MMBV and the resulting adjusted hospitalization costs (for payers) are shown in .
Scenario analysis 3: Hospital admission rate, length of stay impact, & DRG reallocation
In the third scenario analysis, the expected hospital admission, LOS, and DRG reallocation impacts from MMBV were both incorporated. Thus, patients diagnosed using SOC have attributed baseline hospital admission probabilities and the hospital stays calculated from bacterial versus viral diagnosis probability, while SOC + MMBV-diagnosed patients were attributed reduced hospital admission probabilities, shortened LOS, and DRG reallocated hospital costs according to diagnosis as described in the scenario analyses above.
Results
Main analysis results
The main analysis clinical outcomes are reported in and represent the clinical benefit of using SOC + MMBV instead of SOC alone for a cohort of 1,000 patients. Clinical results stratified by PSI score are reported in Appendix A. Results show significant savings in terms of patients who avoided antibiotic treatment and the total number of antibiotic treatment days avoided by the population. The main analysis assumes no impact on hospital admission rate from MMBV and therefore shows no admissions avoided.
Table 4. Clinical outcomes from SOC + MMBV.
The economic results are presented as potential costs and savings for payers and hospitals and do not account for potential revenue effects for hospitals. Therefore, the costs from each field are not mutually exclusive; costs can be attributed to both the payer and the provider to the extent that either entity incurs costs (e.g. testing cost). The breakdown of fields for which costs and savings are considered for each perspective is shown in .
Table 5. Value drivers by perspective.
Payer and provider results are intended to be interpreted separately with the intention that both perspectives would provide an estimation of the level of savings that may be experienced utilizing MMBV. Economic results are displayed as per-patient savings in , while complete economic results with costs and savings broken down by value driver can be found in Appendix B. Results are presented by PSI risk class as well as for the overall cohort, computed as an average of the values determined for each PSI score weighted by the average proportion of CAP patients with each score as reported by Fine et al.Citation20 No savings exist for patients in PSI class 5 as we assume that diagnostic result would have no impact on a physician’s antibiotic administration decision or hospital admission decision for patients of this severity.
Table 6. Payer and provider cost savings.
Scenario analyses results
The clinical and economic impacts of MMBV for all scenario analyses are shown in respectively, alongside the main analysis results.
Scenario 1 considered the impact of MMBV on hospital admission rates. In this scenario, antibiotics patients avoided and total antibiotic days saved do not differ from the results of the baseline analysis as the hospital admission decision process was assumed to be independent of the antibiotic administration decision process. Similar to the main analysis, there are no economic savings for the PSI 5 cohort because diagnosis is assumed to have zero impact on the admission decision for patients of that severity. Savings for all other cohorts are increased in this analysis in comparison to the main analysis, aside from the PSI 4 cohort.
Scenario 2 considered an influence from MMBV on hospital LOS and payer DRG costs. Once again, results show a lack of avoided hospital admissions in this analysis as the impact of shortened LOS for SOC + MMBV patients only impacts those who have already been admitted and has no influence on the hospital admission probability. However, we do see an increase in hospital days saved in comparison to the main analysis. Economically, there are cost savings attributable to the provider in the PSI 5 cohort due to LOS differences between SOC and SOC + MMBV patients, and savings attributable to the payer due to a reallocation of DRG coding.
Scenario analysis 3 combined the cost drivers from scenario analyses 1 and 2, considering the impacts of avoided hospital admissions, shorter hospital stays, and DRG reallocation. As expected, the clinical and economic advantages of MMBV are greatest in this scenario as they reflect the combined impact of reductions in antibiotic treatment, hospital admissions, length of hospital stay, and payer hospitalization costs.
Sensitivity analyses results
Overall one-way deterministic sensitivity analysis (SA) results are shown as tornado diagrams in and display the ten parameters with the greatest impact on savings for each analysis. Sensitivity analysis results for each individual PSI cohort are available upon request.
Figure 2. Main analysis savings sensitivity analysis results. Abbreviations. CAP, community acquired pneumonia; CDI, Clostridioides difficile MMBV, MeMed BV; PSI, pneumonia severity index; SOC, standard of care; TN, true negative; TP, true positive. *Max input value of 1 or 100%.
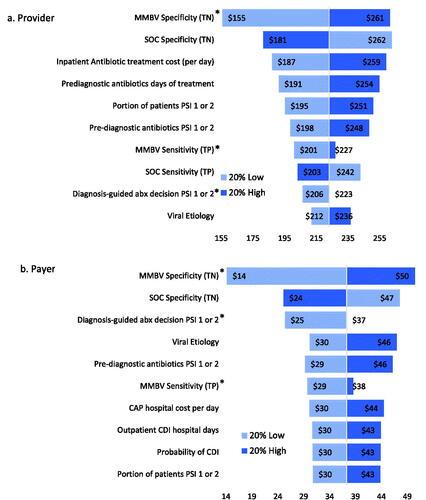
Figure 3. Scenario 1 savings sensitivity analysis results. Abbreviations. CAP, community acquired pneumonia; LOS, length of stay; MMBV, MeMed BV; PSI, pneumonia severity index; SOC, standard of care; TN, true negative; TP, true positive. *Max input value of 1 or 100%.
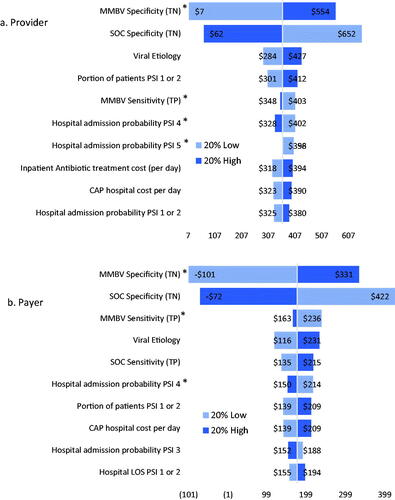
Figure 4. Scenario 2 savings sensitivity analysis results. Abbreviations. CAP, community acquired pneumonia; LOS, length of stay; MMBV, MeMed BV; PSI, pneumonia severity index; SOC, standard of care; TN, true negative; TP, true positive. *Max input value of 1 or 100%.
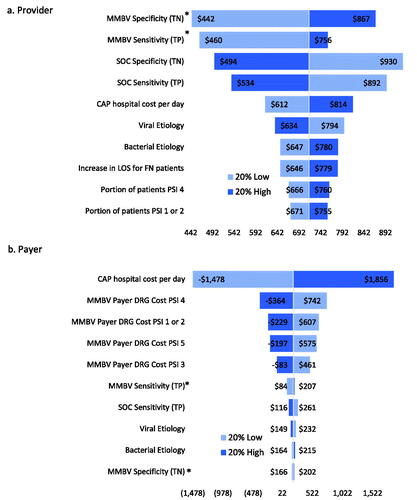
Figure 5. Scenario 3 sensitivity analysis results. Abbreviations. CAP, community acquired pneumonia; DRG, diagnosis related group; MMBV, MeMed BV; PSI, pneumonia severity index; SOC, standard of care; TN, true negative; TP, true positive. *Max input value of 1 or 100%.
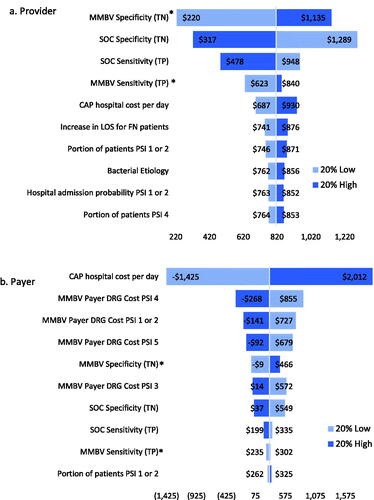
The main analysis results indicate that the specificity of MMBV has the greatest impact on provider cost savings, followed by SOC specificity, the cost of one day of inpatient antibiotic treatment, and the pre-diagnostic days of treatment for SOC. Meanwhile, payer savings are most sensitive to changes in MMBV specificity, SOC specificity, the portion of cases for which diagnoses are used to guide antibiotic decisions in PSIs 1 or 2, and the portion of CAP patients with viral etiology. Both provider and payer savings remain robust to all input variations. The variable that we would expect to see the most variation in is SOC test sensitivity. Reports of this metric in literature are quite rare, and the true sensitivity value likely varies significantly by each physician’s diagnostic methodology. Given this expected disparity, it is promising that both payer and provider overall savings remain robust with 20% variation in SOC sensitivity and that an increase to 100% sensitivity maintains provider and payer savings ($172 and $22, respectively).
In Scenario 1, provider savings are most sensitive to changes in MMBV and SOC specificity, viral etiology, and the portion of patients in PSI 1 or 2. Meanwhile, payer savings are most responsive to changes in MMBV and SOC specificity, viral etiology, MMBV sensitivity, and the probability of hospital admission for PSI 4. SOC + MMBV becomes cost-losing for both payers and providers with a 20% decrease in MMBV specificity, and with a 20% increase in SOC specificity for payers alone. Scenario 2 provider savings are most sensitive to changes in both MMBV and SOC test accuracy, while payer savings are sensitive to the cost of a hospital day and the payer DRG reallocated hospital costs. Provider savings are robust to parameter variation, while payers see losses with a 20% decrease in CAP hospital costs (used for SOC payer costs in this scenario) and 20% increases in MMBV payer DRG reallocated costs for each PSI level. Finally, both provider and payer savings are most sensitive to changes in MMBV and SOC test accuracy and the CAP hospital cost per day in scenario 3. In this analysis, savings remain robust with 20% variation in either direction for providers, while payer savings become negative with 20% decreases in the SOC CAP hospital cost per day and 20% increases in the MMBV reallocated DRG costs for PSIs 1 or 2, 4, and 5, and 20% decrease in MMBV specificity.
Discussion
The economic model developed for this analysis consistently shows that, for each PSI level and from different perspectives, improved diagnostics for suspected CAP infections have the potential to save health care resources. Results show relatively low savings for payers in the main analysis, which is expected as they are not held responsible for inpatient antibiotic costs or additional hospital days from inpatient CDI. However, payer savings increase to $293.38 overall in scenario 3 when considering expected reductions in hospital admissions and patient severity lowering payer hospital costs. Providers may experience savings ranging from $0 for PSI 5 to $301.57 in PSI 3 in the main analysis, with savings up to $1,435.37 (PSI 5) in Scenario 3, averaging $808.65 per patient across all patient cohorts.
The results shown in this study are also impactful due to the reported over-prescription of antibiotics and resulting increasing burden of antimicrobial resistance. AMR is estimated to cost US $55 billion annually, with up to $1 trillion in increased healthcare costs per year expected by 2050Citation43. Further, hospitals will spend between $10,000-$40,000 on a single patient for AMR-specific treatment. According to the World Health Organization, pneumonia is becoming harder to treat as antibiotics become less effective because of AMR. This is causing longer hospital stays, higher medical costs, and increased mortalityCitation44. Further, AMR can prevent patients from receiving prompt appropriate treatment, making them susceptible to a longer disease course, longer infectious periods, and an increase in the likelihood of transmission. As patients become increasingly resistant to the most efficacious agents, the standard antibiotic regimens are being altered, causing even non-resistant patients to receive sub-optimal treatment coursesCitation45. Cost savings from MMBV related to reduced antibiotic resistance are not quantified in this analysis, but represent an important source of the potential impact on the healthcare system. With an improved specificity compared to SOC, MMBV has the potential to significantly decrease the amount of antibiotic overuse in the disease space, reducing the risk of AMR. Avoiding AMR-related hospital admissions and shortening stays have direct impacts on costs for both hospitals and payers, and can also influence patient satisfaction, quality of life, and risk of death.
This model is a conservative representation of the potential cost savings attributable to MMBV. Specific attention was given to the plausibility of MMBV impact on physicians’ decision-making, and results were stratified by patient severity to transparently express this barrier to the benefit of MMBV’s increased test accuracy. The sensitivity and specificity of MMBV were also potentially underestimated as it was based on a reference standard employing majority expert panel adjudication; in the same study when a reference standard was used that required unanimous expert panel adjudication, the sensitivity was 100% and specificity was 95% with only 7.1% equivocalCitation26. If we had used these test accuracy data for MMBV, the results would have shown savings of $248 for providers and $45 for payers in the baseline analysis, reaching $1,018 and $395 for providers and payers, respectively, in scenario 3.
Though these results are generally robust to significant changes in levels of key variables, the models have some important limitations. First and foremost, the models are simulations of real-world clinical processes and are not sensitive to variations in clinical practice driven by differences in physician practice styles, differences in facility-level practice patterns, and patient comorbidities expected to exacerbate the clinical impact of CAP. As such, the models should be interpreted as illustrations of what is likely to occur if a better diagnostic was inserted into a typical respiratory infection clinical pathway. Second, hospital models are limited to costs and do not consider differences in revenue associated with each approach. That said, given that most providers operate in a “fixed price” environment, differences in costs are normally the most important metrics considered by hospitals. Finally, as with any literature-based simulation model, the available data in some cases did not perfectly align with model needs, requiring intermediate calculations to generate parameter estimates. However, as discussed above, the varying parameters in sensitivity analyses are a reasonable means of addressing this limitation.
Conclusions
Introducing MMBV to the current SOC diagnostic process is likely to be cost-saving to both hospitals and payers. MMBV can significantly reduce unnecessary antibiotic distribution, saving approximately 1,129 antibiotic days per 1,000 ED-presenting CAP patients. Although the diagnostic is not likely to influence decision-making for patients in PSI 5, payers could save up to $294 overall, while providers could save up to $809 overall when considering the potential impact of MMBV on antibiotic distribution, hospital admission rate, hospital LOS, and DRG reallocation. Sensitivity analyses indicated that these savings are robust to variations in all input parameters in the main analysis, though extreme variations in hospitalization cost and test accuracy may sway savings in scenario analyses.
Transparency
Declaration of funding
This study was funded by MeMed Ltd.
Declaration of financial/other interests
JES is CEO and Principal of Avalon Health Economics, and JTC is an employee of Avalon Health Economics. Avalon Health Economics was contracted for the completion of this work by MeMed Ltd.
Peer reviewers on this manuscript have received an honorarium from JME for their review work but have no other relevant financial relationships to disclose.
Author contributions
JES designed the analysis, oversaw model development, and contributed to the writing of the manuscript. JTC performed the analysis and drafted the manuscript. Both authors reviewed and approved the final report.
Acknowledgements
None stated.
Notes
i The 50% increase in antibiotic treatment length is an assumption based on evidence regarding increased length of hospital stay for FN patients, described in detail in the Scenario Analysis 2: Length of Stay Impact and DRG Reallocation section. It was assumed that the magnitude of impact on hospital LOS would be representative of the impact on antibiotic treatment length.
References
- Ferreira-Coimbra J, Sarda C, Rello J. Burden of community-acquired pneumonia and unmet clinical needs. Adv Ther. 2020;37(4):1302–1318.
- Divino V, Schranz J, Early M, et al. The 1-year economic burden of community-acquired pneumonia (CAP) initially managed in the outpatient setting in the USA. J Comp Eff Res. 2020;9(2):127–140.
- Stupka JE, Mortensen EM, Anzueto A, et al. Community-acquired pneumonia in elderly patients. Aging Health. 2009;5(6):763–774.
- Jain S, Self WH, Wunderink RG, et al. Community-acquired pneumonia requiring hospitalization among U.S. adults. N Engl J Med. 2015;373(5):415–427.
- Metlay JP, Waterer GW, Long AC, et al. Diagnosis and treatment of adults with community-acquired pneumonia. An official clinical practice guideline of the American Thoracic Society and infectious diseases society of america. Am J Respir Crit Care Med. 2019;200(7):e45–e67.
- Saeed K, Wilson DC, Bloos F, et al. The early identification of disease progression in patients with suspected infection presenting to the emergency department: a multi-Centre derivation and validation study. Critical Care. 2019;23(1):40.
- Huijskens EGW, Koopmans M, Palmen FMH, et al. The value of signs and symptoms in differentiating between bacterial, viral and mixed aetiology in patients with community-acquired pneumonia. J Med Microbiol. 2014;63(Pt 3):441–452.
- Battle of the bugs: fighting antibiotic resistance. US Food and Drug Administration; 2016.
- Klompas M, Ochoa A, Ji W, et al. Prevalence of clinical signs within reference ranges among hospitalized patients prescribed antibiotics for pneumonia. JAMA Netw Open. 2020;3(7):e2010700.
- Tamma PD, Avdic E, Li DX, et al. Association of adverse events with antibiotic use in hospitalized patients. JAMA Intern Med. 2017;177(9):1308–1315.
- Ashkenazi-Hoffnung L, Oved K, Navon R, et al. A host-protein signature is superior to other biomarkers for differentiating between bacterial and viral disease in patients with respiratory infection and fever without source: a prospective observational study. Eur J Clin Microbiol Infect Dis. 2018;37(7):1361–1371.
- Eden E, Srugo I, Gottlieb T, et al. Diagnostic accuracy of a TRAIL, IP-10 and CRP combination for discriminating bacterial and viral etiologies at the emergency department. J Infect. 2016;73(2):177–180.
- Stein M, Lipman-Arens S, Oved K, et al. A novel host-protein assay outperforms routine parameters for distinguishing between bacterial and viral lower respiratory tract infections. Diagn Microbiol Infect Dis. 2018;90(3):206–213.
- Oved K, Cohen A, Boico O, et al. A novel host-proteome signature for distinguishing between acute bacterial and viral infections. PLOS One. 2015;10(3):e0120012.
- Srugo I, Klein A, Stein M, et al. Validation of a novel assay to distinguish bacterial and viral infections. Pediatrics. 2017;140(4):e20163453.
- van Houten CB, de Groot JAH, Klein A, et al. A host-protein based assay to differentiate between bacterial and viral infections in preschool children (OPPORTUNITY): a double-blind, multicentre, validation study. Lancet Infect Dis. 2017;17(4):431–440.
- Havers FP, Hicks LA, Chung JR, et al. Outpatient antibiotic prescribing for acute respiratory infections during influenza seasons. JAMA Netw Open. 2018;1(2):e180243.
- Ruiz-González A, Falguera M, Vives M, et al. Community-acquired pneumonia: development of a bedside predictive model and scoring system to identify the aetiology. Respir Med. 2000;94(5):505–510.
- Schuetz P, Wirz Y, Sager R, et al. Effect of procalcitonin-guided antibiotic treatment on mortality in acute respiratory infections: a patient level meta-analysis. Lancet Infect Dis. 2018;18(1):95–107.
- Fine MJ, Auble TE, Yealy DM, et al. A prediction rule to identify low-risk patients with community-acquired pneumonia. N Engl J Med. 1997;336(4):243–250.
- Lodise TP, Van Le H, LaPensee K. Hospital admission patterns in adult patients with community-acquired pneumonia who received ceftriaxone and a macrolide by disease severity across United States hospitals. Antibiotics. 2020;9(9)577.
- Lin RY, Nuruzzaman F, Shah SN. Incidence and impact of adverse effects to antibiotics in hospitalized adults with pneumonia. J Hosp Med. 2009;4(2):E7–15.
- Zhang S, Palazuelos-Munoz S, Balsells EM, et al. Cost of hospital management of clostridium difficile infection in United States-a meta-analysis and modelling study. BMC Infect Dis. 2016;16(1):447–447.
- Wu X, Wang Q, Wang M, et al. Incidence of respiratory viral infections detected by PCR and real-time PCR in adult patients with community-acquired pneumonia: a meta-analysis. Respiration. 2015;89(4):343–352.
- Palms DL, Hicks LA, Bartoces M, et al. Comparison of antibiotic prescribing in retail clinics, urgent care centers, emergency departments, and traditional ambulatory care settings in the United States. JAMA Intern Med. 2018;178(9):1267–1269.
- A novel, rapid host-response test permits accurate differentiation of bacterial and viral infection in febrile ambulatory patients: Apollo study. In Progress.
- Appropriate use of Short-Course antibiotics in common infections: best practice advice from the American College of Physicians. Annals Internal Med. 2021;174(6):822–827.
- Bonine NG, Berger A, Altincatal A, et al. Impact of delayed appropriate antibiotic therapy on patient outcomes by antibiotic resistance status from serious gram-negative bacterial infections. Am J Med Sci. 2019;357(2):103–110.
- Broyles MR. Impact of Procalcitonin-Guided antibiotic management on antibiotic exposure and outcomes: real-world evidence. Open Forum Infectious Diseases. 2017;4(4):ofx213
- Stuart B, Hounkpatin H, Becque T, et al. Delayed antibiotic prescribing for respiratory tract infections: individual patient data meta-analysis. BMJ. 2021;373:n808.
- Agency NPaS. Procalcitonin to differentiate bacterial lower respiratory tract infections from non-bacterial causes. Economic Report: NHS; 2010.
- Giuliano C, Patel CR, Kale-Pradhan PB. A guide to bacterial culture identification and results interpretation. P T. 2019;44(4):192–200.
- Su C-P, Chen TH-H, Chen S-Y, et al. Predictive model for bacteremia in adult patients with blood cultures performed at the emergency department: a preliminary report. J Microbiol Immunol Infect. 2011;44(6):449–455.
- Dall C. Pneumonia patients get too many antibiotics, study finds. Antimicrobial Stweardship. 2019. Available from: https://www.cidrap.umn.edu/news-perspective/2019/07/pneumonia-patients-get-too-many-antibiotics-study-finds.
- Chalmers JD, Akram AR, Singanayagam A, et al. Risk factors for clostridium difficile infection in hospitalized patients with community-acquired pneumonia. J Infect. 2016;73(1):45–53.
- Physician Fee Report. 2019. Context4 Healthcare, Inc.
- Tong S, Amand C, Kieffer A, et al. Trends in healthcare utilization and costs associated with pneumonia in the United States during 2008–2014. BMC Health Serv Res. 2018;18(1):715.
- HCUPnet. Healthcare cost and utilization project (HCUP), agency for healthcare research and quality. Rockville, MD 2017. [cited 2021 Feb 21]. Available from: http://hcupnet.ahrq.gov/
- Pfoh E, Wessels MR, Goldmann D, et al. Burden and economic cost of group a streptococcal pharyngitis. Pediatrics. 2008;121(2):229–234.
- Voermans AM, Mewes JC, Broyles MR, et al. Cost-Effectiveness analysis of a Procalcitonin-Guided decision algorithm for antibiotic stewardship using Real-World U.S. Hospital Data. OMICS. 2019;23(10):508–515.
- Shorr AF, Zilberberg MD, Micek ST, et al. Viruses are prevalent in non-ventilated hospital-acquired pneumonia. Respir Med. 2017;122:76–80.
- Menéndez R, Torres A, Reyes S, et al. Initial management of pneumonia and sepsis: factors associated with improved outcome. Eur Respir J. 2012;39(1):156–162.
- Ahmad M, Khan AU. Global economic impact of antibiotic resistance: a review. J Glob Antimicrob Resist. 2019;19:313–316.
- Antibiotic Resistance World Health Organization Newsroom: WHO; 2020 [cited 2021]. Available from: https://www.who.int/news-room/fact-sheets/detail/antibiotic-resistance.
- Friedman ND, Temkin E, Carmeli Y. The negative impact of antibiotic resistance. Clin Microbiol Infect. 2016;22(5):416–422.