
Abstract
Aims
Accurately estimating mean survival after solid organ transplant (SOT) is crucial for efficient healthcare resource allocation decisions. However, registry-based post-transplant recipient survival estimates vary greatly and are incomplete. Often, the methods used in lifetime survival extrapolation may not fit complex transplant data and therefore alternative methods are required. We aimed to explore the flexible cubic spline methodology as a meaningful alternative for estimating lifetime survival following SOT.
Methods
Survival analyses were conducted in kidney, liver, heart, and lung transplant recipients. Mean survival was estimated using flexible cubic splines on the hazard scale fitted with three knots, based on where hazards changed direction, clinical advice, and best-fit curve using Akaike and Bayesian information criterion. The tail was extrapolated when data were no longer available. Extrapolation tails were compared with general population mortality, using age-matched life table hazards, and the highest hazards were taken at all times.
Results
We found that mean survival post-transplant was longest for kidney transplants (US: 22.79 years; UK: 26.58 years), followed by liver (US: 20.90 years; UK: 20.38 years), heart (US: 14.82 years; UK: 15.85 years), and lung (US: 9.28 years; UK: 9.21 years). A sensitivity analysis using two knots found differences in survival ranging from −1.30 to +4.83 years across SOTs examined.
Limitations
This study does not represent individual patient survival, survival by age groups, multiple-organ transplants, or assess factors that may impact overall or organ survival.
Conclusions
Our study estimates reflect real-world survival following SOTs and demonstrate the importance of including long-term hazards in survival estimations. These lifetime survival estimates can be used by decision-makers in situations where means are preferred over medians (e.g. population projections, budgetary estimates, and cost-effectiveness models) and can thus offer a meaningful alternative to the estimates used and accepted in current practice.
Keywords:
Introduction
Organ transplantation has been available for over 60 years, with the first successful solid organ transplant (SOT) conducted in 1954Citation1,Citation2. SOT is now an established treatment option for patients with end-organ damageCitation3. In 2019, approximately 153,863 SOTs were performed globally, the most frequent being single kidney, liver, heart, and lung transplants, accounting for over 95% of the transplant populationCitation4. The US and the UK have robust registries in place that have been collating SOT data since the 1990s, i.e. the Scientific Registry of Transplant Recipients (SRTR) and the UK Transplant Registry (UKTR), respectively. The US has one of the highest transplantation rates in the world, at 106.1 transplants per million populationCitation5. A total of 23,401 kidney, 8,896 liver, 3,552 heart, and 2714 lung transplant recipients received a graft in 2019, which comprises 98% of US transplantsCitation6. The US also has a high rate of pediatric transplants (≤17 years of age), which account for 3–15% of the total SOT populationCitation6. In contrast to the US, transplant rates in the UK are lower (23.7 transplants per million population)Citation7, largely due to low donation consent among deceased donor familiesCitation8. In 2019, a total of 3,601 kidney, 1,010 liver, 173 heart, and 159 lung transplants were conducted in the UK, with up to 9% of transplants conducted in the pediatric populationCitation7.
Through examination of SOT patient data, it has become apparent that post-transplant recipient survival varies greatly and is dependent on a number of variables such as SOT type, transplant wait time, patient age and sex, and duration of hospitalizationCitation9–11. Over time, new therapies and transplant techniques have improved short-term survival outcomes; however, long-term survival of transplants has stagnatedCitation12. Younger recipients exhibit markedly increased survival over adults, with reported survival of ≥25 years, an increase of more than 10 years compared with adults in some SOTsCitation12. Despite this, true lifetime survival of SOT recipients is unknown; even though registry follow-up can span upwards of 20 years, most transplant recipients are alive at the end of follow-up and lifetime survival estimates must be used.
Estimating lifetime survival is crucial for economic models that assist in planning for healthcare resource allocations (e.g. budget impact analyses) or determining if an intervention is good value for money (e.g. cost-effectiveness analyses). Extrapolation methods utilizing parametric distributions such as exponential, Weibull, and log logistic are frequently used for survival analyses; however, different distributions can result in significantly different survival estimates, particularly when a substantial amount of extrapolation is requiredCitation13,Citation14. These simple parametric methods may not fit complex data such as those from SOT patients, and therefore other approaches such as cubic splines may be needed to better extrapolate the data. Cubic splines join smoothed mathematical functions together at points known as “knots” to capture complex hazard and survival functionsCitation15,Citation16. A comprehensive review of survival extrapolation methods reported that combining shorter-term, individual-level data with longer-term, external data in flexible parametric modeling using cubic splines combines the advantages of many extrapolation models and is more robust than several other methods examinedCitation16,Citation17. Furthermore, the UK National Institute for Health and Care Excellence (NICE) Decision Support Unit (DSU) guidance recommends utilizing both patient-level and external data to minimize extrapolation and confirm clinical plausibility of the extrapolation and any changes in the underlying hazardsCitation13. By taking into account the complex data in SOT populations and including long-term hazards in the survival extrapolations, this study sought to explore the flexible cubic spline methodology as a meaningful alternative method for estimating mean lifetime survival in US and UK patients following the most prevalent single SOTs (kidney, liver, heart, and lung).
Materials and methods
This study used data from the SRTR. The SRTR data system includes data on all donor, wait-listed candidates, and transplant recipients in the US, submitted by the members of the Organ Procurement and Transplantation Network (OPTN). The Health Resources and Services Administration (HRSA), US Department of Health and Human Services provides oversight to the activities of the OPTN and SRTR contractors. The SRTR includes detailed patient and graft survival data for all SOTs in the US from 1990 to 2018. This study also used data from the UKTR (held by the National Health Service [NHS] Blood and Transplant), which includes patient and graft survival for all SOTs in the UK from 1995 to 2017.
Separate survival analyses were conducted for the US and UK using patient-level data for four single SOT types: kidney, liver, heart, and lung. Variables extracted for this study included age group at transplant, organ transplanted, time to death, and censoring/event flag. Patient-level data and registry variables were assessed for data inconsistencies, and preliminary Kaplan–Meier survival and hazard rates analyzed to aid in projection methods.
Following NICE DSU guidance on survival analysesCitation13, traditional parametric survival analyses were first carried out using six distributions: exponential, generalized gamma, Gompertz, log logistic, log normal, and Weibull. Goodness-of-fit was assessed with fit statistics (Akaike information criterion [AIC] and Bayesian information criterion [BIC]) and overlays of fitted curves and Kaplan–Meier plots (see analysis plan in Supplementary Figure S1). Owing to the complex hazards of survival post-transplant, traditional parametric models did not fit well, and analysis moved on to flexible cubic spline models as recommended in the guidanceCitation13.
To minimize potential model overfitting, hazard rates were plotted over time using the kernel density estimator in the R muhaz package (Supplementary Figure S2) and a clinical expert identified time periods where hazard rates changed direction for each organ type by country. Hazard inflection points corresponded to clinically important periods of time (e.g. short-term graft rejection, mid-term graft rejection, long-term survivors). Flexible cubic splines with hazard scale were fitted with the identified two and three knots for each organ within each dataset using R flexsurv package (). Weibull distribution was used between each knot, with flexible cubic splines providing the smoothing. The Weibull distribution allowed hazard rates to go in one direction between knots and change direction and magnitude at each knot. As the knots were manually placed at hazard inflection points, scales that allowed frequent changes in direction between knots, such as normal and odds scales, were not deemed appropriate. The Weibull hazard scale, which allows only monotonic changes to the hazard between knots and directional changes at knots/inflection points, was considered more in line with real-world survival.
Table 1. Knot placements per solid organ transplant for the US and UK analyses.
The extrapolation tails were compared with general population mortality, using age-matched life table hazards based on the US and UK life tables for the total populationCitation18,Citation19. An adjustment was applied in situations where cubic spline hazards were less than the general population hazards and survival curves (i.e. the highest hazard was taken at all times).
Goodness-of-fit statistics and graphical overlays of Kapan–Meier plots and fitted curves were used to determine the best-fit models. Survival was calculated as the area under the curve for each fitted model for each organ within each data set.
This study was conducted using existing databases of de-identified transplant recipients; therefore it did not require institutional review board/independent ethics committee approval.
Results
Epidemiological data
Survival data for 621,447 SOT recipients in the US and 60,919 SOT recipients in the UK were analyzed. This comprised 382,663 kidney, 137,579 liver, 64,868 heart, and 36,337 lung transplants in the US and 40,133 kidney, 13,957 liver, 3,917 heart, and 2,912 lung transplants in the UK ( and ). Adults represented the majority of transplants in both countries, with kidney and liver transplants being the most prevalent transplants captured in both the US and UK populations. In both countries, over 60% of all SOTs were conducted in the 31–60 age groups, with the lowest number of transplants seen in the ≥70 age group. In the US, there was a lower percentage of overall transplants conducted between 1990 and 2004, with percentages increasing from 2005 onwards. In the UK, a similar low trend was observed between 1995 and 2009, with an increase in overall transplant percentages from 2010 onwards, most prominently in liver and lung transplants.
Figure 1. Comparison of Kaplan–Meier plots of patient survival following SOT in the US and UK*. *Number at risk represents the number of registry patients still alive at each time point. Abbreviation. SOT, solid organ transplant.
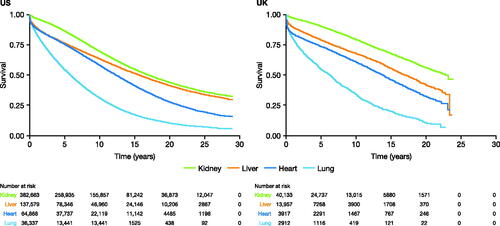
Table 2. Patient baseline characteristics and transplant year category.a
Patient-level survival data
Kaplan–Meier survival curves were plotted based on 28 years of US patient data and 22 years of UK patient data (). At the end of follow-up, the highest percentage of patients at risk (patients still alive and in the registry) was in kidney SOTs, with 3.1% of US patients and 3.9% of UK patients at risk, whereas in lung SOTs this dropped to 0.3% of US patients and 0.8% of UK patients.
Mean lifetime survival estimates following SOT
After applying the parametric functions for extrapolation (exponential, generalized gamma, Gompertz, log logistic, log normal, and Weibull), none were considered a good fit and fitting moved on to three-knot and two-knot models (). The hazard plots showed inflection points, leading to splines being the preferred method for extrapolation. Flexible cubic splines with hazard scales were applied and fitted with two and three knots that were identified with the clinical expert (). Based on AIC/BIC analysis, the three-knot splines were the best-fit scales for all organ transplants for the US, followed closely by the two-knot splines. Similar results were seen in the UK with the three-knot splines being the best-fit for kidney, liver, and heart followed by the two-knot splines. For lung transplants in the UK, which has the lowest total number of transplants, the AIC/BIC for the three-knot and two-knot splines were similar and less than 15 points of the lowest AIC/BIC (generalized gamma). Based on clinical advice and goodness-of-fit, the three-knot splines were considered the base case for all transplants across both countries and the two-knot splines were analyzed as a sensitivity analysis (). As described in the methods, the hazard was not allowed to fall below that of the general populationCitation18,Citation19.
Table 3. Fit statistics for all parametric and knot functions applied to the US and UK data.a
Mean estimated survival using the three-knot spline and life tables was longest following kidney transplant, at 22.79 years in US recipients and 26.58 years in UK recipients ( and ). This was followed by liver transplants, with a mean estimated survival of 20.90 years in the US and 20.38 years in the UK ( and ), while heart transplants had mean survivals of 14.82 years in the US and 15.85 years in the UK ( and ). In both countries, mean estimated survival was lowest in lung transplant recipients: 9.28 years in the US and 9.21 in the UK ( and ).
Figure 2. Comparison of Kaplan–Meier plots of survival following SOT in the base-case (knot = 3 and life tables) and sensitivity analysis (knot = 2). (a) Kidney transplant survival in the US; (b) kidney transplant survival in the UK; (c) liver transplant survival in the US; (d) liver transplant survival in the UK; (e) lung transplant survival in the US; (f) lung transplant survival in the UK; (g) heart transplant survival in the US; (h) heart transplant survival in the UK. Abbreviations: K, knot; LT, life table; SOT, solid organ transplant.
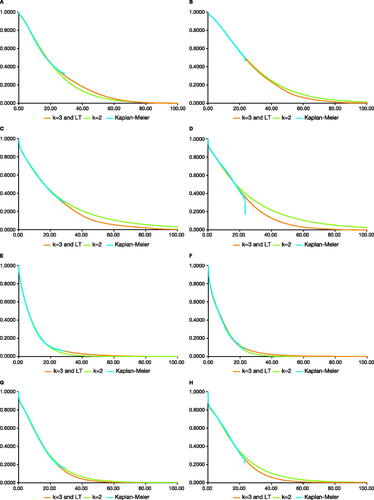
Table 4. Mean estimated lifetime survival post-transplant.
To investigate how knot placement affected the survival estimates, a sensitivity analysis was conducted using a two-knot fit that assumed there were no differences in hazard direction over the long-term. The sensitivity analysis showed small differences in mean survival across all SOTs, the differences ranging from −1.30 years to +3.14 years in the US and −0.64 to +4.83 years in the UK (). The differences in mean estimated survival were lowest in lung and heart transplants in the US (−0.76 years and +0.75 in the sensitivity analysis vs base-case survival, respectively; ), and in lung transplants in the UK (−0.64 years vs base-case survival, ). The SOTs most affected by long-term hazards and exhibiting the largest differences in mean estimated survival were liver transplants in the US (+3.14 years vs the base case, respectively; ), and liver transplants in the UK (+4.83 years vs the base case, ).
Survival estimates without life table adjustments are provided in Supplementary Figure S3. Removing the life table adjustment on mean estimated survival for liver (US: 21.80 years; UK: 20.42 years), heart (US: 14.82 years; UK: 15.85 years) and lung transplants (US: 9.43 years; UK: 9.23 years) had minimal to no impact (range = 0–0.90 years) due to the older mean ages at transplant and shorter survival after transplants. Since kidney transplant recipients are younger, with the ability to go on dialysis if the graft fails, removing the life table adjustments (US: 24.07 years; UK: 27.37 years) impacted the estimates by 0.79–1.28 years.
Discussion
The methodology and extrapolation reported in this study estimated the mean survival for SOTs by organ type and country, utilizing registry data from the US and UK. Since simple parametric models were not a good fit, flexible cubic splines and hazard scales were used to calculate survival estimates. Many SOT recipients had substantial mean lifetime survival after transplant. The longest mean overall survival was seen in kidney transplants, with ∼23 years in the US and ∼27 years in the UK. In both countries, the shortest mean survival estimates were in lung transplants, with ∼9 years after SOT.
Small differences in mean overall survival were seen between the UK and the US. The largest country difference was seen in kidney survival, where UK transplant recipients were estimated to survive an additional 3.79 years compared with US recipients. These country-specific differences are likely related to the characteristics of the transplant recipients; in the UK, a large proportion of the SOT population was under 30 years of age at the time of the SOT, while in the US there was a disproportionate amount of patients in the >60 age group (where outcomes may be less positive than other age groups and survival will be shorter). Quality of organs transplanted may be an impacting factor on survival estimates as well. The percentage of kidney transplants from deceased donors are similar between the two countries (72%)Citation7,Citation20; however, other patient-specific quality factors (younger age, less time on dialysis and immunosuppression regimen) can increase kidney transplant survival, which may explain the observed increase in the UK.
The knot positions in the base-case analysis were agreed on by a clinical expert, based on where hazards changed direction and opinion of whether changes were clinically appropriate or artifacts of the hazard estimation; this may result in slight differences between the base case knot locations and initial changes in direction of the hazard plots. The clinical expert identified three time periods as clinically important periods in SOT survival: short-term, mid-term, and long-term survival. To examine the importance of long-term changes in the hazards, we conducted a sensitivity analysis using only the first two knots and assumed that there was no change in the underlying distributions from mid- to long-term survival. Overall, the sensitivity analysis showed small differences in mean estimated survival in lung and heart transplants across both countries; however, larger differences were observed in US and UK liver transplants, with UK liver transplants exhibiting the largest difference, a near 5-year increase in survival compared with the base-case analysis. Despite the increased survival seen in some SOTs, the three-knot scale represents a more conservative estimate of SOT survival compared with the two-knot estimate, as it accounts for changes in survival in the long-term and not just the short-term. The change in the underlying distribution is particularly noticeable in liver and kidney SOTs, where there is a higher percentage of patients still alive at the end of follow-up.
Both the base-case and sensitivity analyses mean survival estimates reported here are substantially higher than the median lifetime survivals reported in previous literature, since mean survival estimates allow for the inclusion of the tail end distributions and outlier patients that are not accounted for with medians. In a recent registry study, median survival following kidney transplantation in the US and UK was reported as 11.2 and 14.7 years, respectivelyCitation21. Another US registry study reported median liver and heart transplant survivals of 11.6 and 9.5 years, respectivelyCitation22. An international registry from 2019 reported that adult lung transplant median survival was 4.8 years, while the survival of pediatric recipients was 5.7 years, reflecting the low survival of these recipients in the present studyCitation23,Citation24. Thus, the difference between the base-case-extrapolated mean survival in this study and the reported median survival from registries ranges from an additional ∼4–12 years, depending on the type of SOT. Recently, the United States Renal Data System (USRDS) registry estimated the expected remaining lifetime of pediatric and young adult end-stage renal disease patients using a conditional piecewise exponential survival and a constant death rate within each age group. The expected remaining lifetime ranged from 57.7 years in the 0–4 age group to 42.3 years for the 18–21 age group, which are closer to the mean lifetime survival reported in this study when adjusting for age (22.79 years in the US and 26.58 years in the UK for kidney)Citation25,Citation26. Other estimates exist in the literature, such as the SRTR annual data reports (ADRs) for SOTs, which report on the percentage survival up to 5-years post-transplantCitation20,Citation27–29. These are valuable estimates for monitoring graft survival and quality; however, they do not capture the survival of the graft recipient over their lifetime. Graft survival can be low in the first years following transplant, due to reasons such as graft rejection, type of donor, quality of organ, etc, but that is not always representative of recipient survival, especially long-term. Therefore, it is important to examine lifetime survival to understand the full impact of organ transplant on an SOT recipient. Since the current study used all available SRTR data sets, the SRTR ADRs can be used in tandem with this study to give a greater understanding of short-term and lifetime transplant survival, which is particularly useful in complex transplant populations where survival may be influenced by a range of factors.
The mean lifetime SOT survivals estimated in our study are likely to be closer to the real lifetime survival of SOT recipients than the survival estimates from registry data. Our analysis fitted to available data and extrapolated end of life based on hazard rates. In contrast, lifetime survival in the literature is frequently extrapolated based on the deaths that occur within registries, which in SOT populations disproportionately represent older transplant recipients, and may not be representative of the entire population. Lifetime survival analyses often focus on estimating median survival, which is unsuitable for populations with frequent outliers, such as the SOT population. Estimating lifetime survival in this way also results in the estimate being based on patients who received transplants up to 20 years ago, without reflecting current clinical practice or adjustments to reflect improvements in survival over timeCitation30. For these reasons, mean lifetime survival estimates may be preferred over medians when looking at overall populations, as they are more representative of the broader transplant population.
This study has certain limitations. The data used spanned from 1990 to 2018, to minimize extrapolation and provide the most mature data possible – the registry datasets used contained 20–25 years of follow-up vs up to 5–10 years survival follow-up in more typical reports of registry datasets. Consequently, changes in transplant techniques and immunosuppression over time may cause survival to be underestimated in this study. This study was based on the full transplant recipient population and does not provide results on an individual patient basis; while some patients may be outliers and live longer, some may die quickly, depending on a variety of factors. The analysis was conducted on the aggregate population and did not examine the differences in survival between age groups – younger patients may have better survival outcomes compared with older patients. Multiple-organ transplants were excluded in this analysis and therefore our survival estimates are only applicable to those who have received single SOTs. The examined registry data and survival analysis do not assess factors that may impact lifetime survival, e.g. information on treatments the patients received (including immunosuppression), patients’ comorbidities, diseases following transplant, changes in treatments, time on the waiting list, etc. As these data were not reported in the registries, our analysis was not able to factor in any impact they may have on lifetime survival estimates: further studies are needed to examine these factors and understand the key drivers influencing lifetime survival estimates. In addition, the present analysis did not include the life of the transplanted organ into the survival estimations; therefore, survival may be underestimated in certain SOT populations and overestimated in others.
In conclusion, the mean overall survival estimates in this study are reported by the most common SOT organ type (kidney, liver, heart, and lung) and for the US and UK. The estimates in this study show substantially higher mean lifetime survival of kidney, liver, heart, and lung recipients compared with those previously reported in registries. The methods used in this analysis serve as a valuable alternative to those used in current practice for extrapolating lifetime survival in SOT patients. The lifetime survival projections following SOT estimated by this analysis can be used as alternatives by decision-makers in situations where means are preferred over medians (e.g. population projections, budgetary estimates, and cost-effectiveness models).
Transparency
Declaration of funding
This study was funded by Atara Biotherapeutics, Inc.
Declaration of financial/other interests
CNG is an employee of RTI Health Solutions who receives funding from pharmaceutical, biotechnology, and medical devices companies to conduct health economics and outcomes research.
CW and AB are employees and stockholders of Atara Biotherapeutics.
MS was part of the manuscript advisory board run by Atara.
VRD declares no conflicts of interest.
Peer reviewers on this manuscript have no relevant financial or other relationships to disclose.
Poster presentations
Graham C, Skeans M, Ahn Y, Watson C, Barlev A. Lifetime Survival Estimates Following Solid Organ Transplantation in the United States. Am J Transplant. 2020;20(Suppl 3) abstract C-208.
Graham C, Watson C, Barlev A. Lifetime survival projections following solid organ transplantation in the United Kingdom. BTS Annual Congress. ICC Belfast, Northern Ireland, 4–6 March 2020; abstract P55.
Data disclaimers
The data reported here have been supplied by the Hennepin Healthcare Research Institute (HHRI) as the contractor for the Scientific Registry of Transplant Recipients (SRTR). The interpretation and reporting of these data are the responsibility of the author(s) and in no way should be seen as an official policy of or interpretation by the SRTR or the US Government.
Supplemental Material
Download MS Word (595.1 KB)Acknowledgements
Medical writing assistance was provided by Manca Povsic, PhD, and Max Harris, of AMICULUM, funded by Atara Biotherapeutics. Data collection was conducted by Melissa Skeans, MS and Yoon Son Ahn, MS at the Chronic Disease Research Group of the Hennepin Healthcare Research Institute. The authors are grateful to all the transplant centers in the US and UK who contributed data on which this article is based.
Data availability statement
The data that support the findings of this study are available from the SRTR and UKTR registries. Restrictions apply to the availability of these data, which were used under license for this study. Data are available from https://www.srtr.org/requesting-srtr-data/data-requests/ and https://www.odt.nhs.uk/statistics-and-reports/access-data/ with permissions of the SRTR and UKTR, respectively. All analyzed data are included in this manuscript.
References
- Barker C, Markmann J. Historical overview of transplantation. Cold Spring Harb Perspect Med. 2013;3(4):a014977.
- NHS Blood and Transplant. A history of donation, transfusion and transplantation; 2020 [cited 2021 November]. Available from: https://www.nhsbt.nhs.uk/who-we-are/a-history-of-donation-transfusion-and-transplantation/.
- Black CK, Termanini KM, Aguirre O, et al. Solid organ transplantation in the 21st century. Ann Transl Med. 2018;6(20):409.
- Global Observatory on Donation and Transplantation. International report on organ donation and transplantation activities: executive summary; 2021 [cited 2021 November]. Available from: http://www.transplant-observatory.org/wp-content/uploads/2021/06/GODT2019-data_web_updated-June-2021.pdf.
- Arshad A, Anderson B, Sharif A. Comparison of organ donation and transplantation rates between opt-out and opt-in systems. Kidney Int. 2019;95(6):1453–1460.
- Organ Procurement and Transplant Network. National data by transplant donor type; 2020 [cited 2021 November]. Available from: https://optn.transplant.hrsa.gov/data/view-data-reports/national-data/.
- NHS Blood and Transplant. Organ donation and transplantation activity report 2019/20; 2020 [cited 2021 November]. Available from: https://nhsbtdbe.blob.core.windows.net/umbraco-assets-corp/19220/activity-report-2019-2020.pdf.
- NHS Blood and Transplant. Highest number of organ transplants ever across UK, but many families still say no to donation;2016 [cited 2021 November]. Available from: https://www.organdonation.nhs.uk/get-involved/news/highest-number-of-organ-transplants-ever-across-uk/.
- Hamidi O, Poorolajal J, Farhadian M, et al. Identifying important risk factors for survival in kidney graft failure patients using random survival forests. Iran J Public Health. 2016;45(1):27–33.
- Kim J, Marks S. Long-term outcomes of children after solid organ transplantation. Clinics. 2014;69(Suppl 1):28–38.
- Lee S, Yoo KD, An JN, et al. Factors affecting mortality during the waiting time for kidney transplantation: a nationwide population-based cohort study using the Korean Network for Organ Sharing (KONOS) database. PLOS One. 2019;14(4):e0212748.
- Rana A, Godfrey E. Outcomes in solid-organ transplantation: success and stagnation. Tex Heart Inst J. 2019;46(1):75–76.
- Latimer N. NICE DSU technical support document 14: survival analysis for economic evaluations alongside clinical trials - extrapolation with patient-level data. UK: School of Health and Related Research, University of Sheffield; 2011. p. 1–52.
- Latimer N. Survival analysis for economic evaluations alongside clinical trials-extrapolation with patient-level data: inconsistencies, limitations, and a practical guide. Med Decis Making. 2013;33(6):743–754.
- Royston P, Parmar M. Flexible parametric proportional-hazards and proportional-odds models for censored survival data, with application to prognostic modelling and estimation of treatment effects. Stat Med. 2002;21(15):2175–2197.
- Rutherford M, Lambert P, Sweeting M, et al. NICE DSU technical support document 21: flexible methods for survival analysis. Leicester, UK: Department of Health Sciences, University of Leicester; Stockholm, Sweden: Department of Medical Epidemiology and Biostatistics, Karolinska Institutet; Sheffield, UK: School of Health and Related Research, University of Sheffield; 2020. p. 1–97.
- Jackson C, Stevens J, Ren S, et al. Extrapolating survival from randomized trials using external data: a review of methods. Med Decis Making. 2017;37(4):377–390.
- National Center for Health Statistics. National vital statistics system: life expectancy; 2020 [cited 2021 November]. Available from: https://www.cdc.gov/nchs/nvss/life-expectancy.htm.
- Office for National Statistics. National life tables: UK; 2020 [cited 2021 November]. Available from: https://www.ons.gov.uk/peoplepopulationandcommunity/birthsdeathsandmarriages/lifeexpectancies/datasets/nationallifetablesunitedkingdomreferencetables.
- Hart A, Lentine K, Smith J, et al. OPTN/SRTR 2019 annual data report: Kidney. Scientific Regist Transpl Recip. 2019;21:1–117.
- Merion R, Goodrich N, Johnson R, et al. Kidney transplant graft outcomes in 379 257 recipients on 3 continents. Am J Transplant. 2018;18(8):1914–1923.
- Rana A, Gruessner A, Agopian V, et al. Survival benefit of solid-organ transplant in the United States. JAMA Surg. 2015;150(3):252–259.
- International Society for Heart and Lung Transplantation. Adult heart transplantation statistics; 2019 [cited 2021 November]. Available from: https://ishltregistries.org/registries/slides.asp?yearToDisplay=2019.
- International Society for Heart and Lung Transplantation. Pediatric lung transplantation statistics; 2019 [cited 2021 November]. Available from: https://ishltregistries.org/registries/slides.asp?yearToDisplay=2019.
- US Renal Data System. 2018 Annual data report: volume 2: ESRD in the United States, 1–412; 2018 [cited 2021 November]. Available from: https://www.usrds.org/media/2283/2018_volume_2_esrd_in_the_us.pdf.
- US Renal Data System. Volume 2. ESRD analytical methods, 1–70; 2018 [cited 2021 November]; Available from: https://www.usrds.org/media/1739/v2_c13_esrdmethods_18_usrds.pdf.
- Colvin M, Smith JM, Ahn Y, et al. OPTN/SRTR 2019 annual data report: heart. Am J Transplant. 2021;21(S2):356–440.
- Kwong AJ, Kim WR, Lake JR, et al. OPTN/SRTR 2019 annual data report: Liver. Am J Transplant. 2021;21(S2):208–315.
- Valapour M, Lehr CJ, Skeans MA, et al. OPTN/SRTR 2019 annual data report: lung. Am J Transplant. 2021;21(S2):441–520.
- Li B, Cairns J, Robb M, et al. Predicting patient survival after deceased donor kidney transplantation using flexible parametric modelling. BMC Nephrol. 2016;17(1):51.