
Abstract
Aims
This retrospective analysis of the Optum Clinformatics Data Mart database evaluated US patient characteristics, healthcare resource utilization (HCRU), costs, and treatment patterns among unvaccinated adults with outpatient-diagnosed COVID-19 to quantify US economic burden.
Materials and methods
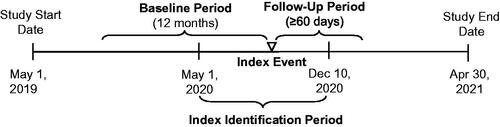
The index event was the earliest outpatient diagnosis of confirmed COVID-19 from May 1 to December 10, 2020. Patients had 12 months’ continuous enrollment before and were followed for ≥60 days after index date until insurance dis-enrollment or study end.
Results
236,589 patients had outpatient-diagnosed COVID-19 (7,692 with and 228,897 without subsequent COVID-19-related inpatient admission >48 h post-diagnosis). The median age was 51 years (≥65 years, 30.0%); 72.4% had ≥1 risk factor. Patients with versus without subsequent inpatient admission were more often male, older, Black/Hispanic, and had comorbidities/risk factors. With a median follow-up of 162 days, patients had a median of 1 COVID-19-related outpatient visit (with inpatient admission, 5 outpatient visits). Those with inpatient admission had a median of 1 COVID-19-related inpatient visit (median length of stay [LOS], 6 days), 33.3% were admitted to intensive care (median LOS, 8 days), 8.4%, 7.1%, and 13.3% received invasive mechanical ventilation, noninvasive mechanical ventilation, and supplemental oxygen, respectively; 13.5% experienced readmission. Inpatient mortality was 6.0% (0.3% for nonhospitalized patients). Antithrombotic therapy, antibiotics, corticosteroids, and remdesivir use increased among patients with inpatient admission versus without. Median total COVID-19-related non-zero medical costs were $208 for patients without inpatient admission (with inpatient admission, $39,187).
Limitations
Results reflect the circulating SARS-CoV-2 and treatment landscape during the study period. Requirements for continuous enrollment could have biased the population. Cost measurements may have included allowed (typically higher) and charge amounts.
Conclusions
Given the numbers of the US population who are still not fully vaccinated and the evolving epidemiology of the pandemic, this study provides relevant insights on real-world treatment patterns, HCRU, and the cost burden of outpatient-diagnosed COVID-19.
Introduction
Coronavirus disease 2019 (COVID-19) is caused by the novel severe acute respiratory syndrome coronavirus 2 (SARS-CoV-2). The disease was first reported to the World Health Organization at the end of 2019 and spread globally within a few monthsCitation1. The Centers for Disease Control and Prevention (CDC) reported the first case of COVID-19 in the United States on January 21, 2020Citation2. As of December 15, 2021, more than 50.3 million cases and 799,850 deaths have been reported in the United StatesCitation3.
The clinical presentation of COVID-19 ranges from asymptomatic infection to critical illness requiring intensive careCitation4. Most cases are asymptomatic or mild, with approximately 7% requiring hospitalization as of December 15, 2021Citation5. Nonhospitalized adult patients can be managed largely with supportive careCitation6. SARS-CoV-2 antivirals and anti–SARS-CoV-2 monoclonal antibody products have received emergency use authorization (EUA) for nonhospitalized patients at high risk of disease progression (defined by EUA criteria)Citation4,Citation7,Citation8.
A majority of the research on patient characteristics, clinical outcomes, healthcare resource utilization (HCRU), and costs have focused on individuals hospitalized for COVID-19Citation9–18. A publication on the health outcomes and economic burden among patients hospitalized for COVID-19 in the United States using the Premier Healthcare COVID-19 databaseCitation18 reported that of 173,942 patients hospitalized for COVID-19 from April to October 2020, 22% were admitted to the intensive care unit (ICU) and 17% received IMV. The median hospital length of stay (LOS) was 5 days, in-hospital mortality was 14%, median hospital charges were $43,986, and median costs were $12,046, all of which increased with ICU admission, IMV use, and ageCitation18.
Much less is known about outcomes, HCRU, and economic burden among patients diagnosed with COVID-19 in outpatient settings. Studies have shown that approximately 10% of these patients had a COVID-related urgent medical or emergency department (ED) visit, and 4% to 8% were hospitalized within 30 days of diagnosisCitation19,Citation20. Even patients with mild to moderate infection may have persistent symptomsCitation21–25, and infection may exacerbate underlying chronic medical conditions, thus further impacting HCRUCitation26,Citation27. Currently, few if any studies addressing the economic burden of COVID-19 diagnosed in outpatient settings or that differentiate between HCRU in the acute versus post-acute phases of the disease have been published. With the rapidly evolving pandemic landscape, for example, preliminary reports of the Omicron variant point to a less severe infectionCitation28, the outpatient burden continues to be relevant.
This retrospective analysis of real-world data complements existing studies conducted in the outpatientCitation29 and inpatient settingsCitation18 by evaluating HCRU and costs among unvaccinated patients diagnosed with COVID-19 in the outpatient setting, to quantify the economic burden of disease in the United States.
Methods
Study design and data source
This study is a descriptive retrospective analysis that used the Optum Clinformatics Data Mart (CDM) database to evaluate patient characteristics, HCRU, costs, and treatment patterns among unvaccinated adults with a confirmed outpatient diagnosis of COVID-19. The Optum CDM database includes deidentified patient-level information derived from a database of administrative health claims for members of large commercial and Medicare Advantage health plans submitted for all medical and pharmacy healthcare services with information related to healthcare costs and resource utilization. The population is geographically diverse, spanning all 50 states.
This study was deemed exempt from Institutional Review Board (IRB) review pursuant to the terms of the US Department of Health and Human Service's Policy for Protection of Human Research Subjects at 45 C.F.R. 46.104(d); category 4 exemption (Sterling IRB, Boston, Massachusetts waived ethical approval for this work).
The index event was defined as the earliest outpatient diagnosis of confirmed COVID-19 during the index identification, with the corresponding service end date as the index date. The outpatient diagnosis was defined as a diagnosis made during any outpatient healthcare visit (e.g. physician office, ED, outpatient clinic), as opposed to during an inpatient hospital admission.
Study population
Adults (≥18 years old) were included if they had a primary or secondary International Classification of Diseases, Tenth Revision, Clinical Modification (ICD–10–CM) diagnosis code for COVID-19 (U07.1) in a claim for an outpatient encounter between May 1, 2020, and December 10, 2020. This cutoff date was selected based on the EUA date for the first COVID-19 vaccine (December 11, 2020); patients would not have been vaccinated during this timeframe. Patients were required to have 12 months of continuous healthcare enrollment before the index date (baseline period) and ≥60 days of continuous healthcare enrollment after the index date (follow-up period). The follow-up period varied by patient, began after the index date, and continued until insurance dis-enrollment, or the end of the study period, whichever was earliest (). Monthly gaps were allowed for calculating continuous enrollment (months with ≥1 enrolled day are treated as wholly covered when determining continuous intervals, but the ends of the newly formed intervals reflect the actual start and end dates). Patients were excluded if they were <18 years old at the index date; had any COVID-19 diagnoses within 30 days before the index date (washout period); were admitted to a hospital for COVID-19 within 48 h of their diagnosis in the outpatient setting (i.e. considered to have severe disease at diagnosis); were admitted into a skilled nursing facility, hospice, or inpatient rehabilitation facility during the baseline or follow-up period; or had <60 days of available follow-up time. Patients were stratified by baseline risk of severe COVID-19 infection (higher risk vs standard risk) and age at index date (18–29 vs 30–49 vs 50–64 vs 65–74 vs ≥75 years).
Figure 1. Study scheme. The follow-up period varied by patient, began after the index date, and continued until insurance dis-enrollment, or the end of the study period, whichever was earliest.
Higher risk subgroup
The higher risk subgroup included patients with ≥1 characteristic or underlying medical condition associated with an increased risk of developing severe illness from COVID-19 as defined by the CDC (May 13, 2021)Citation30 and assessed during the 12 months before the index date: ≥65 years of age (age was assessed on the index date), history of cancer, chronic kidney disease, chronic lung diseases, dementia or other neurologic conditions, diabetes (type 1 or type 2), Down syndrome, cardiovascular disease, HIV infection, hypertension, immune deficiencies/immunocompromised state, liver disease, obesity, pregnancy and recent pregnancy, sickle cell disease or thalassemia, smoking (current or former), solid organ or blood stem cell transplant, stroke or cerebrovascular disease, and substance use disorders. To define these 18 conditions, sentinel code listsCitation31 were used where available and refined to align with the CDC criteria for each condition. All codes were reviewed by sponsor personnel with medical and epidemiological expertise (FD, JA, NB), and discrepancies were resolved by consensus. To be included in this subset, patients needed a diagnosis code (ICD-10-CM) procedure code (ICD-10-PCS, CPT, HCPCS) or drug code (NDC) for ≥1 of the 18 conditions in the 12 months before COVID-19 diagnosis (the index event) or ≥65 years of age on the index date.
Study objectives
The primary objective was to assess clinical and demographic characteristics, HCRU and associated costs, and treatment patterns among patients diagnosed with COVID-19 in outpatient settings. The secondary objective was to assess the primary objective measures with further stratification by key patient characteristics.
Study outcomes/variables
Patient demographics were assessed during the index event and included age, sex, geographic region, payer type, index event point of service, and index event date (year and month). Comorbidities and risk factors of severe COVID-19 were evaluated during the baseline period and follow-up period (index event combined with follow-up period). Variables associated with HCRU and cost included those associated with outpatient encounters, hospitalizations, ICU use, ventilation, costs, provider specialty, and COVID-19 tests (Supplementary Table 1). All-cause and COVID-related HCRU and costs were evaluated during the index event/follow-up period (index event combined with follow-up period) and included all claims with COVID-19 as either a primary or secondary diagnosis code. Cost is modeled by Optum and not taken directly from claims. The standard cost variable was used because it estimated the allowed amount paid to providers. The non-zero cost was where the standard cost was >0; if a patient only had costs = 0, then that patient was excluded from that cost analysis. Time to the first COVID-related hospitalization, readmissions any time after the COVID-19 inpatient discharge date as well as readmission within 30 days of the index event, and outpatient visits (e.g. ED, urgent care) were determined during the follow-up period. Treatment variables included those associated with COVID-19 tests, ICU admission, treatments provided during admission, and discharge status (Supplementary Table 1). COVID-19 treatment-related patterns and 30-day mortality were evaluated during the index event and follow-up period. The number of COVID-19 tests performed during follow-up and in the first 30 days following the index event was also evaluated. Progression to outcomes of interest was evaluated overall and during specific periods following diagnosis (3–7, 8–14, 15–21, and ≥22 days). All COVID-coded visits had a confirmed COVID diagnosis code on the claim. Mortality data were recorded as month and year; exact day calculation could not be performed.
The mortality data are sourced from a reputable third-party source that includes public and private obituary data. Optum death data (MM/YYYY) within the CDM are deterministically linked using personal identifiable information (PII) to ensure an accurate match with our patient population. A variety of PII exists to provide an accurate match regardless of social security number, including but not limited to, first and last name, date of birth, and the social security number. Death dates linked to social security numbers are flagged accordingly.
Death data were refreshed monthly to integrate the most recently reported deaths into the data, retroactive to 2007, and a complete restatement of death data was available in each quarterly delivery. Optum continually quality checks the data to ensure an accurate match at the patient level with available death information. However, death data may be depressed if there is a contributing source not able to capture the death data (e.g. patient fall off) or due to the extended lag on the Social Security Administration death master file. Although the absence of a death month and year do not indicate the member is living, when business parameters (e.g. claims runout) are applied to the research, there is a high probability that the member is still living.
Data analysis
Descriptive statistics were used to summarize patient demographic and clinical characteristics, HCRU and costs, and COVID-related treatment patterns. Counts and percentages were reported for categorical variables. Continuous variables were summarized using means, standard deviations, medians, and Q1 and Q3 quartiles. Stratified analyses were generated to assess the relationship between patients diagnosed in an outpatient setting, patients at higher risk of progressing to severe COVID, and the outcomes of interest while preserving the descriptive nature of the analysis. Data were also stratified by follow-up time period (3–7, 8–14, 15–21, and ≥22 days) and age at index date (18–29 vs 30–49 vs 50–64 vs 65–74 vs ≥75 years).
Supportive analyses
A sensitivity analysis was performed using the proportion of patients who were alive after 30 days after the index date. The patient selection criteria for the sensitivity population were otherwise the same as the default study population. All other study measurements, including index event and study period definitions for the primary study analysis, were employed for the sensitivity analysis as well. The sensitivity analysis included both primary and secondary objective measures, and the follow-up time periods used for analysis were 3–7, 8–14, 15–21, and ≥22 days.
Results
Study population
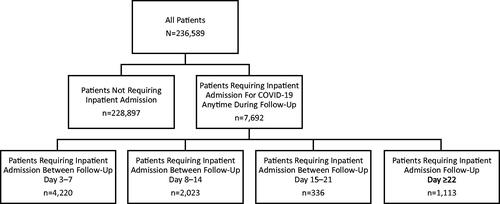
Of the 18,432,067 individuals in the Optum CDM database from May 1, 2020, to December 10, 2020, 236,589 (1.28%) met the inclusion criteria for this analysis ().
Figure 2. Patient disposition. COVID-19, coronavirus disease 2019.
Patient demographic and baseline clinical characteristics
Among the overall outpatient population, the median age was 51 years and 30.0% of patients were ≥65 years (). Most patients were women and White. The most prevalent comorbidities were gastrointestinal (GI) conditions, obesity, and chronic lung diseases; 72.4% of patients had ≥1 characteristic or underlying medical condition associated with a higher COVID-19 risk, the most common being immune deficiencies/immunocompromised state, hypertension, and age ≥65 years ().
Table 1. Patient demographic and baseline clinical characteristics.
Among patients who did not require later COVID-related inpatient hospital admission, the median age was 50 years, and 29.0% of patients were ≥65 years (). Most patients were women and White. The most prevalent comorbidities were GI conditions, obesity, and chronic lung diseases; 71.7% of patients had ≥1 characteristic or underlying medical condition associated with a higher COVID-19 risk, the most common being immune deficiencies/immunocompromised state, hypertension, and age ≥65 years ().
Most patients who later required COVID-related inpatient hospital admission were men older than 65 years and had Medicare. The proportions of Black and Hispanic patients were slightly higher in the hospitalized group compared with the nonhospitalized group, as were the proportions of patients who had comorbidities at baseline, notably GI conditions, obesity, chronic lung diseases, and chronic obstructive pulmonary disease (COPD). The proportions of patients who had GI conditions, chronic lung diseases, and COPD were higher still in patients who were admitted ≥22 days after outpatient diagnosis than in those who did not require admission for COVID. The proportion of patients with a higher risk of severe COVID-19 was also higher among hospitalized patients compared with patients who did not require admission for COVID (Supplementary Table 2).
COVID-19 testing patterns
At baseline, COVID-19 tests were documented in 38.3% of patients in this analysis overall, 38.4% of patients without inpatient hospital admission for COVID-19 anytime in follow-up, and 35.2% of those with inpatient admission for COVID-19 (Supplementary Figure 1, Supplementary Table 3). When stratified by age (the inpatient group), the mean numbers of tests documented at baseline ranged from 0.5 to 0.76, decreasing by age (Supplementary Table 4). Results were available in very few patients: 10.3%, 10.4%, and 8.0%, respectively. The median number of days from COVID-19 test result date to outpatient diagnosis (index date) was 17.0 (interquartile range [IQR], 6.0–68.0) days (Supplementary Table 3).
During follow-up, COVID-19 tests were documented in 84.7% of patients overall and without inpatient admission and in 84.9% of those with admission (Supplementary Table 5). When stratified by age (the inpatient group), the mean numbers of tests documented during follow-up ranged from 1.67 to 1.99, generally decreasing by age (Supplementary Table 4). Again, results were available in very few patients: 16.7%, 16.8%, and 14.7%, respectively. Among those who later required inpatient hospital admission, the median number of days from COVID-19 test result date during follow-up to first COVID-19 inpatient visit was 6.0 (IQR, 4.0–9.0) days (Supplementary Table 6).
COVID-19–related HCRU
The median number of COVID-19–related outpatient visits at any time during follow-up (median [IQR] available follow-up data, 162 [132–237] days) was 1 (IQR, 1–2) in both the overall population and patients without COVID-19–related inpatient admissions. Median visit number was also generally 1 across age groups (2 for those aged ≥75 years; Supplemental Table 4) and 5 (IQR, 3–10) among those with COVID-19–related inpatient admissions (median [IQR] available follow-up data, 156 [129–234] days). Very few COVID-related telehealth, urgent care, or noninpatient ED visits were reported (). For reference, the median number of outpatient visits for any reason was 8 (IQR, 4–14) in the overall population, 7 (IQR, 4–15) in patients without COVID-19–related inpatient admissions (and ranged from 5 to 13 by age group, increasing with age; Supplementary Table 4), and 18 (IQR, 10–31) among those with COVID-19–related inpatient admissions. Very few telehealth, urgent care, or inpatient ED visits for any reason were reported (Supplementary Table 7).
Table 2. COVID-19–related outpatient HCRU.
The median number of COVID-19–related outpatient visits during the first 30 days was 1 (IQR, 1–2) in both the overall population and patients without COVID-19–related inpatient admissions (median number of visits was 1 across age groups; Supplementary Table 4) and 3 (IQR, 2–6) among those with COVID-19–related inpatient admissions. The median number of COVID-related noninpatient telehealth, urgent care, or ED visits was 0 (Supplementary Table 8).
The most common specialties of outpatient healthcare providers seen by patients at the index visit in this analysis were family medicine physicians, clinical medical laboratories, emergency medicine physicians, and internal medicine physicians (Supplementary Table 9). The type of provider was unknown for 30,196 patients (12.7%).
Patients who required a COVID-19 inpatient visit had a median of 1 (IQR, 1–1) visit across the entire follow-up time and across all time periods evaluated. Median time from diagnosis is shown in , , and Supplementary Table 2. Median LOS ranged between 5 to 6 days across all time points. Among all patients with inpatient hospital admission at any time, 33.3% were admitted to the ICU, which was consistent across all time periods. Median ICU LOS ranged between 5 to 8 days across all time points (). For reference, the median number of inpatient visits for any reason was 0 (IQR, 0–0) in both the overall population and patients without COVID-19–related inpatient admissions and 1 (IQR, 1–1) among those with COVID-19–related inpatient admissions.
Figure 3. COVID-19–related HCRU among patients with inpatient hospital admission(s). Abbreviations. COVID-19, coronavirus disease 2019; ICU, intensive care unit; LOS, length of stay; Q1, first quartile; Q3, third quartile.
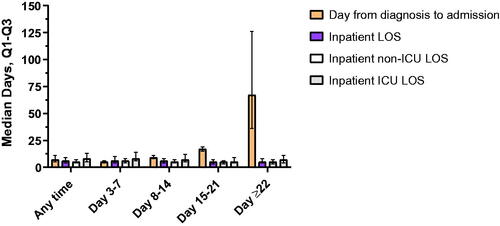
Table 3. COVID-19–related inpatient HCRU.
Invasive mechanical ventilation (including extracorporeal membrane oxygenation) was used in 8.4% of all hospitalized patients and ranged between 5.9% to 10.3% across time points ( and Supplementary Table 4). Noninvasive mechanical ventilation was used in 7.1% of all hospitalized patients and ranged between 5.3% to 7.9% across time points. Supplemental oxygen was used in 13.3% of all hospitalized patients and ranged between 9.8% to 14.3% across time points. The most common discharge status (excluding those discharged to further care) among all hospitalized patients was ‘discharge to home or self-care (routine discharge),’ followed by ‘discharged to home under the care of home health service organization.’ The rate of readmission among all hospitalized patients was 13.5% and ranged between 12.7% to 16.4% across time points. Mortality rates (keeping the limitations as discussed previously in mind) were 0.5% in the overall population, 0.3% among patients without inpatient admission (ranging from 0.01% to 1.81% across age groups, increasing by age; Supplementary Table 4), 6.0% following discharge among all hospitalized patients, and as high as 13.7% among those with inpatient admission ≥22 days after outpatient diagnosis (Supplementary Table 12).
Table 4. COVID-19 treatment characteristics.
Drug usage
Among the overall population, the most frequently used therapies were antibiotics and corticosteroids. The proportions of patients who used antithrombotic therapy, antibiotics, corticosteroids, and remdesivir were higher among patients who required inpatient admission compared with those who did not require admission. These proportions were highest among patients with inpatient admission between 8 to 21 days after diagnosis, with the exception of remdesivir, which was highest among patients with admission 3 to 7 days after diagnosis (Supplementary Table 13). The proportion of patients who were alive after 30 days after the index date generally followed the same pattern of drug usage as their respective overall patient populations (Supplementary Table 14).
Outpatient and inpatient costs associated with COVID-19 infection
Median non-zero standard costs of COVID-19–related outpatient encounters were $199 (IQR, $118–$494) in the overall population (236,431/236,589; 99.9%), $194 (IQR, $118–$438) among patients who did not require inpatient admission (228,741/228,897; 99.9%), and $2,276 (IQR, $618–$4,944) among those who required admission (7,690/7,692; 99.9%; ). Median non-zero standard costs of COVID-19–related inpatient encounters were $36,460 (IQR, $32,891–$38,386) among all patients with inpatient admissions (7,687/228,897; 3.4%). Median standard non-zero costs of COVID-19–related prescriptions were $16 (IQR, $8–$36) among patients without inpatient admissions (79,074/228,897; 34.5%) and $34 (IQR, $13–$313) among patients with inpatient admissions (5,900/7,692; 76.7%). Median total COVID-19–related medical non-zero standard costs (including inpatient and outpatient encounters and prescriptions) were $220 (IQR, $124–$611) among the overall population (236,493/236,589; 99.9%), $208 (IQR, $121–$509) among those without inpatient admissions (228,891/228,897; 99.9%), and $39,187 (IQR, $36,071–$44,994) among those with admissions (7,692/7,692; 100%; ). Non-zero costs for outpatient and inpatient visits for any reason other than COVID-19 tended to be much higher than those only for COVID-19 (Supplementary Table 16). Non-zero costs for the proportion of patients who were alive after 30 days after the index date generally were similar to the primary analysis groups (Supplementary Table 17).
Table 5. COVID-19–related outpatient and inpatient costs.
Clinical characteristics of patients hospitalized and not hospitalized with COVID-19 infection
For all patients and those not requiring an inpatient admission, approximately one-third had hypertension or GI conditions and one-fifth were obese. For those who did require an inpatient admission, 78% (range throughout follow-up, 78%) had hypertension, 66% had GI conditions (range throughout follow-up, 64%–73%), 60% had cardiovascular disease (range throughout follow-up, 58%–70%), and approximately 46% had diabetes (range throughout follow-up, 43%–47%) or were obese (50%; range throughout follow-up, 39%–51%) ( and Supplementary Table 19). For the proportion of patients who were alive after 30 days after the index date, the characteristics followed a similar ranking. However, the percentages of each characteristic were lower in this subpopulation (Supplementary Table 20).
Table 6. Clinical characteristics of patients hospitalized and not hospitalized with COVID-19 infection.
Discussion
This retrospective analysis of the Optum CDM database describes patient characteristics, HCRU, costs, and treatment patterns among unvaccinated adults with a confirmed outpatient COVID-19 diagnosis. The patient population included here was largely similar to that from previously published analyses of patients diagnosed with COVID-19 in outpatient settingsCitation19,Citation20 and to that from the Premier study on hospitalized patientsCitation18, except for the percentage of patients who were White (51.4% vs 77.5% reported by Wei et al.Citation20 and 32.7% reported in the Premier studyCitation18) It is also important to note that the prospective study from the Johns Hopkins Health System included only 118 patientsCitation19. The proportion of patients with COVID-19 risk factors in our analysis was similar to that in the study by Wei et al.Citation20; however, our analysis included a lower percentage with obesity (20.6% vs 43.5%).
The percentage of patients who later required inpatient hospital admission in our analysis (3.3%) was similar to those in the previous analyses (7.6% and 3.8%)Citation19,Citation20. These patients were older, had a higher incidence of key comorbidities or COVID-19 risk factors, and were slightly more often Black or Hispanic compared with those who did not require inpatient admissionCitation19,Citation20. Prospective studies are needed to understand the predictors of outpatient COVID-19 progressing to severe disease.
The median number of outpatient visits was increased among patients with inpatient hospital admissions, and most who were admitted had 1 inpatient visit 7 days after outpatient diagnosis with a LOS of 5 to 6 days, similar to the Premier study (5 days)Citation18. Late inpatient admissions occurred at a median of 67 days after diagnosis. Similar to the hospitalized patients included in the Premier studyCitation18, approximately one-third of admitted patients received ICU care, with a median LOS between 5 to 8 days. IMV and noninvasive mechanical ventilation each were used in <10% of admitted patients, and oxygen supplementation was used in 13% of admitted patients. Among the 128,063 patients in the Premier study who did not require ICU admission or IMV, 31% received supplemental oxygen, 4% received noninvasive ventilation, and 2% utilized a high-flow nasal cannula during their stay. Among the 16,496 who were admitted to the ICU but did not require IMV, 53% received supplemental oxygen, 18% received noninvasive ventilation, and 5% utilized a high-flow nasal cannula during their stayCitation18, although oxygen supplementation was higher than in our analysis. Use of antithrombotic therapy, antibiotics, corticosteroids, and remdesivir increased among patients in our analysis who later required inpatient admission compared with those who did not.
Mortality rates were low in the overall population: 6.0% among hospital-admitted patients and 13.7% among those with late admissions (≥22 days after outpatient diagnosis). Patients in the Premier study had a similar in-hospital mortality rate (13.6%)Citation18.
Median non-zero standard costs of COVID-19–related outpatient encounters in our analysis were $199 in the overall population, and median non-zero standard costs of COVID-19–related inpatient encounters were $30,546 among hospitalized patients. It is important to note that these cost measurements may have included both allowed and charge amounts and pre-adjudicated charge amounts are typically higher than the final reimbursed amount. In the Premier study, median hospital charges were $43,986 and costs were $12,046Citation18. As expected, median costs of COVID-19–related outpatient encounters, prescriptions, and total COVID-19–related medical costs in our analysis were higher in patients who later required inpatient hospital admission compared with those who did not. COVID-19–related inpatient encounters in this analysis are generally 2‒4 times higher than previously published estimates of seasonal influenza hospitalization costs from high-income countriesCitation32–34.
This study evaluated costs associated with COVID-19 diagnosed in outpatient settings using real-world data, and it provides more robust data on patient characteristics, HCRU, and treatment patterns in this unvaccinated patient population. While clinical trials are controlled and not representative of real-world practice, the data used in this study are therefore more representative of factors such as the patient population, patient histories, and prescribing patterns, given the controlled nature of clinical trials. The comprehensive nature of the CDM data allowed for precise determination of COVID-19 risk status during baseline. The CDM data also allowed for the determination of treatment profiles that reflect real-world prescribing practices, to provide an understanding of the real-world treatments used in the management of outpatient COVID-19. The large sample size included in the CDM database provided a robust view of the economic burden and treatment patterns associated with outpatient-diagnosed COVID-19.
The index identification period for this analysis ended before EUA of the first SARS-CoV-2 vaccine on December 11, 2020, thereby excluding any patients who may have received vaccination for this disease, because vaccination status may not be reliably captured in the database (neither insurance coverage nor electronic health record tracking was required during the vaccine rollout).
The first limitation of this analysis is the absence of a comparator group because, in our scientific opinion and modeling experience, we think the data is not yet evolved to the steady state needed to provide clinically meaningful matches (propensity score and other probabilistic methods). These study results reflect the circulating SARS-CoV-2 and treatment landscape present during the study period and may not be applicable to newer variants. The study focused on the first wave of COVID-19, before vaccination in the context of the US healthcare system; COVID-19 impacted different countries at different time points and the patient pathway in other countries is not generalizable to the US patients; we, therefore, have not made direct comparisons with studies from other countries. Patients were included in this analysis if they had a confirmed COVID-19 diagnosis after May 1, 2020, because no specific diagnosis code for COVID-19 existed before April 1, 2020. Clinical trial participation may not be reliably recorded in the data source. The requirement for continuous enrollment, particularly in the post-index period during the pandemic, could have biased the population toward healthier, higher-income patients because they would likely have been less impacted by the increased unemployment (and consequent loss of health insurance) during the pandemic. Several limitations of this analysis are associated with the nature of the claims database (e.g. incomplete medical histories, virtual visits/telephone/email-based healthcare encounters not captured, inpatient pharmacy claims not captured, billing/coding errors that would not have been identified because the deidentified records do not allow for validation). Medicaid, VA and uninsured patients are not cited by the vendor as being included in the Optum CDM database. Testing data in this database were incomplete; therefore, we expect the measured testing patterns in our analysis to be underestimated. An additional limitation was that a confirmed COVID ICD code did not require a positive laboratory test. Also, it was possible that the testing results were received after the COVID diagnosis code was entered, as the testing landscape in the United States at the time of data collection was experiencing slow turnaround times. As mentioned earlier, cost measurements may have included both allowed and charge amounts. Additionally, indirect costs associated with COVID-19 infection were not available. There are other societal costs related to the overall burden that was not captured in this analysis, including items such as loss of productivity, which would be expected to be substantial in the outpatient-only group as most were within the working-age range of 18–64 years. Finally, mortality data were reported monthly; therefore, the exact dates of death are unknown.
Conclusions
The results of this retrospective claims database study complement previous analyses of hospitalized patients and patients diagnosed in the outpatient setting and provide relevant insights into the real-world treatment patterns, HCRU, and cost burden of outpatient-diagnosed COVID-19. Given the numbers of the US population who are still not fully vaccinated, and the evolving epidemiology of the pandemic, such as the potential lesser severity of the Omicron variantCitation28, more research is needed to evaluate HCRU and cost in the acute and post-acuteCitation35 phases of COVID-19 for this outpatient-diagnosed patient population.
Transparency
Declaration of funding
This work was supported by Pfizer Inc.
Declaration of financial/other interests
All authors are employees of Pfizer Inc and may hold stock or stock options.
Peer reviewers on this manuscript have received an honorarium from JME for their review work but have no other relevant financial relationships to disclose.
Author contributions
All authors were involved in the conception and design or analysis and interpretation of the data, the drafting of the paper or revising it critically for intellectual content, and the final approval of the version to be published. All authors agree to be accountable for all aspects of the work.
Supplemental Material
Download MS Word (283.6 KB)Acknowledgements
The authors thank Manuela di Fusco, Michael Benigno, Jennifer Nguyen, Joanna Atkinson, and Wajeeha Ansari, of Pfizer Inc, for their support in the study design and their contributions to this paper. Programming support and expertise were provided by Ewa Śleszyńska-Dopiera (Quanticate) and Ziphora Sam of Eliassen Group (Somerset, NJ). This study was sponsored by Pfizer Inc. Editorial/medical writing support was provided by Erin O’Keefe, PhD, and Rozena Varghese, PharmD, CMPP, of ICON plc (Blue Bell, PA), and was funded by Pfizer Inc.
Data availability statement
The data that support the findings of this study are available from the corresponding author, AMS, upon reasonable request.
References
- World Health Organization. Timeline: WHO's COVID-19 Response. [cited 2022 February 9]. Available from: https://www.who.int/emergencies/diseases/novel-coronavirus-2019/interactive-timeline#.
- Centers for Disease Control and Prevention. First Travel-Related Case of 2019 Novel Coronavirus Detected in United States. 2020. [cited 2022 February 9]. Available from: https://www.cdc.gov/media/releases/2020/p0121-novel-coronavirus-travel-case.html.
- Centers for Disease Control and Prevention. United States COVID-19 Cases, Deaths, and Laboratory Testing (NAATs) by State, Territory, and Jurisdiction. 2021. [cited 2021 December 15]. Available from: https://covid.cdc.gov/covid-data-tracker/#cases_totalcases.
- National Institutes of Health. Clinical Management Summary. 2021. [cited 2022 January 19]. Available from: https://www.covid19treatmentguidelines.nih.gov/management/clinical-management/clinical-management-summary/.
- Centers for Disease Control and Prevention. COVID Data Tracker. 2021. [cited 2021 December 15]. Available from: https://covid.cdc.gov/covid-data-tracker/#new-hospital-admissions.
- National Institutes of Health. General Management of Nonhospitalized patients with acute COVID-19. 2021. [cited 2021 September 27]. Available from: https://www.covid19treatmentguidelines.nih.gov/management/clinical-management/nonhospitalized-patients–general-management/.
- US Food and Drug Administration. Coronavirus (COVID-19) update: FDA authorizes first oral antiviral for treatment of COVID-19. 2021. [cited 2022 February 9]. Available from: https://www.fda.gov/news-events/press-announcements/coronavirus-covid-19-update-fda-authorizes-first-oral-antiviral-treatment-covid-19.
- US Food and Drug Administration. Coronavirus (COVID-19) Update: FDA Authorizes Additional Oral Antiviral for Treatment of COVID-19 in Certain Adults. 2021. [cited 2022 February 9]. Available from: https://www.fda.gov/news-events/press-announcements/coronavirus-covid-19-update-fda-authorizes-additional-oral-antiviral-treatment-covid-19-certain.
- Petrilli CM, Jones SA, Yang J, et al. Factors associated with hospital admission and critical illness among 5279 people with coronavirus disease 2019 in New York City: prospective cohort study. BMJ. 2020;369:m1966.
- Stokes EK, Zambrano LD, Anderson KN, et al. Coronavirus disease 2019 case surveillance – United States, January 22-May 30, 2020. MMWR Morb Mortal Wkly Rep. 2020;69(24):759–765.
- Lavery AM, Preston LE, Ko JY, et al. Characteristics of hospitalized COVID-19 patients discharged and experiencing same-hospital readmission — United States, March–August 2020. MMWR Morb Mortal Wkly Rep. 2020;69(45):1695–1699.
- Cunningham JW, Vaduganathan M, Claggett BL, et al. Clinical outcomes in young US adults hospitalized with COVID-19. JAMA Intern Med. 2021;181(3):379–381.
- Rosenthal N, Cao Z, Gundrum J, et al. Risk factors associated with in-hospital mortality in a US national sample of patients with COVID-19. JAMA Netw Open. 2020;3(12):e2029058.
- Ioannou GN, Locke E, Green P, et al. Risk factors for hospitalization, mechanical ventilation, or death among 10131 US veterans with SARS-CoV-2 infection. JAMA Netw Open. 2020;3(9):e2022310.
- Lin KJ, Schneeweiss S, Tesfaye H, et al. Pharmacotherapy for hospitalized patients with COVID-19: treatment patterns by disease severity. Drugs. 2020;80(18):1961–1972.
- Nguyen NT, Chinn J, Nahmias J, et al. Outcomes and mortality among adults hospitalized with COVID-19 at US medical centers. JAMA Netw Open. 2021;4(3):e210417.
- Best JH, Kong AM, Kaplan-Lewis E, et al. Treatment patterns in US patients hospitalized with COVID-19 and pulmonary involvement. J Med Virol. 2021;93(9):5367–5375.
- Di Fusco M, Shea KM, Lin J, et al. Health outcomes and economic burden of hospitalized COVID-19 patients in the United States. J Med Econ. 2021;24(1):308–317.
- Blair PW, Brown DM, Jang M, et al. The clinical course of COVID-19 in the outpatient setting: a prospective cohort study. Open Forum Infect Dis. 2021;8(2):ofab007.
- Wei W, Sivapalasingam S, Mellis S, et al. A retrospective study of COVID-19-related urgent medical visits and hospitalizations after outpatient COVID-19 diagnosis in the US. Adv Ther. 2021;38(6):3185–3202.
- Fernandez-de-Las-Penas C, Palacios-Cena D, Gomez-Mayordomo V, et al. Prevalence of post-COVID-19 symptoms in hospitalized and non-hospitalized COVID-19 survivors: a systematic review and meta-analysis. Eur J Intern Med. 2021;92:55–70.
- Jacobson KB, Rao M, Bonilla H, et al. Patients with uncomplicated coronavirus disease 2019 (COVID-19) have long-term persistent symptoms and functional impairment similar to patients with severe COVID-19: a cautionary tale during a global pandemic. Clin Infect Dis. 2021;73(3):e826–e829.
- Carvalho-Schneider C, Laurent E, Lemaignen A, et al. Follow-up of adults with noncritical COVID-19 two months after symptom onset. Clin Microbiol Infect. 2021;27(2):258–263.
- Tenforde MW, Kim SS, Lindsell CJ, et al. Symptom duration and risk factors for delayed return to usual health among outpatients with COVID-19 in a multistate health care systems network—United States, March–June 2020. MMWR Morb Mortal Wkly Rep. 2020;69(30):993–998.
- Al-Aly Z, Xie Y, Bowe B. High-dimensional characterization of post-acute sequelae of COVID-19. Nature. 2021;594(7862):259–264.
- Kubota T, Kuroda N. Exacerbation of neurological symptoms and COVID-19 severity in patients with preexisting neurological disorders and COVID-19: a systematic review. Clin Neurol Neurosurg. 2021;200:106349.
- Unudurthi SD, Luthra P, Bose RJC, et al. Cardiac inflammation in COVID-19: lessons from heart failure. Life Sci. 2020;260:118482.
- CDC COVID-19 Response Team. SARS-CoV-2 B.1.1.529 (omicron) Variant — United States, December 1–8, 2021. MMWR Morb Mortal Wkly Rep. 2021;70:1731–1734.
- Hernandez-Romieu AC, Leung S, Mbanya A, et al. Health care utilization and clinical characteristics of nonhospitalized adults in an integrated health care system 28–180 days after COVID-19 diagnosis — Georgia, May 2020–March 2021. MMWR Morb Mortal Wkly Rep. 2021;70(17):644–650.
- Centers for Disease Control and Prevention. People With Certain Medical Conditions. 2021. [cited 2021 October 4]. Available from: https://www.cdc.gov/coronavirus/2019-ncov/need-extra-precautions/people-with-medical-conditions.html.
- Yih WK, Hua W, Draper C, et al. Sentinel COVID-19 Natural History Master Protocol. 2020. [cited 2022 February 9]. Available from: https://www.sentinelinitiative.org/sites/default/files/Methods/COVID-19-Natural_History_Protocol_v3.0.pdf.
- Federici C, Cavazza M, Costa F, et al. Health care costs of influenza-related episodes in high income countries: a systematic review. PLOS One. 2018;13(9):e0202787.
- Marbus SD, Schweitzer VA, Groeneveld GH, et al. Incidence and costs of hospitalized adult influenza patients in The Netherlands: a retrospective observational study. Eur J Health Econ. 2020;21(5):775–785.
- Putri W, Muscatello DJ, Stockwell MS, et al. Economic burden of seasonal influenza in the United States. Vaccine. 2018;36(27):3960–3966.
- World Health Organization. A Clinical Case Definition of Post COVID-19 Condition by a Delphi Consensus, 6 October 2021. 2021. [cited 2022 February 9]. Available from: https://www.who.int/publications/i/item/WHO-2019-nCoV-Post_COVID-19_condition-Clinical_case_definition-2021.1.