
Abstract
Aims
Approximately, 4% of Stage IV colorectal cancers (CRC) are microsatellite instability-high (MSI-H)/deficient mismatch repair (dMMR) tumors. Patients with metastatic MSI-H/dMMR CRC receiving conventional therapies experience lower response rates and tend to have worse overall survival compared with patients with microsatellite stable (MSS)/proficient mismatch repair (pMMR) CRC. Pembrolizumab received FDA approval in 2020 for first-line treatment of Stage IV MSI-H/dMMR CRC based on significantly longer progression-free survival versus standard of care (SoC, 5-fluorouracil-based therapy with or without bevacizumab or cetuximab). This study evaluated the cost-effectiveness of pembrolizumab vs. SoC as per KEYNOTE-177 and other first-line treatments for MSI-H/dMMR CRC from a US healthcare system perspective.
Methods
A three-health-state partitioned-survival model was built using progression-free and overall survival data from KEYNOTE-177 and a network meta-analysis. Utilities were derived from KEYNOTE-177 EQ-5D-3L data. Drug acquisition, administration, AE, surgery, monitoring, subsequent treatment, and terminal care costs were included. Sensitivity and scenario analyses were performed, including utilizing a state-transition model structure and adopting a societal perspective.
Results
Over a lifetime time horizon, pembrolizumab and SoC were associated with total QALYs of 4.85 and 3.23, and total costs of $381,735 and $370,465, respectively, resulting in an ICER of $6,984 per QALY. QALY gains were mainly driven by extended survival with pembrolizumab. Pembrolizumab incurred higher drug acquisition costs relative to SoC but was cost-saving in terms of drug administration, AE, monitoring, subsequent treatment, and terminal care. Pembrolizumab dominated FOLFOX + panitumumab, FOLFOXIRI, and FOLFOXIRI + bevacizumab, and presented ICERs of $35,220 and $276 against XELOX and XELOX + bevacizumab. Results were robust to sensitivity and scenario analyses.
Conclusion
Pembrolizumab is highly cost-effective for the first-line treatment of unresectable or metastatic MSI-H/dMMR CRC in the US at a willingness-to-pay threshold of $100,000/QALY.
Pembrolizumab is a highly cost-effective option for the first-line treatment of patients with unresectable or metastatic MSI-H/dMMR colorectal cancer in the United States at a willingness-to-pay threshold of $100,000. Compared with the current standard of care for these patients, pembrolizumab:
Increases survival due to delaying and preventing progression;
Increases QALYs due to longer survival, improvement in HRQoL in the progression-free health state, and fewer Grade 3+ adverse events;
Reduces costs associated with administering treatment, managing adverse events, monitoring post-progression disease, providing subsequent treatment, and providing terminal care; and
Reduces indirect health care costs when taking a societal perspective due to productivity gains from delaying and preventing progression and death, less frequent treatment administration and less frequent Grade 3+ adverse events.
Key messages
Introduction
Worldwide, colorectal cancer (CRC) is the second most common type of cancer, with 1.15 million new cases and 577,000 deaths recorded in 2020Citation1. The microsatellite instability-high (MSI-H)/deficient mismatch repair (dMMR) phenotype occurs in approximately 4% of cases of Stage IV CRC and generally results in a worse prognosis for patientsCitation2,Citation3. Genomic testing is required to identify patients with MSI-H/dMMR tumors, and universal testing to all diagnosed patients with CRC is recommended in clinical practiceCitation4,Citation5. The standard tests are polymerase chain reaction for MSI-H and immunohistochemistry for dMMRCitation6. In patients with MSI-H/dMMR CRC receiving conventional therapies, lower response rates are observed compared with patients with microsatellite stable (MSS)/proficient mismatch repair (pMMR) CRCCitation7,Citation8. This association is less clear in Stage IV CRC, with some data showing a trend towards a worse overall survival (OS) for patients with MSI-H CRC compared with patients with MSS/pMMR diseaseCitation7,Citation8. Current therapies used in US clinical practice for the first-line treatment of Stage IV CRC include chemotherapy alone or chemotherapy combined with monoclonal antibodies such as bevacizumab, cetuximab, and panitumumabCitation4,Citation5. Nivolumab, pembrolizumab, encorafenib with cetuximab or vemurafenib, trastuzumab with pertuzumab or lapatinib, fam-trastuzumab deruxtecan-nxki, trifluridine with tipiracil, and regorafenib are used in later lines of therapy, generally after failure of chemotherapyCitation4,Citation5.
Pembrolizumab is a monoclonal antibody that targets the programmed cell death protein 1 (PD-1) receptor and blocks the binding of its cognate ligands, programmed death-ligand 1 and 2 (PD-L1 and PD-L2), preventing activation of the PD-1 pathway and thus enhancing the anti-tumor immune responseCitation9. The high level of activity of this mechanism of action in patients with MSI-H/dMMR disease is hypothesized to be related to the high burden of somatic mutations identified in MSI-H tumors that can be recognized by the patient’s immune systemCitation8.
In May 2017, pembrolizumab was approved by the US Food and Drug Administration (FDA) for the treatment of adult and pediatric patients with unresectable or metastatic solid tumors identified as being MSI-H/dMMR, including patients with MSI-H/dMMR CRC tumors, that have progressed following treatment with a fluoropyrimidine, oxaliplatin, and irinotecan, and patients with other solid tumors whose disease has progressed following prior treatment and who have no satisfactory alternative treatment options. In June 2020 pembrolizumab received regulatory approval for the first-line treatment of unresectable or metastatic MSI-H/dMMR CRC from the FDA, and then from the European Medicines Agency (EMA) in January 2021Citation10,Citation11. Between June 2020 and June 2021, pembrolizumab was recommended for reimbursement in first-line MSI-H/dMMR CRC based on its cost-effectiveness by the Pharmaceutical Benefits Advisory Committee (PBAC) in Australia, the National Institute for Health and Care Excellence (NICE) in England, and the Canadian Agency for Drugs and Technologies in Health (CADTH)Citation12–14.
These recommendations were based on results from KEYNOTE-177 and its related cost-effectiveness assessment. KEYNOTE-177 is a two-arm, multicenter, international, randomized, open-label, controlled study of pembrolizumab monotherapy vs standard chemotherapy in patients with MSI-H/dMMR Stage IV CRC. Patients were randomized 1:1 to receive pembrolizumab 200 mg every 3 weeks (Q3W) or investigator’s choice of standard of care (SoC) chemotherapy (including mFOLFOX6 [leucovorin, 5-fluorouracil, and oxaliplatin] or FOLFIRI [leucovorin, 5-fluorouracil, and irinotecan] alone or in combination with bevacizumab or cetuximab). Treatment with pembrolizumab and SoC was continued until disease progression, unacceptable toxicity, or patient/investigator decision to withdraw. For pembrolizumab, allowances were made to continue treatment after a tumor flare, and patients were treated for a maximum duration of 35 cycles (approximately 2 years). Per protocol, patients randomized to the SoC arm were allowed to cross over to pembrolizumab upon progressionCitation15.
At a median follow-up of 32.4 months (second interim analysis [IA2] data-cut: 19 February 2020), pembrolizumab demonstrated a statistically significant and clinically meaningful improvement in progression-free survival (PFS), as shown by a hazard ratio (HR) of 0.60 (95% CI= 0.45–0.80; p-value = 0.0002), representing a 40% reduction in the risk of disease progression or death. Median PFS in the pembrolizumab group was approximately double that of the SoC group (16.5 vs. 8.2 months)Citation16. At the time of IA2, OS data were not yet mature enough for formal analysis. At final analysis (19 February 2021), OS results showed that, despite the high proportion of patients in the SoC arm receiving pembrolizumab or another anti-PD-1/PD-L1 therapy upon progression (93 [60%] of the 154 patients randomized to SoC), a trend towards favorable OS was seen with pembrolizumab compared with SoC.
The economic burden associated with colorectal cancer in the US is high. In a study evaluating the Medicare spending for four different types of cancer utilizing 2007–2012 data from the Surveillance, Epidemiology and End Results (SEER) program, colorectal cancer was associated with a cost of $63,063 during the year of diagnosis, and of $73,883 over the year of death, with inpatient services accounting for the majority of these costsCitation17. Given the importance of assessing the value-for-money associated with pembrolizumab in first-line unresectable or metastatic MSI-H/dMMR CRC in the US, and the lack of cost-effectiveness assessments of this treatment in the US, there is a need for an economic evaluation of pembrolizumab vs. first-line therapies currently used in this indication to inform healthcare decision-making. We sought to assess the cost-effectiveness of pembrolizumab vs. SoC from a US health care system perspective based on the IA2 results of KEYNOTE-177, using the results from the KEYNOTE-177 final analyses to validate our OS extrapolationsCitation18. The primary comparator in the analysis was SoC as per KEYNOTE-177, as the treatments allowed in the SoC arm of KEYNOTE-177 are also used in US clinical practice and the comparison was based on direct head-to-head trial data. Based on indirect comparisons from a network meta-analysis (NMA), other treatments not included in the SoC arm of KEYNOTE-177 but used in US clinical practice – XELOX (oxaliplatin and capecitabine), mFOLFOX6 + panitumumab, XELOX + bevacizumab, FOLFOXIRI (leucovorin, 5-fluorouracil, oxaliplatin and irinotecan), and FOLFOXIRI + bevacizumab – were explored as secondary comparators in this analysis.
Methods
Model overview
A decision analytic model was built in Microsoft Excel with a US health care system perspective and adhered to guidance from the Institute for Clinical and Economic ReviewCitation19; a societal perspective was explored in scenario analyses. The time horizon of the model was set to 40 years (equivalent to lifetime). The model had a cycle length of 1 week, with half-cycle correction applied. Outcomes were discounted at 3% per yearCitation20,Citation21.
Decision problem
The target population included adults with first-line unresectable or metastatic MSI-H/dMMR CRC, as per the intention-to-treat (ITT) population in KEYNOTE-177 and the pembrolizumab FDA labelCitation16.
Two dosing regimens of pembrolizumab were included in the model: 200 mg Q3W, as per the dosing regimen used in KEYNOTE-177, and 400 mg every 6 weeks (Q6W), as an alternative dosing frequency approved by the FDACitation10. In the base case, it was assumed that 57.7% of patients received pembrolizumab 200 mg Q3W and the remaining received 400 mg Q6W, aligning with expected clinical practice based on market researchCitation22. This assumption was tested in the deterministic sensitivity analysis. The efficacy of the 400 mg Q6W regimen was assumed equal to that of the 200 mg Q3W regimen based on a pharmacodynamics analysisCitation10. Pembrolizumab was administered up to a maximum of 35 Q3W treatment cycles or 17 Q6W treatment cycles, equivalent to approximately 2 years as per the KEYNOTE-177 trial protocol. In both the Q3W and Q6W regimens, pembrolizumab was administered as a 30-minute intravenous infusion.
The primary comparator was SoC, as per the control arm of KEYNOTE-177. In this arm, the physician’s choice of six possible chemotherapy regimens was administered, which were distributed in KEYNOTE-177 as follows: mFOLFOX6, 9.1%; FOLFIRI, 11.0%; mFOLFOX6 + cetuximab, 3.2%; FOLFIRI + cetuximab, 7.1%; mFOLFOX6 + bevacizumab, 43.5%; and FOLFIRI + bevacizumab, 26.0%. Of note, KEYNOTE-177 was not powered to compare pembrolizumab vs. any of the individual treatments in the SoC arm; therefore, a blended comparator was modeled, ensuring that the drug costs and effectiveness modeled were consistent. The composition of the SoC arm in the model was assumed identical to that of the control arm in KEYNOTE-177 since the distribution of chemotherapies in KEYNOTE-177 was similar to what patients receive in US clinical practiceCitation23.
Secondary analyses were conducted to compare against external comparators based on NMA-based indirect comparisons for OS, PFS, and Grade 3+ treatment-related adverse events (AEs). The secondary comparators were XELOX (oxaliplatin 130 mg/m2+capecitabine 1,000 mg/m2); mFOLFOX6 + panitumumab (mFOLFOX6 + panitumumab 6 mg/kg); XELOX + bevacizumab (XELOX + bevacizumab 7.5 mg/kg); FOLFOXIRI; and FOLFOXIRI + bevacizumab (FOLFOXIRI + bevacizumab 5 mg/kg). The NMA used to inform the efficacy and safety profiles of the secondary comparators is described in a separate ongoing manuscriptCitation24.
Model structure
A partitioned-survival model was developed with pre-progression, progressed, and death health states. This model structure captures all meaningful differences in costs and benefits between pembrolizumab and its comparators whilst maintaining simplicity. Health state occupancy for pembrolizumab and SoC was calculated using extrapolated PFS and OS outcomes from KEYNOTE-177. For the secondary comparators, PFS and OS were modeled by applying the NMA results to the SoC PFS and OS extrapolated models.
The inclusion of separate health states for patients undergoing surgery with curative intent was considered unnecessary because similar rates of surgery with curative intent were observed in KEYNOTE-177 between the pembrolizumab and SoC arms: 9.2 and 8.4%, respectively.
A three-state state-transition model was also developed to assess the impact of structural uncertainty on the cost-effectiveness results in a scenario analysis. The methods and results of this alternative model structure are provided in Supplementary Appendix 1.
Model parameters
Efficacy
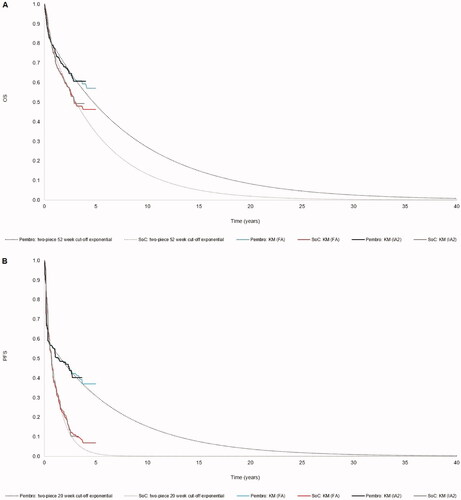
Model predictions for OS and PFS are presented in .
Figure 1. Kaplan–Meier plots and long-term extrapolations of survival outcomes from KEYNOTE-177. Abbreviations. FA, final analysis; IA2, second interim analysis; KM, Kaplan–Meier; pembro, pembrolizumab; SoC, standard of care.
Overall survival
As OS data from KEYNOTE-177 were not fully mature at IA2, parametric curves were fitted to the data to extrapolate survival outcomes over time. The survival modeling itself and subsequent curve selection process followed Latimer’s guidance on survival modelingCitation25,Citation26. The following factors were taken into account when selecting the base case survival models: visual inspection of extrapolated models against the observed Kaplan–Meier data; statistical test results from the Akaike (AIC) and Bayesian (BIC) information criteria; and the clinical plausibility of the long-term extrapolations.
OS was extrapolated by fitting parametric survival models to the OS Kaplan–Meier data from 52 weeks onwards, since one-piece parametric survival models resulted in a poor visual fit. The cut-off point was set at 52 weeks because the pembrolizumab hazard function showed evidence of a turn at this timepoint.
The Kaplan–Meier plots and log-cumulative hazards plots showed evidence indicating that the proportional hazards assumption was violated (see Supplementary Appendix 2), so parametric survival models were fitted to the pembrolizumab and SoC data separately. Six standard parametric curves were fitted to the data for each arm: exponential, Weibull, Gompertz, log-logistic, log-normal, and generalized gammaCitation25,Citation26.
Only the exponential model was considered plausible in terms of the percentage of patients in pembrolizumab and SoC alive at the end of the time horizon (see Supplementary Appendix 2.1).
The Weibull model projected similar long-term survival as the exponential model for SoC; however, >10% of patients in pembrolizumab were projected to remain alive at 40 years, which was considered overly optimistic. The use of the Weibull model for SoC and the exponential model for pembrolizumab is explored in a scenario analysis.
Progression-free survival
As with OS, PFS data were immature, resulted in poor visual fit when fitted with one-piece survival modeling, and showed a violation of proportional hazards. Therefore, separate, two-piece parametric survival models were fitted to the KEYNOTE-177 Kaplan–Meier PFS data. A cut-off point of 20 weeks was selected for two-piece modeling because it reflected a protocol-driven drop in the PFS Kaplan–Meier curve around the time of the second imaging assessment.
Both the exponential and Weibull models were considered plausible in terms of the long-term projections (see Supplementary Appendix 2.2). In our base case analysis, we used the exponential model because it resulted in a more conservative estimate for pembrolizumab.
Safety
Only Grade 3+ treatment-related AEs that occurred in ≥5% of patients in either the pembrolizumab or SoC arm of KEYNOTE-177 were considered in the analysis (). Lower-grade AEs and Grade 3+ AEs occurring in <5% of patients were not considered as these are unlikely to substantially affect the cost-effectiveness results. AE rates for both treatment arms were calculated by multiplying the number of patients who experience the event by the number of times the event was experienced per patient experiencing the event, and then dividing the resulting total number of times the AE occurred by the time on treatment with pembrolizumab or SoC from KEYNOTE-177. Both costs and disutilities associated with AEs were included in the model.
Table 1. Adverse event rates and durations from KEYNOTE-177.
Health-related quality-of-life
EQ-5D-3L questionnaire responses were collected during KEYNOTE-177 and scored using the US value setCitation27. The utility values used in the model are presented in .
Table 2. Model inputs.
Treatment-specific utilities were applied in the pre-progression health state because the 95% confidence intervals of the utility values do not overlap, suggesting statistical significance of a treatment effect. Post-progression utility values were assumed equal for pembrolizumab and SoC because the 95% confidence intervals of these utility values overlapped.
We used health state utility values from KEYNOTE-177 that excluded patients who experienced AEs at the time of completing the questionnaire. We estimated the utility decrement due to AEs separately as its own AE-related disutility. This separate disutility was estimated as the difference between the utility values associated with pre-progression without Grade 3+ AEs vs. pre-progression with Grade 3+ AEs. For all patients, a one-off quality-adjusted life year (QALY) decrement was applied in the first model cycle based on this AE-related disutility and on the incidence and mean durations from KEYNOTE-177 (). All utilities were age-adjusted based on data from Ara and BrazierCitation34.
The utilities for secondary comparators were assumed equal to those for SoC. This was considered plausible as the secondary comparators reflected chemotherapies with or without targeted treatment, in line with the KEYNOTE-177 SoC arm.
Costs
The cost values used in the model are presented in .
Drug acquisition costs
Drug acquisition resource use for pembrolizumab and SoC was based on dosages and time on treatment (ToT) as observed in KEYNOTE-177Citation28. As the pembrolizumab ToT data were fully mature, the Kaplan–Meier ToT data were used directly in the model without the need for extrapolation. This was not the case for SoC, with approximately 4% of patients still receiving treatment at the end of follow-up. Since the ToT data for SoC were very mature, the parametric model selection was based on statistical fit alone, with the one-piece exponential model providing the best fit in this case. Additional information surrounding alternative curve fits and goodness-of-fit statistics is presented in Supplementary Appendix 2.3.
For secondary comparators, the dosing schedules were extracted from the relevant National Comprehensive Cancer Network (NCCN) guidelinesCitation4,Citation5. The treatment durations for these were assumed to be equal to PFS for these treatments.
Unit costs from the REDBOOK were multiplied by the resource use described above to calculate the drug acquisition costs for each treatmentCitation28.
Drug administration costs
Drug administration costs were calculated based on unit costs sourced from the Centers for Medicare & Medicaid Services (CMS)Citation29 and dosing schedules as per the relevant NCCN guidelinesCitation4,Citation5.
Drug acquisition and administration costs were adjusted to account for missed doses using the proportion of expected doses that were actually administered in KEYNOTE-177: 96.5% (standard deviation [SD] = 8.1%) and 88.6% (SD = 12%) for pembrolizumab and SoC, respectively.
Vial sharing was allowed in the base case for the variable-dosed comparators. This is a conservative assumption; the variable nature of the comparators’ dosing would likely lead to wastage in clinical practice, which would increase the drug acquisition cost for comparators vs. pembrolizumab (which is administered at a fixed dose).
Surgery costs
Patients with metastatic CRC (mCRC) could undergo potentially curative resection surgery, the costs of which were included in the model. The model used the surgery rates observed in the trial (9.2% and 8.4% for pembrolizumab and SoC patients, respectively). Patients could receive more than one surgery with curative intent. In KEYNOTE-177 the mean number of surgeries required per patient undergoing surgery was 1.1 and 1.2 surgeries for pembrolizumab and SoC, respectively. The unit cost of surgery was $1,839, calculated based on an average of the relevant Healthcare Common Procedure Coding System (HCPCS) codes from CMS (44140–44160, 45110–45123, 44204–44213, 45395 and 45397) at 2020 pricesCitation29. The final surgery costs were calculated by multiplying the probability of undergoing surgery by the number of surgeries per patient and the unit costs of surgery ($180.09 for pembrolizumab and $178.57 for SoC). These one-off costs were applied at 80.5 weeks from the start of the model, which represents the mean number of weeks after treatment initiation that surgery occurred in KEYNOTE-177.
Adverse event costs
The resource use associated with treating AEs was discussed above. The unit costs associated with treating AEs were sourced from the Healthcare Cost and Utilization Project (HCUP) 2017 and inflated to 2020 costsCitation6. It was assumed that Grade 3+ AEs would result in hospitalization, making it appropriate to use HCUP costs. As with AE disutilities, AE costs were applied as a one-off cost in the first model cycle to reflect the assumption that AEs were likely to occur early in the on-treatment period.
Monitoring costs
Monitoring costs were included to reflect the change in resources used by patients across the model health states. According to NCCN guidelines, during pre-progression, patients are expected to regularly incur monitoring costs, including costs of consultant outpatient appointments, tumor marker tests, liver function tests, CT scans, and colonoscopies. After disease progression, patients are assumed to receive inpatient care to provide respite for the primary caregiver for 1 day per month. The unit costs of the monitoring resources and for inpatient care were sourced from CMSCitation29. The unit costs for inpatient care were inflated from 2008 to 2020 using the CPI index.
Subsequent treatment costs
One-off subsequent treatment costs were applied upon departure from the progression-free health state, which reflected the drug acquisition and administration costs of treatments received at second-line. The lump sum costs were calculated based on US market shares in 2020Citation30, acquisition costs from REDBOOKCitation28, administration costs from CMSCitation29, and subsequent treatment duration from KEYNOTE-177. As the proportions of subsequent therapies that patients received in the trial were generally aligned with those used in US clinical practiceCitation23, we performed a scenario analysis where the market shares of subsequent treatments were based on the observed data from KEYNOTE-177 rather than the aforementioned US market share data. Total subsequent treatment costs for pembrolizumab and SoC in the base case analysis were $1,322 and $62,032, respectively.
End-of-life costs
Many patients with Stage IV MSI-H/dMMR CRC eventually die from the disease; therefore, in the model, an end-of-life cost was applied upon death. The unit cost of terminal care was based on a study by Chastek et al.Citation31 that examined end-of-life costs and related healthcare resource use in a commercially insured oncology patient population in the US who died between 1 July 2002 and 31 December 2009. The model cost was $31,848, which was calculated by taking the sum of the inpatient cost ($20,559) and hospice care cost ($2,464) in the last 6 months before death and inflating to the current cost year.
Other costs
MSI-H/dMMR testing costs were not included since MSI-H/dMMR testing is already part of standard clinical practice in the USCitation4,Citation5.
In scenario analysis, societal costs were calculated using the human capital approach to quantify the societal benefit that pembrolizumab has for patients and caregivers. This approach incorporates benefits that result from productivity gains due to delaying and preventing progression and death, less frequent treatment administration, and less frequent AEs. Data from Färkkilä et al.Citation32 and Mennini et al.Citation35 were used to estimate working time lost during the progression-free and progressed disease health states, while observed data from KEYNOTE-177 were used to estimate time lost due to AEs and treatment administration. The average hourly salary sourced from the Bureau of Labor Statistics was used to estimate the overall monetary loss associated with the loss in earningsCitation33.
Sensitivity analysis
One-way deterministic sensitivity analyses and scenario analyses were conducted to examine the influence of specific inputs and assumptions on cost-effectiveness results. Rather than incremental cost-effectiveness ratios (ICERs), we assessed net monetary benefit (NMB) because some of the scenarios presented dominated results. The NMB for different sensitivity analyses was calculated using the recommended US willingness-to-pay (WTP) threshold of $100,000/QALYCitation20.
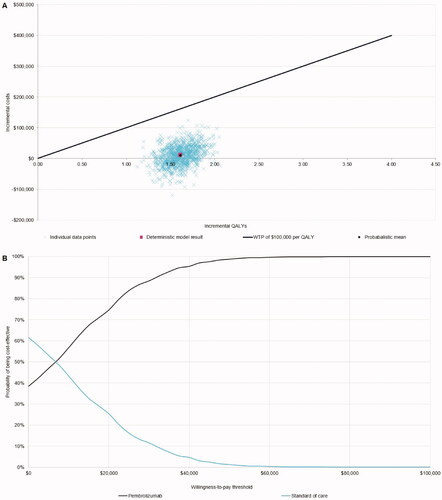
Probabilistic sensitivity analysis was conducted with 1,000 iterations to estimate the probability of each treatment being cost-effective under different WTP thresholds. In each iteration, inputs were randomly drawn from their specified distributions (presented in ). Uncertainty parameters or variance–covariance matrices of the selected distributions were based on original data sources; if unavailable, the standard error was assumed to be 10% of the mean value.
Results
Base case results
Pembrolizumab is associated with an increase in both life years (LYs) and QALYs compared with SoC, largely due to pembrolizumab avoiding or delaying progression, prolonging survival, increasing health-related quality-of-life (HRQoL) vs. SoC within pre-progression, and causing fewer AEs. Total QALYs were 4.845 for pembrolizumab and 3.232 for SoC, and total costs were $381,735 for pembrolizumab and $370,465 for SoC. Pembrolizumab incurs higher drug acquisition costs than SoC, but lower drug administration, AE, monitoring, subsequent treatment, and terminal care costs. Surgery costs were similar for both treatments. The resulting ICER for pembrolizumab vs. SoC was $6,984 per QALY ().
Table 3. Base case cost-effectiveness results.
Probabilistic sensitivity analysis results
The probabilistic sensitivity analysis is presented as a cost-effectiveness acceptability curve in . At a WTP threshold of $100,000 per QALY, as recommended by the Institute for Clinical and Economic ReviewCitation19, the probability of pembrolizumab being cost-effective was 100%. The probabilistic ICER of pembrolizumab vs. SoC was very similar to the deterministic ICER – $6,198 per QALY – indicating the results were robust to parametric uncertainty.
Figure 2. Probabilistic sensitivity analysis. Abbreviations. QALY, quality-adjusted life year; WTP, willingness to pay.
Deterministic sensitivity analysis and scenario analysis results
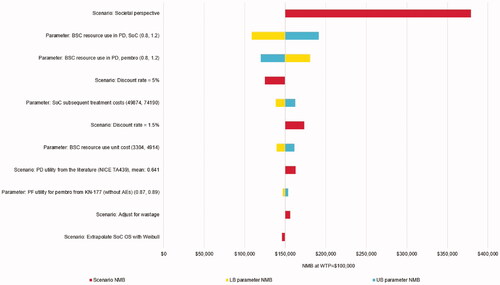
The diagram in presents the most influential sensitivity and scenario analyses for the NMB of pembrolizumab vs. SoC. The plausible NMB values ranged from $108,702 (ICER: $32,636/QALY) when varying the post-progression resource use of SoC in one-way sensitivity analysis, to $379,217 (pembrolizumab dominated SoC) in a scenario in which a societal perspective was used – showing that pembrolizumab is cost-effective vs. SoC in all scenarios. The large positive impact of using a societal perspective results from the productivity gains associated with pembrolizumab due to delayed/prevented progression and death, less frequent treatment administration, and less frequent AEs. Other notable scenarios include changing assumptions regarding post-progression resource use and using other discount rates. Using a state-transition model instead of a partitioned-survival model had little effect on pembrolizumab’s cost-effectiveness (see Supplementary Appendix 1.2). The scenario analysis results are also presented in tabular form, along with the base case and scenario settings, in Supplementary Appendix 3.
Figure 3. Sensitivity and scenario analysis results. Abbreviations. AE, adverse event; BSC, best supportive care; LB, lower bound; NMB, net monetary benefit; PD, progressed disease; PF, progression free; SoC, standard of care; UB, upper bound; WTP, willingness-to-pay. Note: Base case NMB = $150,095.
Results versus secondary comparators
The base case deterministic ICERs for the comparisons of pembrolizumab vs. XELOX and XELOX + bevacizumab were $35,220 and $276 per QALY, respectively (see Supplementary Appendix 4). The ICER vs. XELOX monotherapy is likely highly conservative due to data limitations in the network of evidence, which resulted in an implausibly high estimate for XELOX OS. Full details of the NMA are to be given in an upcoming manuscriptCitation24. As FOLFOX and XELOX are generally considered to have similar efficacy in mCRC, it is likely that the paucity of data for XELOX skewed the analysisCitation6. When compared with FOLFOX + panitumumab, FOLFOXIRI, and FOLFOXIRI + bevacizumab, pembrolizumab dominated (i.e. was less costly and more effective).
Discussion
This study investigated the cost-effectiveness of pembrolizumab vs. treatment strategies currently used in the US for the first-line treatment of patients with unresectable or metastatic MSI-H/dMMR CRC. The results indicate that at a WTP threshold of $100,000 per QALY, the probability of pembrolizumab being cost-effective vs. SoC in the US setting is 100%. The ICER of pembrolizumab vs. SoC is estimated to be $6,984 per QALY gained.
The model base case suggests that pembrolizumab is associated with incremental LYs of 1.815, owing to the extended PFS seen in KEYNOTE-177, which is projected to result in extended OS in the longer term and continues to be observed in the later trial data-cutCitation18. This translates to incremental QALYs of 1.614, reflecting the improved survival, improved pre-progression HRQoL, and reduced incidence of AEs experienced by patients receiving pembrolizumab compared with patients receiving SoC. Although treatment with pembrolizumab incurs higher drug acquisition costs, it is associated with lower costs of administering treatment, managing AEs, monitoring, providing subsequent treatment, and providing terminal care. In scenario analyses, using a societal perspective results in further cost savings, to the extent that pembrolizumab becomes dominant vs. SoC (i.e. less costly and more effective). The scenario analyses also show that model results are robust to using a state-transition model instead of a partitioned-survival model. Model results consistently demonstrate that pembrolizumab is highly cost-effective.
The incremental QALYs seen in the model base case are slightly lower than those published in a recent submission to NICE, TA709, which was also based on KEYNOTE-177Citation13. Our analysis predicts 1.614 incremental QALYs, whereas TA709 reported a Company estimate of 1.86 and an Evidence Review Group estimate of 1.89. This difference is largely driven by the fact that subsequent treatment with immune-oncology therapies were not available in the UK at the time, meaning NICE assumed in the model that both treatment arms had survival equivalent to that observed post-progression in the pembrolizumab arm of KEYNOTE-177. This was deemed appropriate as pembrolizumab and other anti-PD-1/PD-L1 therapies were given upon progression in the SoC arm of KEYNOTE-177, while these treatments are not recommended upon progression in England.
We compared the methodology of this study with that of other health economics analyses in mCRC in the US settingCitation36,Citation37. There is wide variation in the literature, with most analyses using either a state-transition or partitioned-survival approach, and a common criticism was a focus on first-line treatment without consideration of downstream treatments. Both of these areas have been included within our model based upon KEYNOTE-177 data.
A strength of this study is the use of head-to-head trial data vs. SoC for efficacy, safety, and HRQoL. Head-to-head clinical trials are considered to be the “gold standard” in health economics modeling with respect to validity and robustness. When compared with the final analysis data-cut, the 3-year OS for pembrolizumab was 59.5% (vs. 61.3% estimated by our model), while for SoC it was 49.4% (vs. 50.3% estimated by our model), demonstrating that our projections are aligned with the observed OS at final analysis ()Citation18. Another strength is the fully mature ToT data for pembrolizumab observed in KEYNOTE-177, which reduced the uncertainty around the treatment costs used in the model. We also accounted for structural uncertainty in our scenario analysis, the results of which suggest that the cost-effectiveness results are robust to changes in the model structure.
The cost-effectiveness analysis was subject to limitations, the main drawback being the immaturity of the OS data from the KEYNOTE-177 trial. Even in the most recent analysis, there were fewer than anticipated deaths (140 observed vs. 190 expected), and median OS had not yet been reached for pembrolizumab. Another limitation was that patient numbers in the control arm were too small to model the separate treatments individually. We therefore made use of blended data for comparator efficacy, safety, and quality-of-life in our model. We do not believe this is a significant issue since the composition of the blended SoC arm is generally representative of US practice.
Conclusion
Pembrolizumab meets an unmet need for patients with MSI-H/dMMR CRC who otherwise have no effective treatment options, as survival on current treatment options is very limited.
Our model brought together recent and relevant efficacy and safety data from the pivotal trial and established the cost-effectiveness of pembrolizumab compared with key comparators. The results were robust across a range of input values and assumptions.
Our study shows that pembrolizumab is a highly cost-effective first-line treatment for patients with unresectable or metastatic MSI-H/dMMR CRC in the US vs. SoC. Compared with current SoC for these patients, pembrolizumab is estimated to delay or avoid progression, increase survival, improve quality-of-life, and reduce costs associated with administration, AE management, monitoring, subsequent treatments, end of life, and productivity losses.
Transparency
Declaration of funding
This study was supported by funding from Merck Sharp & Dohme Corp., a subsidiary of Merck & Co., Inc., Kenilworth, NJ, USA.
Declaration of financial/other interests
RAI is an employee of Merck Canada Inc., a subsidiary of Merck & Co., Inc., Kenilworth, NJ, USA.
CH and DL are employees of BresMed Health Solutions Ltd, UK, which received consultancy fees from Merck Sharp & Dohme Corp., a subsidiary of Merck & Co., Inc., Kenilworth, NJ, USA in connection with this study.
FvH is an employee of BresMed Health Solutions Ltd, NL, which received consultancy fees from Merck Sharp & Dohme Corp., a subsidiary of Merck & Co., Inc., Kenilworth, NJ, USA in connection with this study.
AP, NC, and GB are employees of Complete Health Economics and Outcomes Research Solutions, which received consultancy fees from Merck Sharp & Dohme Corp., a subsidiary of Merck & Co., Inc., Kenilworth, NJ, USA in connection with this study.
MA, YL, RX, RM, and DF are employees of Merck Sharp & Dohme Corp., a subsidiary of Merck & Co., Inc., Kenilworth, NJ, USA.
Peer reviewers on this manuscript have no relevant financial or other relationships to disclose.
Supplemental Material
Download MS Word (854.8 KB)Acknowledgement
The authors would like to thank Jake Horgan (BresMed Health Solutions Ltd, UK) for his editorial assistance, and Jestinah Chevure (MSD, Belgium), for her support with statistical analyses.
References
- National Cancer Institute. Cancer stat facts: colorectal cancer; 29 July 2021. Available from: https://seer.cancer.gov/statfacts/html/colorect.html.
- Le DT, Durham JN, Smith KN, et al. Mismatch repair deficiency predicts response of solid tumors to PD-1 blockade. Science. 2017;357(6349):409–413.
- Venderbosch S, Nagtegaal ID, Maughan TS, et al. Mismatch repair status and BRAF mutation status in metastatic colorectal cancer patients: a pooled analysis of the CAIRO, CAIRO2, COIN, and FOCUS studies. Clin Cancer Res. 2014;20(20):5322–5330.
- National Comprehensive Cancer Network. Clinical practice guidelines in oncology (NCCN Guidelines) – rectal cancer; version 1.2021; 2021 [accessed 2021 July 6]. Available from: https://www.nccn.org/professionals/physician_gls/pdf/rectal.pdf.
- National Comprehensive Cancer Network. Clinical practice guidelines in oncology (NCCN Guidelines) – colon cancer; version 2.2021; 2021 [accessed 2021 Jul 6]. Available from: https://www.nccn.org/professionals/physician_gls/pdf/colon.pdf.
- Agency for Healthcare Research and Quality. Healthcare cost and utilization project; 2017 [accessed May 2021]. Available from: https://hcupnet.ahrq.gov/#setup.
- Gelsomino F, Barbolini M, Spallanzani A, et al. The evolving role of microsatellite instability in colorectal cancer: a review. Cancer Treat Rev. 2016;51:19–26.
- Battaglin F, Naseem M, Lenz HJ, et al. Microsatellite instability in colorectal cancer: overview of its clinical significance and novel perspectives. Clin Adv Hematol Oncol. 2018;16(11):735–745.
- Merck Sharp & Dohme Corp, Whitehouse Station, NJ, USA. KEYTRUDA (pembrolizumab); 2021 [updated May 2021; accessed 2021 June 17]. Available from: https://www.accessdata.fda.gov/drugsatfda_docs/label/2021/125514s097lbl.pdf.
- Food and Drug Administration. FDA approves pembrolizumab for first-line treatment of MSI-H/dMMR colorectal cancer; 2021 [updated March 2021; accessed 2021 Aug 27]. Available from: https://www.accessdata.fda.gov/drugsatfda_docs/label/2021/125514s096lbl.pdf.
- European Medicines Agency. Keytruda: assessment report; 2020 [updated 2020 Dec 10; accessed 2021 Jun 17]. Available from: https://www.ema.europa.eu/en/documents/variation-report/keytruda-h-c-3820-ii-0091-epar-assessment-report-variation_en.pdf.
- Pharmaceutical Benefits Advisory Committee. Pharmaceutical Benefits Advisory Committee (PBAC) meeting outcomes: March 2021 PBAC Meeting; 2021 [updated Mar 2021; accessed 2021 Jun 17]. Available from: https://www.pbs.gov.au/pbs/industry/listing/elements/pbac-meetings/pbac-outcomes/recommendations-made-by-the-pbac-march-2021.
- National Institute for Health and Care Excellence. TA709: Pembrolizumab for untreated metastatic colorectal cancer with high microsatellite instability or mismatch repair deficiency; 2021 [updated 2021 Jun 23; accessed 2021 Jul 16]. Available from: https://www.nice.org.uk/guidance/ta709.
- Canadian Agency for Drugs and Technologies in Health. CADTH reimbursement recommendation (draft): Pembrolizumab (Keytruda); 2021 [updated 2021 Jun 10; accessed 2021 Jul 29]. Available from: https://cadth.ca/sites/default/files/pcodr/Reviews2021/PC0235%20Keytruda%20-%20Draft%20CADTH%20Recommendation_For%20posting%20June%2010,%202021.pdf.
- Merck Sharp & Dohme Corp, Whitehouse Station, NJ, USA. A phase III study of pembrolizumab (MK-3475) vs. chemotherapy in microsatellite instability-high (MSI-H) or mismatch repair deficient (dMMR) stage IV colorectal carcinoma (KEYNOTE-177): protocol, version 4, 2018.
- André T, Shiu K-K, Kim TW, KEYNOTE-177 Investigators, et al. Pembrolizumab in microsatellite-instability-high advanced colorectal cancer. N Engl J Med. 2020;383(23):2207–2218.
- Chen CT, Li L, Brooks G, et al. Medicare spending for breast, prostate, lung, and colorectal cancer patients in the year of diagnosis and year of death. Health Serv Res. 2018;53(4):2118–2132.
- Andre T, Shiu K-K, Kim TW, et al. Final overall survival for the phase III KN177 study: Pembrolizumab versus chemotherapy in microsatellite instability-high/mismatch repair deficient (MSI-H/dMMR) metastatic colorectal cancer (mCRC). J Clin Oncol. 2021;39(15_suppl):3500–3500.
- Institute for Clinical and Economic Review. 2020–2023 value assessment framework; 2020. [updated 2020 Jan 31; accessed May 2021]. Available from: https://icer.org/wp-content/uploads/2020/10/ICER_2020_2023_VAF_013120-4-1.pdf.
- Institute for Clinical and Economic Review. ICER’s reference case for economic evaluations: principles and rationale; 2020 [updated 2020 Jan 31; accessed 2021 Jun 17]. Available from: https://icer.org/wp-content/uploads/2020/10/ICER_Reference_Case_013120.pdf.
- Sanders GD, Neumann PJ, Basu A, et al. Recommendations for conduct, methodological practices, and reporting of cost-effectiveness analyses: second panel on cost-effectiveness in health and medicine. JAMA. 2016;316(10):1093–1103.
- Merck Sharp & Dohme Corp, Whitehouse Station, NJ, USA. Estimated usage of dosing options by tumor type – Keytruda Q4 2020. Data on file. 2020.
- Kantar. CancerMPact treatment architecture: colorectal cancer, United States v1.1. Data on file. 2019.
- Jin H, Amonkar M, Aguiar-Ibáñez R, et al. Systematic literature review and network meta-analysis of pembrolizumab versus other interventions for previously untreated, unresectable or metastatic, microsatellite instability-high or mismatch repair-deficient colorectal cancer. Future Oncol. 2022. DOI:10.2217/fon-2021-1633
- Latimer N. NICE DSU technical support document 14: survival analysis for economic evaluations alongside clinical trials – extrapolation with patient-level data 2011 [updated March 2013; accessed 2020 Jul 2]. Available from: http://nicedsu.org.uk/wp-content/uploads/2016/03/NICE-DSU-TSD-Survival-analysis.updated-March-2013.v2.pdf.
- Latimer N. Survival analysis for economic evaluations alongside clinical trials-extrapolation with patient-level data: inconsistencies, limitations, and a practical guide. Med Decis Making. 2013;33(6):743–754.
- Shaw JW, Johnson JA, Coons SJ. US valuation of the EQ-5D health states: development and testing of the D1 valuation model. Med Care. 2005;43(3):203–220.
- IBM Corp. IBM Micromedex REDBOOK; 2020 [accessed May 2021]. Available from: https://www.micromedexsolutions.com/micromedex2/librarian/ssl/true.
- Centers for Medicare & Medicaid Services. Physician fee schedule search; 2020 [updated 2021 Jan 20; accessed May 2021]. Available from: https://www.cms.gov/apps/physician-fee-schedule/search/search-criteria.aspx.
- IQVIA. MSI/MMR Treatment. 2020. Data on file.
- Chastek B, Harley C, Kallich J, et al. Health care costs for patients with cancer at the end of life. J Oncol Pract. 2012;8(6):75s–80s.
- Färkkilä N, Torvinen S, Sintonen H, et al. Costs of colorectal cancer in different states of the disease. Acta Oncol. 2015;54(4):454–462.
- U.S. Bureau of Labor Statistics. Employer costs for employee compensation – March 2021; 2021 [accessed 2021 Aug 13]. Available from: https://www.bls.gov/news.release/pdf/ecec.pdf.
- Ara R, Brazier JE. Populating an economic model with health state utility values: moving toward better practice. Value Health. 2010;13(5):509–518.
- Mennini FS, Marcellusi A, Fabiano G, et al. Budget impact of bimonthly use of cetuximab in patients diagnosed with metastatic colorectal cancer. Future Oncol. 2019;15(18):2107–2112.
- Goldstein DA, Zeichner SB, Bartnik CM, et al. Metastatic colorectal cancer: a systematic review of the value of current therapies. Clin Colorectal Cancer. 2016;15(1):1–6.
- Degeling K, Vu M, Koffijberg H, et al. Health economic models for metastatic colorectal cancer: a methodological review. Pharmacoeconomics. 2020;38(7):683–713.