
 ?Mathematical formulae have been encoded as MathML and are displayed in this HTML version using MathJax in order to improve their display. Uncheck the box to turn MathJax off. This feature requires Javascript. Click on a formula to zoom.
Abstract
Aims
Existing treatment-sequence models for psoriasis are limited by lines of treatments included. We sought to more accurately capture the patient experience with an increasing number of treatments while maintaining the complexity and transparency of current models.
Materials and methods
We adapted a standard treatment-sequence model for psoriasis with two lines of active treatments followed by best supportive care (BSC). The first line was used to model the targeted treatments for comparison (Biologic A or B). The second line was used potentially to model all treatments (excluding the first-line treatment) before BSC, termed the basket of biologics (BoB). First-line treatment and the BoB were modeled with an induction and maintenance phase. The BoB efficacy was assumed to be the average of all treatments included and the BoB annual discontinuation rate was based on the number of treatments included and their individual annual discontinuation rate. A varying number of treatments in the BoB were tested (1, 5, 10). Model inputs were from published literature.
Results
In our example, when the number of treatments in the BoB increased from 1 to 10, the annual discontinuation rate of the BoB dropped from 16.5% to 1.2%. Time on BoB increased from 4.16 to 19.16 years and the time on BSC decreased from 28.28 to 13.29 years. Total costs and quality-adjusted life years increased with an increasing number of treatments in the BoB.
Limitations
The properties of the BoB were simplified in order to maintain the transparency of the model. Results may differ if individual treatments in the BoB are modeled line by line.
Conclusions
Modification with the BoB allows a greater number of treatments within the model, providing a closer reflection of clinical reality, and has implications for evaluation of the long-term cost-effectiveness of psoriasis treatments.
PLAIN LANGUAGE SUMMARY
Psoriasis is a chronic skin disease with no cure that causes itchy and painful plaques and scales, most commonly found on the scalp, trunk, elbows, and knees. A variety of treatments are available that can improve the signs and symptoms of psoriasis. Healthcare payers are interested in the costs, benefits, and risks of treatments for all diseases, including those for psoriasis. These payers often use mathematical models to better understand and compare the value of various treatments. With psoriasis, these models usually assume three lines of active therapy and then a final supportive therapy over a patient’s lifetime. However, the average number of therapies patients with psoriasis receive is often greater than three, resulting in them spending most of their time on, and switching among, treatments rather than on best supportive care. Therefore, instead of modeling each line of treatment individually, the researchers proposed a modification to the existing model framework, whereby all subsequent treatments are combined into a single basket. This modification allowed for many treatments to be considered over the lifetime of patients with psoriasis and also maintained the model’s complexity. The researchers found that as the amount of time on active therapy increased, the amount of time on supportive therapy decreased, treatment costs increased, and patients spent more time with better quality-of-life. The researchers concluded that the proposed model modification more closely resembles clinical practice than the previous model and would be very useful to healthcare payers in better estimating the value of psoriasis treatments.
Introduction
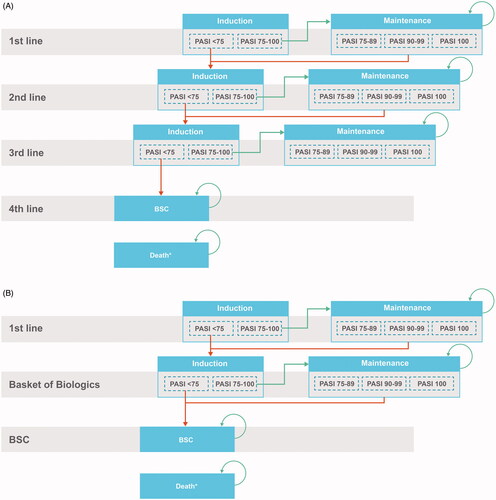
Psoriasis is a chronic, inflammatory, autoimmune disease distinguished by the presence of scaly skin patches or plaquesCitation1. The therapeutic landscape for patients with moderate to severe psoriasis consists of a multitude of treatments, including 10 biological treatments and two systemic nonbiologic treatments, which have become increasingly more available in the past several years. When selecting the appropriate treatment for a patient, physicians must consider multiple aspects, including comorbidities such as chronic infections and concomitant conditions such as pregnancyCitation2,Citation3. In clinical practice, discontinuation of first-line treatment within several years after initiation is common for a variety of reasons in patients with moderate to severe psoriasis, and patients then switch to a subsequent treatment. Thus, health economic models in psoriasis are usually based on a comparison of treatment sequences as patients will likely be treated by multiple therapies over their lifetime; this treatment sequencing in psoriasis health economic models increases their relevance for decision makers and better mimics clinical practice than a single treatment comparisonCitation4. Currently, treatment sequences in health economic models for the United Kingdom (UK) National Institute for Health and Care Excellence (NICE) health technology assessment (HTA) of moderate to severe psoriasis typically include three active therapies followed by best supportive care (BSC) in order to keep models manageable, limit complexity, and increase transparencyCitation4–6. This type of model structure is summarized in . However, with the widespread availability of treatment options and patients’ desire for increased efficacy, there is the potential future trend of additional switching beyond the modeled three active treatmentsCitation7. Lack of additional treatment lines in a model may lead to the underestimation of life-years on active treatment and overestimation of patients’ time on BSC; therefore, the model results rely heavily on the inputs for BSC. The objective of this analysis was to explore several modifications to the way treatment sequences are currently modeled in order to explore other possible clinical journeys of patients with moderate to severe psoriasis, while maintaining the same level of complexity and transparency as the existing models.
Figure 1. Overview of current treatment-sequence model in psoriasis (A) and our adaptation (B). *Patients can transition to death from any health state. Abbreviations. BSC, best supportive care; PASI, Psoriasis Area and Severity Index.
Methods
A treatment sequence model with a lifetime horizon was built in Microsoft Excel to model treatments in moderate to severe psoriasis patients in the UK (). The model structure was based on the core model framework used in previous NICE HTA submissions in psoriasis, and was validated by UK clinical and HTA experts. In our model, a basket of biologic (BoB) therapies was modeled after the first active treatment (Biologic A or Biologic B) but before BSC to capture patients receiving numerous therapies over their lifetime. Rather than selecting second- and third-line treatments arbitrarily, the BoB represents potentially all biologic treatments a patient is expected to receive before BSC. The BoB is dependent on the first-line treatment and therefore the BoB is different between sequences.
The first-line treatment and the BoB each consisted of an induction phase and a maintenance phase. During the induction phase, patients initiate the treatment and remain on the treatment until response evaluation at a predetermined amount of time. The duration of the induction phase is based on the recommended timing of response assessment for each specific treatment. At the end of the induction phase, patients move into the maintenance phase of the same treatment if they achieve minimum response to the treatment, defined by achieving a Psoriasis Area Severity Index reduction of at least 75% (PASI 75). If patients do not respond to the treatment, they move into the induction phase of the next-line treatment. Patients remain in the maintenance phase until they die or discontinue treatment for any reason. Based on prior NICE submissions and clinical expert input, the BSC is defined as a basket of nonsystemic treatments. Once on BSC, patients are assumed to remain on BSC until death.
For the BoB, the induction period was assumed to be 16 weeks, as this is the time point for response assessment for the majority of biologic treatments. The efficacy of the BoB (i.e. the PASI 75) was the simple average of all treatments considered in the BoB (while excluding the biologic received in first-line treatment from this calculation). The annual treatment discontinuation rate of the BoB was derived using the following steps:
Derive the proportion of patients on each treatment within the BoB for the entire time horizon. The calculation tracks patients’ transitioning from one treatment to the next treatment sequentially every year where the transition probability is determined by the annual treatment discontinuation rate for the treatment the patient is on currently. Mortality is excluded from this step of the calculation.
Derive the annual discontinuation rate of the BoB from the cumulative proportion of patients who have experienced all treatments in the BoB during the entire time horizon based on the assumption of constant annual discontinuation rate across the entire time horizon.
When the discontinuation rate for each treatment in the BoB is the same, the annual discontinuation rate for the BoB can be mathematically expressed as EquationEquation 1(1)
(1) :
(1)
(1)
where T represents the time horizon, b represents the number of biologics, t represents the time in years, and d represents the annual discontinuation rate for each treatment.
The model used input from a targeted literature review focused on previous technical reports from NICE on moderate to severe plaque psoriasis; and a network meta-analysis performed to assess the relative Psoriasis Area and Severity Index response levels (PASI 50, PASI 75, and PASI 90, corresponding to 50%, 75%, and 90% reductions from baseline, respectively) for treatments and BSC. An annual treatment discontinuation rate of 16.4% for biologics was obtained from the British Association of Dermatologists Biologics and Immunomodulators Register (BADBIR), a registry of patients with psoriasis in the UK and Republic of Ireland. This discontinuation rate was applied to all treatments considered in the modelCitation8.
A patient population age of 45 years was modeled for a lifetime horizon of 60 years using the UK Office for National Statistics life tables. Health state utilities were based on a technology appraisal of brodalumabCitation9. Costs for drug acquisition were derived from the British National Formulary price listCitation10. Costs for drug administration, monitoring activities, and adverse events were based on 2017–2018 reference costs from the National Health ServiceCitation11. The monitoring activities required in psoriasis were derived from the technology appraisal of brodalumab. Costs for BSC and nonresponse were based on the international literatureCitation12.
The primary outcome of interest was time on treatment. Several scenarios were tested, varying the number of treatments in the BoB. An incremental cost-utility analysis was also conducted to illustrate the impact of the changing assumption for the number of treatments in the BoB for two different treatment sequences. Results are presented in cost-year 2019 British pounds (£). All costs and quality-adjusted life years (QALYs) were discounted at 3.5% annuallyCitation13. All model inputs can be found in Supplementary Table S1.
Results
Time on treatment
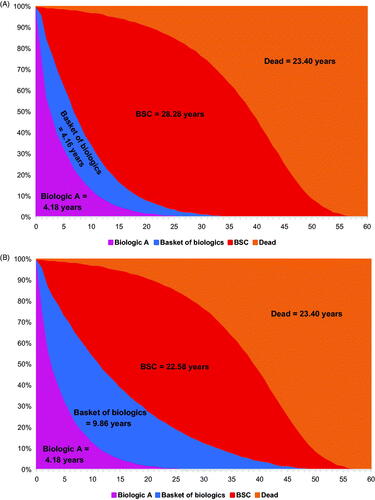
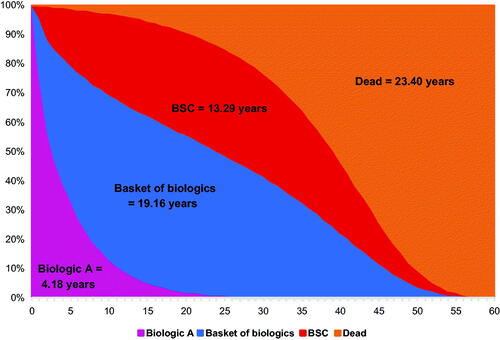
The time on treatment for the treatment sequence 1: Treatment A → BoB → BSC is shown in . With a BoB composed of one individual treatment, the annual discontinuation rate of the BoB is 16.4% (same as the annual discontinuation rate for individual treatment), and the resulting time on BoB and on BSC was 4.16 and 28.28 years, respectively (). When the BoB was composed of five individual biologics, the annual discontinuation rate for the BoB was 5.9%, and time on BoB increased to 9.86 years and time on BSC decreased to 22.58 years (). Assuming the BoB was composed of 10 individual biologics, the annual discontinuation rate for the BoB dropped to 1.2% while time on BoB increased to 19.16 years, but time on BSC decreased to 13.29 years (). With more treatments in the BoB, the proportion of time on BoB increased as the time on BSC decreased.
Figure 2. Time on treatment for treatment sequence: Biologic A → BoB → BSC when the number of treatments in BoB increases from one to five to 10. (A) BoB consisting of one individual biologic. (B) BoB consisting of five individual biologics. (C) BoB consisting of 10 individual biologics. Abbreviations. BoB, basket of biologics; BSC, best supportive care.
Cost and effects
Total costs, QALYs, and incremental cost-utility ratios (ICURs) of the comparison between two sequences (Treatment A → BoB → BSC vs Treatment B → BoB → BSC) are presented in . As expected, regardless of the first-line treatment, the total costs and total QALYs increased as the number of treatments in the BoB increased, because biologic treatment is associated with higher efficacy and costs compared with BSC. Although the incremental time on BoB increased as the number of treatments in the BoB increased, the incremental QALYs and costs were both decreased, and the ICUR increased. The key driver for these results is that in our example, while keeping all other treatments in the BoB the same, the BoB for sequence 1 (starts with treatment A) includes the more efficacious treatment B while the BoB for sequence 2 (starts with treatment B) includes the less efficacious treatment A. As a result, the efficacy of the BoB for treatment sequence 1 is better than the efficacy of the BoB for sequence 2. As the time on BoB increases, we see sequence 1 (i.e. the one with less efficacious first-line treatment but more efficacious BoB) starts to outperform sequence 2 (i.e. the one with a more efficacious first line but less efficacious BoB).
Table 1. Time on treatment and cost-utility results.
Discussion
This analysis explored modifications to the way treatment sequences are currently modeled in moderate to severe psoriasis. By more accurately modeling the number of active treatments a patient may use, our study attempts to bridge the gap between current health economic models and clinical reality. This model tested various scenarios to ascertain the impact of varying the number of active treatments, which may reflect current and future treatment availability in the plaque psoriasis therapeutic area. This modeling framework tests the impact on cost-effectiveness of scenarios ranging from just a few biologics in the BoB at present to potentially many biologics available in the future.
Several simplifying assumptions were made regarding the properties of the BoB and deriving its efficacy and annual discontinuation rate to maintain the complexity and transparency of the model. Future research could explore the difference between the proposed approach of modeling all subsequent treatments in an aggregated way (i.e. using a BoB) vs modeling each treatment in the BoB line by line to see if the same observation holds. The BoB was included as an approximation of patients receiving a multitude of biologic treatments over time, but this approach does not fully capture patients’ use of biologics expected in actual clinical practice. Finally, the ability of the model structure to reflect changes in treatment discontinuation over time is limited to the inclusion of odds ratios for discontinuation between first-line treatment and subsequent treatment-line discontinuation. This limitation was considered when selecting the Markov modeling approach; the lack of long-term discontinuation and persistence data, especially for oral systemic treatments, did not justify the additional complexity of modeling time-dependent discontinuation because the results would be very uncertain.
Conclusions
Considering the impact of the initial treatment on the choice of the subsequent treatments and modeling a realistic number of sequent treatments is a more accurate reflection of clinical reality. This modification can potentially ease the concern on the model results relying heavily on the inputs for BSC and may have a significant impact when comparing the cost-effectiveness of two treatment sequences. This methodological assessment provides further resources to inform future modeling of psoriasis therapies for HTA analysis.
Transparency
Declaration of funding
This analysis was sponsored by Bristol Myers Squibb.
Declaration of financial/other relationships
GvdW and TI: Employees of OPEN Health, which received consulting fees from Bristol Myers Squibb. DD, VP, YZ, and JZ: Employees and shareholders of Bristol Myers Squibb.
A reviewer on this manuscript has disclosed that they have received research, speaking, and/or consulting support from Arcutis, Dermavant, Galderma, GSK/Stiefel, Almirall, Alvotech, Leo Pharma, BMS, Boehringer Ingelheim, Mylan, Celgene, Pfizer, Ortho Dermatology, Abbvie, Samsung, Janssen, Lilly, Menlo, Merck, Novartis, Regeneron, Sanofi, Novan, Qurient, National Biological Corporation, Caremark, Advance Medical, Sun Pharma, Helsinn, Arena, Forte, Informa, UpToDate, and National Psoriasis Foundation. They also consult for others through Guidepoint Global, Gerson Lehrman, and other consulting organizations. They are the founder and majority owner of www.DrScore.com. They are the founder and part owner of Causa Research, a company dedicated to enhancing patients’ adherence to treatment.
Another reviewer has disclosed that they are an employee of Mount Sinai and have received research funds from: Abbvie, Amgen, Arcutis, Avotres, Boehringer Ingelheim, Dermavant Sciences, Eli Lilly, Incyte, Janssen Research & Development, LLC, Ortho Dermatologics, Regeneron, and UCB, Inc., and is a consultant for Aditum Bio, Almirall, AltruBio Inc., AnaptysBio, Arcutis, Inc., Aristea Therapeutics, Arrive Technologies, Avotres Therapeutics, BiomX, Boehringer-Ingelheim, Bristol Myers Squibb, Cara Therapeutics, Castle Biosciences, Corrona, Dermavant Sciences, Dr. Reddy’s Laboratories, Evelo Biosciences, Evommune, Inc., Facilitatation of International Dermatology Education, Forte Biosciences, Foundation for Research and Education in Dermatology, Helsinn Therapeutics, Hexima Ltd., LEO Pharma, Meiji Seika Pharma, Mindera, Pfizer, Seanergy, and Verrica.
The other peer reviewers on this manuscript have no other relevant financial relationships or otherwise to disclose.
Previous presentations
van de Wetering G, et al. Treatment sequencing in modeling the economic benefits of psoriasis therapy: impact of key assumptions [poster]. Presented at: International Society for Pharmacoeconomics and Outcomes Research (ISPOR) Europe 2020 Virtual Meeting, November 16–19, 2020.
Supplemental Material
Download MS Word (21.1 KB)Acknowledgements
Professional medical writing from Samantha Rivera, MS, and editorial assistance were provided by Peloton Advantage, LLC, an OPEN Health company, Parsippany, NJ, USA, and were funded by Bristol Myers Squibb.
Data availability statement
The Bristol Myers Squibb policy on data sharing may be found at: https://www.bms.com/researchers-and-partners/independent-research/data-sharing-request-process.html
References
- Feldman SR, Goffe B, Rice G, et al. The challenge of managing psoriasis: unmet medical needs and stakeholder perspectives. Am Health Drug Benefits. 2016;9(9):504–513.
- Kaushik SB, Lebwohl MG. Psoriasis: which therapy for which patient: focus on special populations and chronic infections. J Am Acad Dermatol. 2019;80(1):43–53.
- Kaushik SB, Lebwohl MG. Psoriasis: which therapy for which patient: psoriasis comorbidities and preferred systemic agents. J Am Acad Dermatol. 2019;80(1):27–40.
- Mauskopf J, Samuel M, McBride D, et al. Treatment sequencing after failure of the first biologic in cost-effectiveness models of psoriasis: a systematic review of published models and clinical practice guidelines. Pharmacoeconomics. 2014;32(4):395–409.
- Bewley A, Barker J, Mughal F, et al. Cost-effectiveness of apremilast in moderate to severe psoriasis in the United Kingdom. Cogent Med. 2018;5(1):1495593.
- Ramaekers BLT, Wolff RF, Pouwels X, et al. Ixekizumab for treating moderate-to-severe plaque psoriasis: an evidence review group perspective of a NICE single technology appraisal. Pharmacoeconomics. 2018;36(8):917–927.
- Armstrong A, Jarvis S, Boehncke WH, et al. Patient perceptions of clear/almost clear skin in moderate-to-severe plaque psoriasis: results of the Clear About Psoriasis worldwide survey. J Eur Acad Dermatol Venereol. 2018;32(12):2200–2207.
- Yiu ZZN, Mason KJ, Hampton PJ, et al. Drug survival of adalimumab, ustekinumab and secukinumab in patients with psoriasis: a prospective cohort study from the British Association of Dermatologists Biologics and Immunomodulators Register (BADBIR). Br J Dermatol. 2020;183(2):294–302.
- National Institute for Health and Care Excellence. Brodalumab for treating moderate to severe plaque psoriasis: technology appraisal guidance [TA511]. National Institute for Health and Care Excellence, London, UK; 2018.
- British National Formulary. National Institute for Health and Care Excellence; 2019 [cited 2021 Mar 22]. Available from: https://www.nice.org.uk/about/what-we-do/evidence-services/british-national-formulary.
- NHS Improvement. Reference costs 2017/18: highlights, analysis and introduction to the data. London (UK): NHS Improvement; 2018.
- Fonia A, Jackson K, Lereun C, et al. A retrospective cohort study of the impact of biologic therapy initiation on medical resource use and costs in patients with moderate to severe psoriasis. Br J Dermatol. 2010;163(4):807–816.
- National Institute for Health Care Excellence. Guide to the methods of technology appraisal 2013. London (UK): National Institute for Health and Care Excellence; 2013.