
Abstract
Background
To assess the total cost of testing associated with next-generation sequencing (NGS) versus polymerase chain reaction (PCR) testing strategies among patients with metastatic non-small cell lung cancer (mNSCLC) from a Medicare and US commercial payer’s perspective.
Materials and Methods
A decision tree model considered testing for genomic alterations in EGFR, ALK, ROS1, BRAF, KRAS, MET, HER2, RET, NTRK1 among patients with newly diagnosed mNSCLC using (1) liquid or tissue biopsy NGS tests, (2) exclusionary mutation (KRAS) test followed by sequential PCR tests, (3) sequential PCR tests, or (4) hotspot panel PCR tests. The alteration test sequence followed clinical guideline recommendations. Inputs based on literature, expert opinion, or assumptions included prevalence of mNSCLC, proportion of patients using each testing strategy (50% NGS [90% tissue, 10% liquid], 10% exclusionary, 10% sequential, 30% hotspot), proportion testing positive for each genomic mutation, rebiopsy rates, and costs for testing and associated medical care. Time to appropriate targeted therapy initiation and total costs were calculated for NGS, each PCR testing strategy, and all PCR strategies combined.
Results
Among a hypothetical plan of 1,000,000 members (75% commercial, 25% Medicare), 1,119 patients were estimated to have mNSCLC and be eligible for testing. Estimated mean time to appropriate targeted therapy was 2 weeks for NGS and 6 weeks for PCR (sequential: 9 weeks, exclusionary: 8 weeks, hotspot: 3 weeks). Mean per patient costs were $4,932 for NGS and $6,605 for PCR (exclusionary: $5,563, sequential: $6,263, hotspot: $7,066). Per patient costs were higher from a commercial perspective (NGS: $6,225; PCR: $8,430) relative to Medicare (NGS: $2,099; PCR: $2,646); nevertheless, NGS was the least costly testing strategy across plan types.
Conclusion
NGS was associated with the fastest time to appropriate targeted therapy initiation and lowest total cost of testing compared to PCR testing strategies for newly diagnosed patients with mNSCLC.
Introduction
Non-small cell lung cancer (NSCLC) accounts for nearly 85% of all histologically confirmed cases of invasive lung cancer in the United States (US)Citation1. To date, more than half of all NSCLC cases can be classified based on the presence of genomic alterations in driver oncogenes, such as EGFR, ALK, ROS1, KRAS, BRAF, MET, HER2, RET, and NTRK1Citation2. As such, molecular testing has become an integral component of disease management by allowing the identification of oncogene alterations with implications for prognosis, diagnostic testing sequencing, and ultimate choice of therapyCitation3, including matched targeted therapies to manage specific subpopulations of patients with metastatic NSCLC (mNSCLC)Citation4,Citation5.
Clinical practice guidelines recommend molecular testing and strongly advise broad molecular profiling for all patients with mNSCLC to identify driver mutationsCitation6. The testing strategies currently available to identify genomic alterations in NSCLC can be distinguished based on the ability to test multiple genes simultaneously. Certain testing strategies, such as polymerase chain reaction (PCR)-based methods, employ single gene sequential testing (e.g. sequential or exclusionary testing) or targeted hotspot testing for actionable genetic alterations, and may result in the need for additional testing and/or rebiopsyCitation6. Alternatively, the broad molecular profiling associated with next-generation sequencing (NGS) is consistent with guideline recommendations as it enables upfront and simultaneous detection of common and rare actionable mutations in NSCLCCitation6.
By reducing delays in the time to receive test results and the need for retesting and repeat biopsies associated with sequential and exclusionary testingCitation7,Citation8, NGS has been found to be more cost-effective than the alternative testing modalitiesCitation7,Citation9. In a retrospective study of 28,011 patients with newly diagnosed lung cancer, the average per patient testing costs of individual single-gene exclusionary and sequential tests was $3,763, whereas the average per patient costs of an NGS test for the same mutations was $2,860 from a US commercial payer perspective; from a Medicare perspective, the per patient costs were $1,749 and $623, respectivelyCitation10. Recently, Pennell et al. showed that in a hypothetical 1,000,000-member health plan, NGS was the least expensive testing option and was associated with substantial cost savings compared to all other testing modalities from the perspective of the Centers for Medicare & Medicaid Services (CMS) and US commercial payersCitation9. Additionally, time-to-test results for NGS was faster than exclusionary and sequential testing by 2.7 and 2.8 weeks, respectivelyCitation9.
While previous studies have found that NGS is associated with lower per patient testing costs compared to PCR testing strategiesCitation9,Citation10, there is limited evidence on the total cost of testing associated with NGS relative to PCR testing strategies that incorporates testing-related medical costs, such as specialist and outpatient visits, and costs of rebiopsies and rebiopsy-related complications. Therefore, the goal of the current study was to develop an economic model that assessed the impact of NGS versus PCR testing strategies on the total cost of testing, including medical costs, from a Medicare and US commercial payer’s perspective.
Materials and methods
Model framework
A decision tree model was developed using Excel 2016 software (Microsoft Corporation, Redmond, WA) to assess the total cost of testing associated with NGS versus PCR testing strategies to identify genomic alterations among patients with mNSCLC. The model included a US population of adult patients with mNSCLC insured through Medicare (aged 65 years and older) or commercial health insurance plans (aged 18–64 years) who have an unknown genomic status and were not yet undergoing active treatment. The model time horizon spanned from the first test following a diagnosis of mNSCLC until the initiation of appropriate targeted therapy to reflect patients’ testing pathways and associated costs.
Model structure
Consistent with a prior decision analytic model assessing testing costs associated with NGS relative to PCR testing strategies by Pennell et al.Citation9, patients with mNSCLC entered the model and received an initial biopsy. Patients then underwent testing using NGS or one of the following alternative PCR testing strategies: sequential, exclusionary, or hotspot panel. The testing strategies were defined by the following sequences:
NGS testing: Patients received a broad spectrum biomarker panel using either tissue or liquid biopsy that simultaneously tested for all alterations included in clinical guideline recommendations at the time of model development (EGFR, ALK, ROS1, BRAF, KRAS, MET, HER2, RET, and NTRK1)Citation6
Exclusionary testing: Patients initially received a test for KRAS (considered the most common mutation in lung adenocarcinoma in the USCitation11) whereby a positive test result prevented the need for additional testing (as the genetic alterations of interest were assumed to be mutually exclusive). Negative test results were followed by sequential testing (as defined below)
Sequential testing: Patients received a sequence of single-gene tests for alterations based on clinical guideline recommendations at the time of model development (in this order: EGFR, ALK, and ROS1)Citation6 whereby a positive test result for any of the alterations precluded the need for additional testing
A negative test for all three alterations resulted in the following sequence of single-gene tests (one at a time, in this order, contingent upon receiving a negative test result for the prior alteration): KRAS, BRAF, MET, HER2, RET, and NTRK1
Hotspot panel testing: Patients received a simultaneous panel test for alterations based on clinical guideline recommendations at the time of model development (EGFR, ALK, and ROS1)Citation6 whereby a positive test result precluded the need for additional testing, while a negative result for all three alterations was followed by an expanded simultaneous testing panel for the other alterations (KRAS, BRAF, MET, HER2, RET, and NTRK1)
Model assumptions
The decision tree model incorporated the following assumptions, all of which were informed by literature or expert opinion:
The model assumed that all patients underwent PD-L1 testing, based on immunohistochemistry (IHC).
The model assumed that 100% of patients included in the eligible patient population were tested, and that each patient underwent only one testing strategy.
Currently, a variety of molecular testing strategies are employed in real world practice for patients with cancer. The current model assumed a base case whereby the proportion of patients that underwent each testing strategy was informed by literature and expert opinion and was as follows: 50% NGSCitation12, 10% sequential, 10% exclusionary, and 30% hotspot panel.
DNA- or RNA-based NGS was based on liquid or tissue biopsy. The current model assumed the proportion of patients that underwent an NGS liquid test was 10% while 90% of patients underwent an NGS tissue test. Combined DNA- and RNA-based testing modalities (e.g. to identify gene fusions) were not considered as part of this study.
The model assumed the literature-based rate of positive detection for each mutation was the same across testing strategiesCitation2,Citation13,Citation14.
Patients that underwent testing with NGS and required a rebiopsy due to insufficient tissue sample were assumed to have received it.
The model assumed that patients who had a negative test for a mutation required a specialist visit for consultation on the following steps for care, and that patients who needed a rebiopsy required an outpatient visit to undergo the procedure. All patients were assumed to receive at least one specialist visit to discuss test results and steps for appropriate targeted therapy.
The model assumed that the option for patients to undergo a liquid biopsy (i.e. instead of a tissue biopsy) was only considered for patients who underwent testing with NGS in the model.
Model inputs
Population inputs
The total population is based on a hypothetical cohort of 1,000,000 adult patients insured through a blend of Medicare (N = 250,000) and commercial health plans (N = 750,000). Additional scenarios considered that 100% of patients were commercially insured or that 100% of patients were covered by Medicare. The proportion of adults with lung cancer was estimated based on publicly available data sources (i.e. Surveillance, Epidemiology, and End ResultsCitation1) among them, the proportion with NSCLC, as well as the proportion with mNSCLC, were estimated based on targeted literature review, which focused on publications within the last 5 years citing estimates of the prevalence of stages of lung cancer in the US. The proportion of adults enrolled in Medicare or a commercial insurance plan was separately estimated based on the National Health Insurance Survey and the US Census BureauCitation15,Citation16. Details for population inputs are provided in .
Table 1. Model input summary.
Clinical inputs
The proportion of patients undergoing each identified testing strategy was estimated based on literature and expert opinion. The proportion of patients requiring or receiving rebiopsy, those who fail rebiopsy, and the proportion of rebiopsies with associated complications were estimated based on targeted literature review. In addition, the time-to-test results for genetic testing, the rate of positive genomic identification per test type, and the time to rebiopsy were determined based on a targeted literature review. Details for clinical inputs are provided in .
Cost inputs
Costs associated with each specific type of test were based on publicly available CMS Physician and Clinical Lab Fee SchedulesCitation21,Citation23, as well as a targeted literature review. Separate estimates were used for Medicare and commercial payer perspectives. NGS testing costs were based on average costs of identified procedure codes, considering laboratory developed tests and commercial assays as well as smaller and larger panels (i.e. 5–50 genes and 50+ genes). Additionally, medical costs, including rebiopsy costs, rebiopsy-related complication costs, outpatient visit costs, specialist visit costs, and PD-L1 testing costs, were based on the CMS Physician Fee ScheduleCitation23 or a targeted literature review. Details for cost inputs are provided in .
Model outputs
The outputs from the decision tree model included the time to initiation of appropriate targeted therapy by type of testing strategy considered, as well as total costs per patient tested for the period from the start of testing until the initiation of appropriate targeted therapy (). For PCR total costs per patient was estimated for each individual type of testing strategy considered (i.e. sequential, exclusionary, and hotspot panel) as well as for all PCR testing strategies combined. Total costs per patient were estimated from a Medicare and a commercial payer perspective, combined (i.e. the blended population) and separately, and included testing costs, medical costs, and total costs of care (i.e. testing and testing-related medical costs). Costs were inflated to 2020 US dollars based on the medical care component of the Consumer Price Index.
Table 2. Model output summary.
A budget impact analysis was conducted to assess the effect of increasing the proportion of patients tested with NGS from the base case of 50–70%, with updated proportion of 5% sequential, 5% exclusionary, and 20% hotspot panel. The budget impact was estimated from a Medicare and a commercial payer perspective, combined (i.e. the blended population) and separately, using the cost per patient for each testing strategy and the updated proportion of patients adopting each testing strategy.
Of note, the sum of the number of patients for information such as the number of patients positively identified with a mutation for each PCR testing strategy may be slightly different than the result shown for all PCR testing strategies combined, due to rounding.
Sensitivity analysis
The robustness of results for the blended study population (i.e. Medicare and commercially insured patients combined) was assessed using a one-way sensitivity analysis (OSA) on key model inputs. By individually varying each model input independently, this analysis determined the impact each parameter had on the economic evaluation. Each input considered in the OSA was allocated a “high” and “low” value which corresponded to the upper and lower bounds based either on a targeted literature review, which focused on publications within the last 5 years, or predetermined threshold (e.g. ±20% of the base case). Key inputs of interest included rates of positive genomic identification, rebiopsy rates, testing costs, specialist costs, and outpatient visit costs (see Supplementary Table 1 for high and low values for each key model input). The analysis was conducted separately for NGS and all three PCR testing strategies combined.
Results
Among a hypothetical cohort of 1,000,000 members consisting of 250,000 members covered by Medicare and 750,000 members covered by a commercial insurance plan, 1,119 patients were estimated to have mNSCLC and be eligible for genetic testing. Based on a 100% Medicare perspective, 3,853 patients were included while from a 100% commercial perspective, 207 eligible patients were identified. Based on the blended population and a base case assumption that 50% of patients received NGSCitation12, 10% sequential testing, 10% exclusionary testing, and 30% hotspot panel, more patients tested positive for a mutation using NGS (N = 367) than PCR testing strategies (total N = 304; N = 59 for sequential testing, N = 59 for exclusionary testing, and N = 187 with hotspot panels). The estimated mean time to initiation of appropriate targeted therapy for NGS (2 weeks) was shorter compared to all PCR strategies (6 weeks; 9 weeks for sequential testing, 8 weeks for exclusionary testing, and 3 weeks for hotspot panels []).
Total cost of testing associated with NGS versus PCR testing strategies
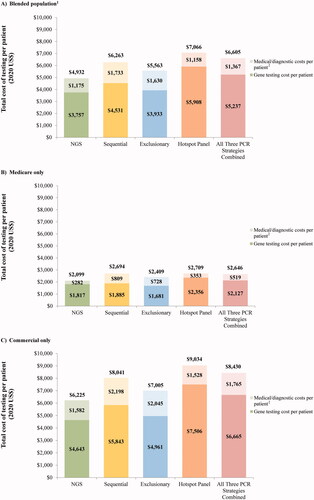
The results of the base case analysis (i.e. using the assumption that 50% are tested with NGS, 10% with sequential, 10% with exclusionary, and 30% with hotspot panel) are summarized in . Compared to all PCR testing strategies, NGS resulted in the lowest per patient total cost of testing at $4,932 versus $6,263 for sequential testing, $5,563 for exclusionary testing, and $7,066 for hotspot panel (). At the population level, the cost of testing totaled $2,758,429 for NGS compared to $3,694,610 for all PCR strategies combined. NGS was consistently the least expensive testing strategy regardless of the payer perspective assessed, whereby the per patient total cost of testing from a Medicare perspective was $2,099 for NGS versus $2,646 for PCR (sequential: $2,694, exclusionary: $2,409, hotspot panel: $2,709) (), and $6,225 for NGS versus $8,430 for PCR (sequential: $8,041, exclusionary: $7,005, hotspot panel: $9,034) from a commercial perspective ().
Costs for medical and PD-L1 IHC diagnostic services accounted for 24% of NGS total costs, 28% of sequential testing total costs, 29% of exclusionary testing total costs, and 16% of hotspot panel total costs; the remaining proportion of total costs was attributable to genetic testing costs (). For Medicare insured patients, costs for medical and PD-L1 IHC diagnostic services accounted for 13% and 20% of NGS and PCR total costs, respectively (), and for commercially-insured patients, they accounted for 25% and 21% of NGS and PCR total costs, respectively ().
Figure 1. Cost of testing per strategy. Abbreviations. NGS, next-generation sequencing; PCR, polymerase chain reaction. Notes. 1. The blended population assumed that 25% of members had Medicare coverage and 75% of members had commercial coverage. 2. Costs include rebiopsy, outpatient visit, specialist visits, and PD-L1 testing costs.
Budget impact analysis
The incremental budget impact when considering a higher proportion of patients tested with NGS – i.e. 70% versus 5% sequential testing, 5% exclusionary testing, and 20% using a hotspot panel – amounted to savings of $0.03 per member per month (PMPM; ), which corresponded to annual plan-level cost savings of $350,623 (). Cost savings at the plan- and member-level were higher for the Medicare population ($0.03 PMPM and $409,160 annually; , ) relative to the commercially insured population ($0.01 PMPM and $87,230 annually; , ).
Figure 2. Total budget impact for 50% versus 70% of patients tested with NGS. Abbreviations. NGS, next-generation sequencing; US, United States.
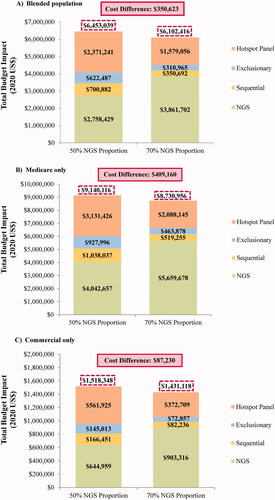
Table 3. Budget impact summary.
Sensitivity analysis
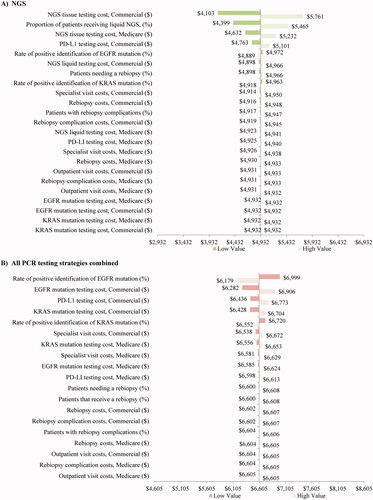
The sensitivity of per patient total costs of testing to changes in the main model inputs is presented for the blended population in . The per patient total cost of testing for patients tested with NGS ranged from $4,103 to $5,761 which was consistently lower than the per patient total cost of testing for patients tested with PCR strategies ($6,179–$6,999 per patient). The model inputs with the greatest impact on the per patient total cost of NGS were the tissue testing costs for Medicare and commercial plans, the proportion of patients receiving liquid NGS, and PD-L1 testing costs for commercial plans (). Model inputs that had the largest influence on the per patient total cost of testing for all PCR strategies combined included rate of positive EGFR mutation, as well as the testing costs for EGFR mutation, PD-L1, and KRAS mutation for the commercially insured population ().
Figure 3. Sensitivity analysis1 (blended population2 only). Abbreviations. NGS, next-generation sequencing; PCR, polymerase chain reaction. Notes. 1The low/high value thresholds used for the inputs in the sensitivity analysis were based on a targeted literature review or a predetermined threshold of ±20% (all inputs are defined in Supplementary Table 1). 2The blended population assumed that 25% of members had Medicare coverage and 75% of members had commercial coverage.
Discussion
Using a decision tree model, this study assessed the total cost of testing, including testing-related medical costs, associated with NGS versus sequential, exclusionary, or hotspot panel testing for newly diagnosed patients with mNSCLC. In a hypothetical cohort of 1,000,000 members insured through Medicare and commercial health insurance plans, NGS testing identified the largest number of patients who tested positive for a mutation, resulted in the lowest per patient total cost of testing, and was found to be associated with substantial cost savings from both payers’ perspectives. NGS was also associated with the fastest time to initiation of appropriate targeted therapy relative to PCR testing strategies.
Model results demonstrate that the total cost of testing per patient for a single NGS test was consistently lower than each individual PCR testing strategy, and for all PCR strategies combined, regardless of the payer perspective. Despite the model’s assumption that an equal proportion of patients underwent NGS versus all PCR strategies combined, the population-level total costs of testing were $2,758,429 versus $3,694,610, respectively. Considerable cost savings for Medicare and commercial payers were observed when a larger proportion of patients tested with NGS at the plan-level were considered in the budget impact analysis. Cost savings were higher for Medicare relative to the commercial population ($0.03 versus $0.01 PMPM). For all health plans, the results were robust to variations in the model’s key clinical and cost inputs, including testing costs and testing-related medical costs. The variation of NGS tissue and liquid testing costs (e.g. considering only laboratory developed tests as the low case or commercial assays as the high case) was found to have the greatest impact on the total cost of testing among patients undergoing testing with NGS. Testing costs for EGFR and KRAS mutation testing were found to have the greatest impact on the total cost of testing per patient for patients undergoing testing with PCR strategies. Nevertheless, across all scenarios and sensitivity analyses, estimated costs were found to be consistently lower for NGS compared to all PCR testing strategies combined.
The findings of the current analyses are consistent with the existing literatureCitation9,Citation10, including various cost analyses conducted outside the US, such as in Canada, Italy, and Singapore, which conclude that the use of NGS is associated with a reduction in costs and an increase in the detection of therapeutically relevant alterations and life-years relative to single gene testingCitation25–27. Specifically in the US, in a previous assessment of the economic impact of using NGS versus other strategies on testing costs in patients with mNSCLC, Pennell et al. reported substantial cost savings associated with upfront testing with NGS for both CMS and commercial payersCitation9. In a recent claims-based analysis, Dalal et al. similarly found that NGS resulted in the lowest cost per patient. From a commercial perspective, costs were $2,860 for NGS relative to $3,299 for sequential testing and $3,763 for exclusionary testing (2015 US$) while from a Medicare perspective, costs were $623 for NGS relative to $1,400 for sequential testing and $1,794 for exclusionary testing (2015 US$). Relative to Dalal et al.Citation10, the higher costs observed in the current study are partially explained by the increase in diagnostic testing costs, the incorporation of PD-L1 testing costs, as well as the inclusion of additional genomic alterations (Dalal et al. only included costs associated with EGFR, ALK, ROS1, KRAS, BRAF). Furthermore, by comparison to the work by both Pennell et al.Citation9 and Dalal et al.Citation10 the current model’s outputs were expanded to consider the total cost of care associated with testing, including medical costs associated with rebiopsy and rebiopsy-related complications, as well as outpatient and specialist visit costs; for NGS, liquid testing costs were also considered. In addition, the current analysis differs by prioritizing testing sequence alterations based on clinical guideline recommendationsCitation6, as opposed to alterations for which there are approved therapies by the US Food and Drug Administration.
Broad molecular profiling is crucial in identifying driver mutations that enable personalized treatment for patients with mNSCLC. Testing with NGS allows for the simultaneous screening of both common and less common alterations, which are less likely to be captured when using single-mutation testing strategies. Indeed, the current model shows that more patients tested positive for a mutation using NGS than for all other PCR testing strategies combined, thus leading to more patients receiving appropriate targeted therapy. Pennell et al. found that the cumulative time to receive full test results and initiate treatment, taking into account both testing time and time for rebiopsy, if needed, was nearly 3 weeks faster for NGS than exclusionary or sequential testingCitation9. Consistent with these results, the current model estimates that the time to initiation of appropriate targeted therapy per patient was shorter by 4 weeks for NGS (mean time: 2 weeks) compared to PCR testing strategies combined (mean time: 6 weeks). In a single institution, 5-year investigation of comprehensive genetic testing conducted in patients with mNSCLC, Vigneswaran et al. found that NGS correctly identified targetable genetic alterations in the majority of patients tested, in addition to detecting concomitant alterations and providing information on variants without active therapiesCitation28. By quickly identifying targetable mutations and motivating the development of novel therapies for those that are not currently actionable, the use of NGS as a broad molecular testing strategy has the potential to delay disease progression, which is associated with an incremental cost of $12,327 among patients with mNSCLCCitation29, thus resulting in further cost savings.
Together, the evidence demonstrates a robust clinical and economic value of adopting NGS for patients with mNSCLC. Moreover, while broad panel testing is ideally suited for mNSCLC due to the high number of actionable mutations and associated targeted therapies available, NGS is capable of informing patient care and guiding oncologists making cancer treatment decisions for patients with other tumor types, such as advanced refractory disease as well as rare solid tumors or hematologic malignanciesCitation30. Yet, several barriers limit its integration in clinical practice. In a cross-sectional online survey of a nationally representative sample of 201 physicians (oncologists, hematologists, surgeons, pathologists), 80% reported experiencing at least one barrier to testing with NGSCitation31. The most commonly reported barriers include limited reimbursement as well as lack of understanding and access to educational contentCitation31–33. There are also additional societal costs such as non-material infrastructure, operational, labor, and equipment maintenance costs that may have a potential impact on the use of NGS in clinical practiceCitation34. Policies that address these challenges and support the increased use of NGS in oncology practice warrant consideration.
Limitations
This study is subject to certain limitations. First, as the study is based on a modeling approach using a decision tree and budget impact framework, some model inputs and assumptions were based on expert opinion or data available in published literature and may contain uncertainty or may have limited generalizability. Robust analysis of accurate, real-life numbers would be necessary before definitive conclusions can be made; however, model results remained robust in sensitivity analyses. Second, the study population included all newly diagnosed patients with metastatic NSCLC and was not restricted to specific subgroups (e.g. adenocarcinoma or squamous cell carcinoma) among whom genetic testing recommendations are well established in guidelinesCitation6. Nonetheless, extending testing beyond solely patients with a definitive diagnosis of adenocarcinoma was recommended by expert consensus opinion, to avoid excluding patients who do not have a definitive diagnosis of adenocarcinoma and may benefit from targeted therapy. Furthermore, while restricting testing to fewer patients would decrease the plan-level costs for each testing strategy, this would not impact the finding that the cost of NGS testing per patient is lower than for PCR strategies. Third, the amount reimbursed for testing was estimated on the basis of either publicly available CMS information or commercial claims; therefore, the results may not be generalizable beyond the studied payers. Fourth, the current study considered DNA- or RNA-based NGS and did not consider combined DNA- and RNA-based testing modalities, the inclusion of which may have resulted in a higher testing cost for patients tested with NGS and a higher proportion of patients testing positive for a mutation. Future work should evaluate the cost impact of considering combined DNA- and RNA-based testing modalities. Fifth, results may not be generalizable to countries other than the US which may have different prevalence estimates, payer structures, reimbursement policies, and testing and medical costs. Sixth, the option of liquid biopsy was only considered for NGS, although PCR assays are available for liquid biopsy for some biomarkers in real-world practice. Seventh, the sensitivity and specificity of different testing modalities was not considered in the model. Finally, the model included only testing costs and not therapy costs or benefits associated with delayed progression, the inclusion of which would allow for an estimate of a wider spectrum of costs and is a topic for further research.
Conclusions
Using a decision tree model, this study showed that the use of NGS as a tool for broad molecular testing for newly diagnosed patients with mNSCLC resulted in more patients positively identified for a mutation and was associated with the lowest total testing cost per patient and fastest time to initiation of appropriate targeted therapy relative to PCR testing strategies. Cost savings associated with the use of NGS increased as the proportion of patients tested with NGS increased in the model. The results were robust with modifications to all model inputs and cost savings were observed for both Medicare and commercial payers in the US. Policies that aim to address barriers associated with the clinical adoption of NGS warrant consideration.
Transparency
Declaration of funding
This work was sponsored by Janssen Scientific Affairs, LLC. The sponsor was involved in the study design, interpretation of results, manuscript preparation, and publication decisions.
Declaration of financial/interests
JV is an employee of Janssen Scientific Affairs, LLC, ALS is an employee of Janssen Global Services, Inc., and both are stockholders of Johnson & Johnson.
BE, MHL, AH, PL and LM are employees of Analysis Group, Inc. a consulting company that has provided paid consulting services to Janssen Scientific Affairs, LLC., which funded the development and conduct of this study and manuscript.
Peer reviewers on this manuscript have received an honorarium from JME for their review work but have no other relevant financial relationships to disclose.
Author contributions
All authors have made substantial contributions to the conception or design of the study, or the acquisition, analysis, or interpretation of data, drafting the manuscript and revising it critically for important intellectual content, and have provided final approval of this version to be published and agree to be accountable for all aspects of the work.
BE, MHL, AH, PL, and LM contributed to the collection and assembly of data.
JV, ALS, BE, MHL, AH, PL, and LM contributed to study conception and design, data analysis and interpretation, writing and editing of the manuscript, and provided their final approval to submit this version of the manuscript.
Previous presentations
Some of the results were included in a poster presentation at the 2021 Academy of Managed Care Pharmacy (AMCP) NEXUS meeting, held October 18–21, 2021 at Gaylord Rockies, Denver, Co.
Supplemental Material
Download MS Word (29.1 KB)Acknowledgements
Medical writing assistance in the form of copyediting, editorial, and production assistance was provided by a professional medical writer, Loraine Georgy, PhD, an employee of Analysis Group, Inc., a consulting company that has provided paid consulting services to Janssen Scientific Affairs, LLC., which funded the development and conduct of this study and manuscript.
Data availability statement
The data underlying this article are available in the article and in its online supplementary material.
References
- Howlader N, Noone A, Krapcho M, et al. SEER cancer statistics review, 1975–2017. Bethesda (MD): National Cancer Institute; 2020.
- VanderLaan PA, Rangachari D, Majid A, et al. Tumor biomarker testing in non-small-cell lung cancer: a decade of change. Lung Cancer. 2018;116:90–95.
- Gregg JP, Li T, Yoneda KY. Molecular testing strategies in non-small cell lung cancer: optimizing the diagnostic journey. Transl Lung Cancer Res. 2019;8(3):286–301.
- National Cancer Institute. Non-small cell lung cancer treatment (PDQ®)-health professional version 2019. [cited 2019 Aug 6]. Available from: https://www.cancer.gov/types/lung/hp/non-small-cell-lung-treatment-pdq
- Nellesen D, Dea K, Guerin A, et al. Reimbursement landscape for molecular testing in non-small cell lung cancer (NSCLC). AJMC. 2018;24(2):SP37–SP42.
- Lindeman NI, Cagle PT, Aisner DL, et al. Updated molecular testing guideline for the selection of lung cancer patients for treatment with targeted tyrosine kinase inhibitors: guideline from the College of American Pathologists, the International Association for the Study of Lung Cancer, and the Association for Molecular Pathology. J Mol Diagn. 2018;20(2):129–159.
- Drilon A, Wang L, Arcila ME, et al. Broad, hybrid capture-based next-generation sequencing identifies actionable genomic alterations in lung adenocarcinomas otherwise negative for such alterations by other genomic testing approaches. Clin Cancer Res. 2015;21(16):3631–3639.
- Pennell NA, Arcila ME, Gandara DR, et al. Biomarker testing for patients with advanced non-small cell lung cancer: real-world issues and tough choices. Am Soc Clin Oncol Educ Book. 2019;(39):531–542.
- Pennell NA, Mutebi A, Zhou Z-Y, et al. Economic impact of next-generation sequencing versus single-gene testing to detect genomic alterations in metastatic non-small-cell lung cancer using a decision analytic model. JCO Precis Oncol. 2019;3:1–9.
- Dalal A, Guerin A, Mutebi A, et al. Economic analysis of BRAF gene mutation testing in real world practice using claims data: costs of single gene versus panel tests in patients with lung cancer. J Med Econ. 2018;21(7):649–655.
- Huang RSP, Severson E, Haberberger J, et al. Landscape of biomarkers in non-small cell lung cancer using comprehensive genomic profiling and PD-L1 immunohistochemistry. Pathol Oncol Res. 2021;27:592997.
- Bruno DS, Hess LM, Li X, et al. Racial disparities in biomarker testing and clinical trial enrollment in non-small cell lung cancer (NSCLC). J Clin Oncol. 2021;39(15_suppl):9005–9005.
- Luk PP, Yu B, Ng CC, et al. BRAF mutations in non-small cell lung cancer. Transl Lung Cancer Res. 2015;4(2):142–148.
- Awad MM, Oxnard GR, Jackman DM, et al. MET exon 14 mutations in non-small-cell lung cancer are associated with advanced age and stage-dependent MET genomic amplification and c-Met overexpression. J Clin Oncol. 2016;34(7):721–730.
- U.S. Department of Health and Human Services. Health insurance coverage: early release of quarterly estimates from the national health interview survey, January–March 2020. National Center For Health Statistics; 2020. Available from: https://www.cdc.gov/nchs/data/nhis/earlyrelease/insur202108-508.pdf
- U.S. Census Bureau. Current population survey; 2018. Available from: https://www.census.gov/programs-surveys/cps.html
- Duma N, Santana-Davila R, Molina JR. Non-small cell lung cancer: epidemiology, screening, diagnosis, and treatment. Mayo Clin Proc. 2019;94(8):1623–1640.
- Badawy AA, Khedr G, Omar A, et al. Site of metastases as prognostic factors in unselected population of stage IV non-small cell lung cancer. Asian Pac J Cancer Prev. 2018;19(7):1907–1910.
- Al-Kateb H, Nguyen TT, Steger-May K, et al. Identification of major factors associated with failed clinical molecular oncology testing performed by next generation sequencing (NGS). Mol Oncol. 2015;9(9):1737–1743.
- Kelly RJ, Turner R, Chen YW, et al. Complications and economic burden associated with obtaining tissue for diagnosis and molecular analysis in patients with non-small-cell lung cancer in the United States. JOP. 2019;15(8):e717–e727.
- Centers for Medicare & Medicaid Services. Clinical laboratory fee schedule. 2020. Available from: https://www.cms.gov/Medicare/Medicare-Fee-for-Service-Payment/ClinicalLabFeeSchedPayment/ClinicalLabFeeSched
- Cairns E. With its liquid biopsy approval, Foundation medicine takes on guardant 2020 [cited 2021 July 20]. Available from: https://www.evaluate.com/vantage/articles/analysis/spotlight/its-liquid-biopsy-approval-foundation-medicine-takes-guardant
- Centers for Medicare & Medicaid Services. Physician fee schedule. 2020. Available from: https://www.cms.gov/Medicare/Medicare-Fee-for-Service-Payment/PhysicianFeeSched
- Dusetzina SB, Basch E, Keating NL. For uninsured cancer patients, outpatient charges can be costly, putting treatments out of reach. Health Aff (Millwood)). 2015;34(4):584–591.
- Johnston KM, Sheffield BS, Yip S, et al. Comprehensive genomic profiling for non-small-cell lung cancer: health and budget impact. Curr Oncol. 2020;27(6):e569–e577.
- Pisapia P, Pepe F, Baggi A, et al. Next generation diagnostic algorithm in non-small cell lung cancer predictive molecular pathology: the KWAY Italian multicenter cost evaluation study. Crit Rev Oncol Hematol. 2022;169:103525.
- Tan AC, Lai GGY, Tan GS, et al. Utility of incorporating next-generation sequencing (NGS) in an Asian non-small cell lung cancer (NSCLC) population: incremental yield of actionable alterations and cost-effectiveness analysis. Lung Cancer. 2020;139:207–215.
- Vigneswaran J, Tan YH, Murgu SD, et al. Comprehensive genetic testing identifies targetable genomic alterations in most patients with non-small cell lung cancer, specifically adenocarcinoma, single institute investigation. Oncotarget. 2016;7(14):18876–18886.
- Fox KM, Brooks JM, Kim J. Metastatic non-small cell lung cancer: costs associated with disease progression. Am J Manag Care. 2008;14(9):565–571.
- Freedman AN, Klabunde CN, Wiant K, et al. Use of next-generation sequencing tests to guide cancer treatment: results from a nationally representative survey of oncologists in the United States. JCO Precis Oncol. 2018;2:1–13.
- Kaminski A, Szamreta EA, Shah R, et al. Barriers to next-generation sequencing despite increased utilization: U.S. physician survey results. J Clin Oncol. 2021;39(15_suppl):e18754–e18754.
- Messner DA, Koay P, Al Naber J, et al. Barriers to clinical adoption of next-generation sequencing: a policy Delphi panel’s solutions. Per Med. 2017;14(4):339–354.
- Gutierrez ME, Choi K, Lanman RB, et al. Genomic profiling of advanced non-small cell lung cancer in community settings: gaps and opportunities. Clin Lung Cancer. 2017;18(6):651–659.
- Johnston KM, Sheffield BS, Yip S, et al. Costs of in-house genomic profiling and implications for economic evaluation: a case example of non-small cell lung cancer (NSCLC). J Med Econ. 2020;23(10):1123–1129.