
Abstract
Objectives
(1) To descriptively compare the selected elements of valuation methods for EQ-5D-5L value set studies, (2) to compare the characteristics of the value sets, and (3) to examine the associations between the selected elements of valuation methods and the EQ-5D-5L value sets.
Methods
A systematic literature search of EQ-5D-5L valuation studies from 1 January 2009 to 22 April 2021 was conducted in selected databases. Following the initial search, we also explored additional studies published during the completion of the final version of the manuscript. Similarities and variations for selected elements of valuation methods were descriptively compared. The relative importance of dimensions, utility decrements between the levels, and distribution of the utility scores were used to compare value sets. A meta-regression analysis examined the associations between the selected methodological elements and the utility scores and dimension levels of EQ-5D-5L.
Results
A total of 31 studies were included in this review. Methodological similarities centered around data collection and preference elicitation method. On the other hand, variations include sampling technique, sample size, and value set modeling. The variations in value sets based on the relative importance of dimension, decrement in utility score, and distribution of utility score across countries were observed. Although the distribution of the utility scores differed across countries, higher levels of each dimension tended to have a larger decrement in the utility scores. Mean utility scores for the experience-based value sets were higher than those estimated using stated choice methods. The selected methodological elements were not significantly associated with the mean predicted utility scores or most dimension-level coefficients.
Conclusions
EQ-5D-5L health state valuation methods and characteristics of value sets differed across studies. The impact of the variation of methodological elements on the value sets should be further investigated.
Introduction
EQ-5D is a standardized multi-attribute utility instrument (MAUI) introduced by the EuroQol group in the late 1980s to describe a health state, for which a value can be attachedCitation1. It is composed of five dimensions, i.e. mobility (MO), self-care (SC), usual activities (UA), pain/discomfort (PD), and anxiety/depression (AD)Citation2. In the initial version (EQ-5D-3L), each dimension has three levels, i.e. no problems, some problems, and extreme problems/unable to, thus describing a total of 243 (35) possible health statesCitation2. The EQ-5D-3L also includes the patient’s self-rated health on EuroQol visual analog scale (EQ VAS) with values ranging from 0 (worst health state) to 100 (best health state), one can imagineCitation3,Citation4. However, given the problems of lack of sensitivity (unable to detect small or moderate changes in a person’s health) and presence of ceiling effect (clustering of scores towards the higher end of measurement and little differentiation for mild health states), the EQ-5D with five levels (EQ-5D-5L) was introduced in 2009Citation4–6. These five levels include no problems, slight problems, moderate problems, severe problems, and extreme problems, describing 3,125 (55) possible health statesCitation7. Five levels increase the sensitivity, reduce the ceiling effect, and improve the validity of the EQ-5DCitation5,Citation8. The most severe level of the MO dimension was changed from “confined to bed” to “unable to walk about” in EQ-5D-5L, enhancing its applicabilityCitation9. The instructions for the EQ VAS task of the EQ-5D-5L were simplified compared to EQ-5D-3L, making it easier to complete and scoreCitation2,Citation10.
Additionally, a standardized protocol was developed to introduce uniformity in the valuation methods, to support best practices, promote a high level of quality control, and facilitate comparability of value sets for the EQ-5D-5LCitation11–13. The computer-embedded EQ-5D-5L valuation protocol, also known as EuroQol Valuation Technique version 1.0 (EQ-VT v 1.0)Citation11, consists of five elements; (1) A general welcome, (2) Introduction, where participants self-report their health on the EQ-5D-5L descriptive system and EQ VAS and background question, (3) Instruction and example of time trade-off (TTO) task, TTO valuation of 10 EQ-5D-5L states, and debriefing/structured feedback, (4) An instruction of discrete choice experiment (DCE) task, DCE valuation of seven paired comparisons, three debriefing questions, and (5) A general thank you and goodbye. The EQ-5D-5L valuation protocol also consists of an interviewer instruction manual.
Experience from earlier valuation studies suggested that, apart from the complexity of the task, random error, and learning effect, the interviewer effect and quick task completion (satisficing) from the respondent may lead to large numbers of inconsistent responses with a detrimental effect on the data qualityCitation13. To address this challenge EQ-VT v 1.0 was updated to EuroQol Valuation Technique version 2.0 (EQ-VT v 2.0) and, more recently, EuroQol Valuation Technique version 2.1 (EQ-VT v 2.1)Citation13. Two major changes were introduced in EQ-VT v 2.0. First, three practice states followed by a wheelchair example and a feedback module were incorporated in the composite TTO (cTTO) task. Secondly, a quality control (QC) process was included after the end of the survey to review protocol compliance and interviewer effectCitation13. Interviews were flagged based on four QC criteria: (1) if there was no explanation of the worse than dead task (lead time) in the wheelchair example, or (2) too short a time was spent on the wheelchair example (less than 3 minutes), clear inconsistencies were noted in the cTTO ratings, and if all 10 cTTO tasks were completed in less than 5 minutesCitation13. Some countries employed the EQ-VT v 1.0, whereas those who conducted their valuation studies after the publication of the EQ-VT v 2.0 did so using the current version.
Despite the introduction of the standardized valuation protocol, value sets could still be artificially affected by the variations in the valuation methods or study designs that made a comparison of the preference value for health states across countries difficultCitation14–16. A study indicated that variation in preference elicitation technique (cTTO vs. DCE) or change in protocol might systematically affect the utilitiesCitation17. Previously, some studies examined the differences in health preference across countries for EQ-5D-5LCitation14,Citation18,Citation19. For instance, Yang et al.Citation18 suggested a considerable difference in the modeling and relative importance for EQ-5D-5L dimensions among the DCE-based preference studies in 11 Asian studies. Wang et al.Citation19 concluded that the TTO-based utility values for seven Asian countries differed. Similarly, a study conducted by Olsen et al.Citation14 suggests some similarities in EQ-5D-5L value sets across four of seven western countries (i.e. Canada, England, the Netherlands, and Spain). However, these studies only compared the characteristics of the value sets. To the best of our knowledge, methodological similarities and variations across all value set studies and the impact of such variation on the EQ-5D-5L value set has never been explored. A systematic comparison of EQ-5D-5L valuation methods, their value set, and the impact of methodological elements on the value sets can provide a better understanding of the common practice of valuation studies and promote informed comparison and use of health state values across countries. Such comparison would provide evidence for and against using value sets from another country if its own value set is not available. Additionally, the choice of valuation method may systematically influence economic analysis (i.e. cost-utility analysis), leading to erroneous decisionsCitation14,Citation20. Thus, the objectives of this study were (1) to descriptively compare the selected elements (i.e. general study characteristics, preference elicitation technique, value set modeling) of valuation methods for EQ-5D-5L value set studies, (2) to compare the characteristics of value sets based on the relative importance of the dimensions, relative utility decrement across levels and distribution of the utility scores, and (3) to examine the associations between the selected elements of valuation methods and the EQ-5D-5L value sets.
Methods
This systematic review followed Preferred Reporting Items for Systematic Reviews and Meta-Analyses (PRISMA) guidelinesCitation21.
Inclusion and exclusion criteria
This review included country-specific health state valuation studies that collected data from general populations using EQ-5D-5L to generate societal value sets until 22 April 2021, and EQ-5D-5L value studies published during the early versions of this manuscript. Exclusion criteria included studies that (1) generated EQ-5D-5L value sets by mapping EQ-5D-3L to EQ-5D-5L, (2) did not report any country-specific value sets, (3) assessed the feasibility of conducting health state valuation studies, (4) made comparisons across different methods, (5) compared the health state values derived from general and patient populations, (6) used primary data from valuation studies for secondary analyses, or (7) were not published in the English language.
Search strategy
Six bibliographic databases, including PUBMED, PsycINFO, CINAHL, EconLit, Cochrane Library, and Google Scholar, were searched from 1 January 2009 to 22 April 2021. Subject headings (MESH terms) and free texts (keywords) were used to reflect differences in indexing among databases. Key search terms included “EQ-5D-5L” alongside “valuation”, “value set”, or “tariff”. Targeted searches on individual websites were conducted to assess the grey literature. A hand search for references was performed to identify relevant articles. A detailed search strategy is presented in Supplement 1.
Study selection and data extraction
Two independent reviewers (NP and SMF) screened for titles and abstracts. Full-text articles were then critically reviewed by two independent researchers (NP and SMF), and a consensus was reached for rejection and retention decisions. Discrepancies between the reviewers were resolved by a consultation with the third reviewer (SN). Data extraction of the included studies was initially performed by one reviewer (NP).
A Microsoft Excel spreadsheet was developed to include the extracted data and was verified by the second reviewer (SMF). The Excel spreadsheet contained information regarding (1) general study characteristics – (a) sample: sampling method, number of responses analyzed, and (b) data collection: training for the interviewer, mode of data collection, EuroQol Valuation Technique (EQ-VT) used, QC procedure, hypothetical state (HS) versus own health state/experience (EB) approach used; (2) preference elicitation technique – (a) design: types of TTO, types of DCE, types of visual analog scales (VAS), number of valuation choices per respondent in each design, and (b) modeling approach: model used to derive value set; and (3) value set modeling – final model used to derive value set. Also, the reported value set and standard error for each country were extracted.
Quality assessment of included studies
All retained articles were assessed for methodological rigor using the Checklist for REporting VAluaTion StudiEs (CREATE) guidelineCitation22. The CREATE guideline consists of 21 items: descriptive system (two items), health states valued (three items), sampling (five items), preference data collection (two items), study sample (two items), modeling (five items), and value set (two items). Two reviewers (NP and SMF) independently evaluated the retained articles based on whether each item was present, and a consensus was reached. Any discrepancy between the two reviewers was resolved through discussion with the third reviewer (SN).
Comparison of EQ-5D-5L value sets studies
The similarities and variations of these selected methodological elements (i.e. sample, preference elicitation technique, value set modeling) of valuation methods were descriptively compared across studies. Given the difference in the valuation methods across countries, value sets derived from these methods were also compared. Value sets were compared based on the utility value for 3,125 health states derived from the scoring algorithm for each individual country or region. The relative importance of dimensions, utility decrements between the levels, and distribution of the utility scores were determined. The relative importance of dimension was estimated as the magnitude of utility decrement for each dimension. For example, the magnitude of utility decrement for MO was estimated as the difference between the first (11111) and fifth level (51111). This difference was then ranked from highest (most important) to lowest (least important) to derive the relative importance of dimension. Utility decrements between levels were estimated using a similar approach but for each level. The difference was then graphically presented, and the similarities and differences in utility change across countries were examined. Kernel density plots were constructed for the predicted utility of 3,125 health states which were then visually compared for distribution similarities and differences. Utility estimates were grouped across four continents, including Asia, Europe, America (North and South), and Africa, as countries within a similar geographical location, language, and cultural context, were expected to have some similarities in preferences.
Meta-regression analysis
To examine the effect of methodological elements or study characteristics on the mean of predicted utility scores and value set coefficients for the levels of EQ-5D-5L dimensions, we used meta-regression analysisCitation23,Citation24. Potential sources of heterogeneity in observed utility values and value set coefficients were explored by using Cochran’s Q test and I2 statistic in meta-regression analyses. Only valuation studies reporting both mean values and standard errors for value sets were included. The tested variables included sampling technique, sample size, the version of the standardized valuation protocol, QC procedure, and the final model used to derive the value set. Separately, each variable was regressed using a random-effects model to the mean of predicted utility scores and coefficients of the level of EQ-5D-5L dimensions. The models were fitted using R (4.0.3) packages “meta” with Restricted Maximum Likelihood Estimation (REML) and the Knapp-Hartung method. A two-sided p-value of <.05 was considered statistically significant.
Results
Retained studies
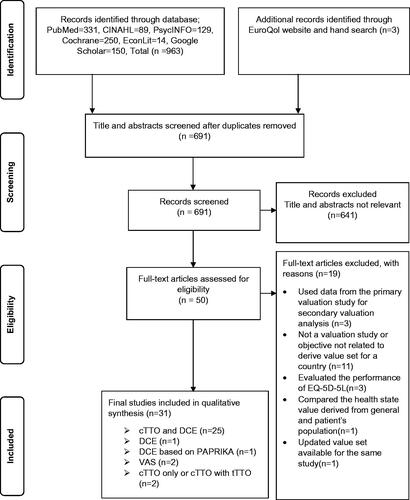
The PRISMA flow diagram () depicts the literature search/review tiers and rejection reasons. The initial search resulted in 963 studies. One additional study was identified during the reference search; however, it was removed at the title and abstract screening step since no full text was available in the English languageCitation25. This final version of the manuscript contained two additional articles published following the first version of the manuscriptCitation26,Citation27. After screening for titles and abstracts, 50 articles were selected for the full-text review. Subsequently, 19 articles were removed based on the exclusion criteria. A total of 31 articles that determined the value sets using EQ-5D-5L were incorporated in the final version of the manuscriptCitation9,Citation15,Citation16,Citation26–53. Several other studies were in progress during our study period.
Figure 1. PRISMA flow diagram of study selection process. Abbreviations. cTTO, Composite Time Trade-Off; DCE, Discrete Choice Experiment; PAPRIKA, Potentially All Pairwise RanKings of all possible Alternatives; PRISMA, Preferred Reporting Items for Systematic Reviews and Meta-Analyses; tTTO, Traditional Time Trade-Off; VAS, Visual Analog Scale.
Retained studies were from 29 countries or regions, including CanadaCitation53, ChinaCitation42, DenmarkCitation37, EgyptCitation28, EnglandCitation33, EthiopiaCitation51, FranceCitation9, GermanyCitation39,Citation41, Hong KongCitation52, HungaryCitation48, IndonesiaCitation46, IrelandCitation36, JapanCitation15, TaiwanCitation40, ThailandCitation44, the NetherlandsCitation16, MalaysiaCitation49, MexicoCitation27, New ZealandCitation50, PeruCitation29, PolandCitation35, PortugalCitation34, KoreaCitation38, SpainCitation47, SwedenCitation31, UgandaCitation26, UruguayCitation30, the USCitation32,Citation45, and VietnamCitation43. The majority of these studies used EQ-VT (n = 27) to derive the value set, however, four studiesCitation31,Citation32,Citation39,Citation50 used other methods. Studies were published in the PharmacoEconomics (n = 9), Value in Health (n = 8), or Other (n = 14) journals. The majority of the studies (n = 26) were cofounded by the EuroQol.
Quality of the retained studies
A total of 26 studiesCitation9,Citation16,Citation26–31,Citation33,Citation35–38,Citation40–49,Citation51–53 reported 17 (80%) or more of the CREATE items. The remaining five studiesCitation15,Citation32,Citation34,Citation39,Citation50 reported 13–16 items (60%). The least frequently reported items were the response rate and model specification (details in Supplement 2).
EQ-5D-5L valuation methods across studies using EQ-VT
summarizes the selected methodological elements of the included studies.
Table 1. Evidence table summarizing the methodological elements of EQ-5D-5L for the retained studies (n = 31).
Sampling technique and sample size
Most EQ-VT studies used a stratified sampling method (n = 15) – multistage stratified, stratified quota, stratified cluster, or stratified random sampling. However, other studies used diverse sampling techniques, such as quota sampling, random sampling, and unspecified. Sample sizes used to derive final value sets differed across studies. The majority of the studies (n = 21) had a sample size of at least 1,000 participants or higher. However, six studies had less than 1,000 participants, most (n = 4) of them used EQ-VT v 1, i.e. EQ-VT v 1.0 or EuroQol Valuation Technique version 1.1 (EQ-VT v 1.1).
Data collection
All EQ-VT studies (n = 27) used the computer-assisted personal interviewing (CAPI) method to collect data. In almost all these studies (n = 25), interviewers were trained. However, variations in the protocol version were observed: EQ-VT v 1.0 (n = 5), EQ-VT v 1.1 (n = 4), EQ-VT v 2.0 (n = 11), EQ-VT v 2.1 (n = 5), portable EQ-VT 2.1 (n = 1), and EQ-VT Lite (n = 1). The majority (n = 22) of these studies used EuroQol Group’s QC procedure to assess the quality of the data. The QC procedures in five studiesCitation16,Citation33,Citation42,Citation47,Citation53 were not specified or used market research companies; they all used the EQ-VT v 1.0.
Preference elicitation
All EQ-VT studies (n = 27) used a stated preference-based approach that asked respondents to value HS. Most of the studies (n = 25) used both cTTO and DCE to elicit preferences. One study used traditional TTO (tTTO) along with cTTOCitation53, while the other used a lite version of the protocol with cTTOCitation26. For the cTTO task, primarily, a total of 86 health states – 80 health states generated through simulation, five mild (only one dimension at level 2 and all others at level 1, e.g. “11112”), and one pit state (55555) – were divided into 10 blocks. Each block included 10 unique health states – eight random states, one mild state, and one pit state – and was presented to the respondents during the interview. The Lite version of the cTTO task consists of 91 health states with 20 health states per blockCitation26. For the DCE task, most of the studies (n = 24) generated 196 health states and divided them into 28 blocks, resulting in seven pairs in each block. Each participant completed one block during the interview. No opt-out alternative was included in the DCE. One of the studies that used the EQ-VT v 2.0 added six choice tasks, including duration and a death alternativeCitation41, while participants in another study completed a DCE task with 10 latent-scale pairs and 12 matched pairs (34 choice tasks in total)Citation29. For one study that used tTTO along with cTTO, the number of tTTO tasks per respondent was unclearCitation53.
Of the 27 EQ-VT studies that used TTO as a preference elicitation technique, 13 studies used Tobit regression to develop their preference modelsCitation9,Citation16,Citation26,Citation29,Citation34,Citation37,Citation40,Citation41,Citation43,Citation45,Citation46,Citation48,Citation52. The other 14 studies used various regression techniques, including multilevel, linear, nonlinear, robust, linear mixed, heteroskedastic, ordinary least square, and mixed effect models. Among the 24 studies using DCE as a preference elicitation technique, 15 used a conditional logit model (CLM). Of the remaining nine studies, three studies used either the logit model (LM) Citation43, mixed logit model (ML)Citation45, or Zermelo-Bradley-Terry (ZBT)Citation29 model to analyze DCE data, whereas six studies did not specify any model type.
Value set modeling
The hybrid regression model (n = 15) was most frequently used to generate final value setsCitation9,Citation33–37,Citation40,Citation41,Citation43,Citation44,Citation46,Citation47,Citation49,Citation51,Citation52. The other 12 studies used various modeling approaches, including non-linear, robust regression, linear mixed, Tobit, linear, and heteroscedastic models. Two studies also included interaction terms in their final value set modelsCitation38,Citation53.
EQ-5D-5L valuation methods across studies that did not use EQ-VT
Sampling technique and sample size
Four studies did not use EQ-VTCitation31,Citation32,Citation39,Citation50. The sample size for these studies ranges between 2,468 and 25,867.
Data collection
Data were collected using a self-administered online survey or paper/postal survey. Of four studies, one study described the QC procedure and used self-developed procedures, such as removing responses from participants who provided inconsistent responses to validity questions, etc.Citation50.
Preference elicitation
Two studiesCitation32,Citation50 used a stated preference-based approach while the other two studiesCitation31,Citation39 used revealed preference or participants EB to generate the final value sets. DCE or DCE with PAPRIKA onlyCitation32,Citation50 was used to elicit preference from HS, whereas TTO and VASCitation31, or VAS onlyCitation39, were used to elicit preference from EB. For two studies that used DCE, one study elicited preference using 20 choice tasks and no opt-out option for each participantCitation32, while another study used an adaptive DCE, and the number of choice tasks differed across participantsCitation50. For a study that used TTO with VAS to elicit experience-based preference, one task each was presented to respondentsCitation31. The number of choice tasks for a VAS-based study remains unclearCitation39.
One study used ordinary least squares to model TTO based preference dataCitation31, whereas a DCE-based study used ZBTCitation32. The specific regression techniques used to model TTO and DCE data in three studies were not specified. Two studies used VAS as a preference elicitation method and used a generalized linear model (GLM)Citation39 or ordinary least square (OLS)Citation31 model to analyze preference data.
The value set modeling
OLS, ZBT, and GLM were used to generate final value sets among three studies. The modeling approach for the final value set in one study was not specifiedCitation50. Three studies included interaction terms in their final value setCitation31,Citation32,Citation39.
EQ-5D-5L value sets across countries (EQ-VT and non-EQ-VT)
The Asian continent or regions consisted of China, Hong Kong, Indonesia, Japan, Korea, Malaysia, Taiwan, Thailand, and Vietnam. The European continent included 11 countries, i.e. Denmark, England, France, Germany, Hungary, Ireland, Netherlands, Poland, Portugal, Spain, and Sweden. Canada, Mexico, Peru, Uruguay, and the US were grouped as American continents. New Zealand was also included in this group since it has geographical proximity to America, uses English as an official language, and is a developed country. The African continent included Egypt, Ethiopia, and Uganda. Among the retained studies, studies from Germany and the US had two value sets for their general populations, based on HS versus EB. EB-based studies for Germany and the US were published a year earlier than HS-based value sets. These studies were primarily conducted to elicit preference from the patients population to evaluate their own healthCitation39 or improve the valuation methodCitation32. Since the VAS-derived value set of Sweden was not rescaled to 0 and 1, it was excluded from the comparison of the value sets across countries.
The relative importance of the dimensions
summarizes the relative importance of the dimension across retained studies. MO was ranked as the most important dimension in all nine countries in Asian continents, followed by PD in six countries. SC and UA were the least important in eight out of nine countries. Among 12 studies from 11 countries in European continents, PD was ranked the most important dimension in seven studies and the second most important dimension in five studies. UA was the least important in nine studies. Among seven studies from five countries in the American continent, PD was the most important dimension in five studies, whereas UA was the least important in five studies. For three countries in the African continent, the relative importance of health state dimensions varied across countries.
Table 2. Summary characteristics of the value sets based on utility score (n = 31).
Relative utility decrement across the level
The utility decrement reflects the general population preference for severity across health state levels from one level to another. Supplement 3(A) shows the trend in the utility decrement in level for countries across different continents. In general, some similarities were observed in the decreases in health state utility levels from full health (11111) to worst states in each dimension, e.g. MO (51111), SC (15111), UA (11511), PD (11151), AD (11115). The utility decrements were greater for higher levels across dimensions, e.g. from level 3 to level 5 compared to level 1 to level 3.
Also, variations in the utility decrements were observed across countries within the same continent. The utility decrements between level 1 to level 5 were similar across the Asian continent, except China, Japan, and Korea. Compared to other countries, the utility decrement from level 2 to level 3 across each dimension was relatively higher for China, while the utility decrement from level 3 to level 5 was relatively lower for Japan and the utility decrement from level 1 to level 3 was relatively higher for Korea. The utility decrements for the countries in European continent, especially Sweden, Germany, and Hungary, tended to differ. Compared to other countries in the European continent, the utility decrements from level 3 to level 5 for MO and PD dimensions were relatively lower for Sweden and Germany that derived EB value set. The highest utility decrement for Hungary was found in the MO dimension from level 3 to level 5. For the SC dimension, the utility decrement from level 3 to level 5 was relatively lower for Sweden but was higher for Hungary. For countries in the American and African continent, the utility decrements across levels and dimensions varied, with noticeably larger utility decrements for Peru moving from level 1 to level 5 across all dimensions. Uganda showed a relatively larger utility decrement for PD moving from level 3 to 5.
Distribution of the utility scores
Supplement 3(B) presents Kernel density plots of the utility scores across countries and continents. Three distinct preference patterns in Asia emerged. Japan and Korea seemed to have similar utility distributions. Similarly, Indonesia, Hong Kong, and Taiwan had similar preference distribution curves, as did Thailand, Malaysia, China, and Vietnam. The utility curves for Japan and Korea were pointed, and the mean utility score was higher, suggesting better health states among a larger number of individuals. On the other hand, the utility curves for Taiwan, Indonesia, and Hong Kong were flatter, with a large percentage of the respondents with the utilities of health states less than 0. The utility distribution curves for Thailand, Malaysia, China, and Vietnam were between the two groups. In the European continent, except for Germany, Sweden, and Ireland, the distributions of utility scores were similar. For Germany and Sweden that elicited EB value sets, the utility distributions for health states were different. They were steeper and had higher mean utility scores. The kernel distribution plots for Ireland and Hungary were flat, while the distribution curves for France and Poland were not smooth. The utility distributions for England and Spain seemed to be similar. In the American continent, the utility distributions of Mexico, New Zealand, Peru, and the US were similar. Still, they differed from the DCE-based utility distribution for the US and the utility distributions for Canada and Uruguay. Also, the distribution curves for Uruguay and Canada were pointed, with higher utility means. The utility distributions for Ethiopia and Egypt were similar, with Uganda having a slightly flatter distribution curve.
Factors associated with utility scores
shows the meta-regression results. Only studies that used EQ-VT were included in the meta-regression analysis to minimize the amount of between-study heterogeneity, i.e. heterogeneity between studies eliciting HS versus EB. A total of 17 studies were included in the meta-regression analysisCitation16,Citation27,Citation28,Citation30,Citation33–37,Citation41–45,Citation48,Citation49,Citation52. Compared to protocol version 1, the standardized protocol version 2 tended to have a lower mean of predicted utility scores of 3,125 health states (β = –0.099, p = .067, I2 = 0%) but was not statistically significant at the alpha level of .05.
Table 3. Results for meta-regression analysis (n = 17).
Additionally, the protocol version, QC procedure, and final value set model were significantly associated with some levels across different dimensions, including SC5, UA3, UA4, and PD5. Compared to the studies using protocol version 1, the studies using protocol version 2 tended to have a higher value set coefficient for PD5 (β = 0.137, p < .01, I2 = 99.96%). The studies using the EuroQol QC procedure tended to have a higher value set coefficient for SC5 (β = 0.065, p < .05, I2 = 99.86%) than those that did not use this procedure. The studies using the hybrid model tended to have a lower value set coefficient for SC3 (β = –0.021, p < .063, I2 = 90.23%), UA3 (β = –0.029, p < .01, I2 = 85.87%), and UA4 (β = –0.048, p < .05, I2 = 96.89%), as compared to those using other methods, however, SC3 was not statistically significant at the alpha level of 0.05. Except for mean utility, I2 values were greater than 90% and had significant value for Cochran’s Q test (p < .001). However, the sampling technique and the sample size were not associated with the utility scores. Details for meta-regression analysis are presented in Supplement 4.
Discussion
This systematic review compared a group of selected elements of EQ-5D-5L valuation methods (i.e. general study characteristics, preference elicitation technique, the value set modeling) and value sets among value set studies from various countries. The impacts of the methodological elements on the derived value sets of EQ-5D-5L were also examined using meta-regression analyses. Based on the CREATE criteria, the methodological quality of these studies was of relatively high quality (met at least 13 of 21 criteria).
The retained studies frequently used the EQ-VT. The primary reason was the experiences accumulated during the EQ-5D-3L valuation led to the realization that a standardized approach for the EQ-5D-5L valuation could ensure data qualityCitation13. Improvement in the data quality would subsequently lead to improved quality of economic evaluation for health technology assessment, promote the comparison of the value sets across countries, and explore the influences of cultural and other factors on health state values. The similarities observed across the retained studies using the EQ-VT centered around data collection and preference elicitation methods. One explanation might be that these methodological components were less likely to depend on countries contexts after the studies chose to follow a protocol. However, it should be noted that some methodological variations might be inevitable given the different local contexts or different EQ-VT versionsCitation14,Citation24,Citation54. However, such variations tend to decrease over time. One of the reasons might be that a feedback module was added to the EQ-VT v 2 (EQ-VT v 2.0 or EQ-VT v 2.1) to control data quality. Studies using this version might provide more robust data and fewer inconsistent responses. In other cases, avoidable variations could impact value sets. For example, the training times for interviewers varied from 4 hoursCitation9 to 3 daysCitation49. Interviewer bias and framing effect could be higher if the training times for interviewers was shorter. Therefore, those studies with shorter training hours could potentially have more interviewers bias and framing effect than those with more hours of interviewers training, undermining data quality. Previous literature recommended the multiday training workshop with a detailed discussion of the interviewer script and demonstration, pilot study, and feedback opportunitiesCitation12.
Almost all retained studies using the EQ-VT used the cTTO with DCE as the preference elicitation method. One study using the EQ-VT v 1.0 used tTTO and cTTO to elicit preferences. A study reported that tTTO had a lower bound of negative infinity and required rescalingCitation12 and thus might impact the value set. However, this study was among the early wave of valuation studies. It was possible that, during this period, the impact of methodological variation on the value set was not properly established. Two studies using cTTO and DCE also included additional paired comparisons for respondents. The purpose of this addition was not specifiedCitation29,Citation41. However, such addition was prone to produce low utility values and could increase the complexity of DCE tasks for participantsCitation55,Citation56.
On the other hand, the sampling method, sample size, and value set modeling varied among the retained studies. One explanation could be that different countries had different resources to determine sampling methods and sample sizes. Another reason might be that an earlier wave of valuation studies, despite using the most recent valuation protocol of the time, was unlikely aware of the impact of the sampling procedure on the value sets. All studies, except one using EQ-VT v 2, included about 1,000 samples. Countries with resources constraints, such as Uganda and Ethiopia, tended to use a portable version of the valuation protocol. On the other hand, the sample sizes of those studies that did not use the EQ-VT were much larger than 1,000. These studies were conducted in Germany, Sweden, New Zealand, and the US. Since these sample sizes were large, these studies used either online or paper-based surveys instead of CAPI. Germany and Sweden used an entirely different valuation approach, with respondents valuing a single state instead of a set of health states, to estimate the EB value set. Although this alternative approach offered certain benefits, it needed a different sampling approach to ensure generalizability or derive the country-specific value set. This might be why a high number of representative samples were selected. The variation of the value set modeling was expected due to the variation of data across the retained studies. Interestingly, the variation tended to occur more within the first wave of valuation studies using EQ-VT v 1, whereas almost all studies using EQ-VT v 2 used a hybrid model. One explanation could be that the hybrid model using both cTTO and DCE data would reduce logical inconsistency. Furthermore, two studies using EQ-VT v 1 included interaction terms in the final value set models. One of the reasons could be that these studies tried to optimize the modelsCitation45. However, previous studies showed the improvement in the model performance with interaction term was marginalCitation30,Citation33,Citation57,Citation58.
Four other studies did not use the EQ-VT. They intended to derive value sets or develop a cost-effective valuation approach that was cognitively less burdensome to the respondentsCitation31,Citation32,Citation39,Citation50. EB valuation completely deviated from the quality-adjusted life-year (QALY) maximization approach to value the health states respondents currently experienced during the study. Additionally, regulatory context might also drive the choice of valuation method. For example, the QALY-based value set was preferred by the National Institute for Health Care Excellence (NICE) in the UK, whereas the Swedish Dental and Pharmaceutical benefits Agency preferred EB value sets. Also, this review implied that other country contexts, e.g. culture, resources, and need, should be considered when choosing a valuation method. For example, “full health” was not interpreted similarly in Arabic; thus, the cTTO based preference elicitation task might be interpreted differently, requiring an adaptation of the protocol to be used in a certain country, e.g. the United Arab Emirates, a Muslim majority country, which rarely valued any health states that were worse than deathCitation59.
The comparison of the value sets across countries in this study was based on the relative importance of dimensions, utility decrements between the levels, and distribution of the utility scores. MO was the most important dimension among countries in the Asian continent, followed by the PD, whereas PD was the most important dimension across the majority of countries in the Europe and America continents. UA was the least important dimension across countries. This finding was consistent with previous studies by Yang et al.Citation18 and Wang et al.Citation19 for Asian countries and Olsen et al.Citation14 for western countries. Constraints in the infrastructure, such as transportation systems, might be one of the possible reasons for the higher importance of the mobility dimension among Asian countriesCitation46. Study findings also suggested that the utility decrements of the higher levels of each dimension tended to be larger across countries. One possible reason might be that the utility of the improvement from a poorer health state was likely valued higher. Additionally, the distribution of the utility scores varied across countries. People from different countries might value health states differently. While a previous study noted that differences in the health utilities were not explained by the national cultural valuesCitation17, other studies reported that utility values were associated with cultural differences, e.g. referenceCitation60. Therefore, a possible reason for variation in the distribution of utility could be due to the variation of valuation methods. One example found in this review was that the value sets derived from the EB method tended to be higher than those estimated using stated choice methods, consistent with the findings in a previous studyCitation61. Another example might be the language used in the translation of EQ-5D-5L, as it was not always possible to find identical termsCitation62.
Interestingly, the meta-regression results showed that the EQ-VT v 2 protocol studies tended to have a lower value of mean predicted utility, although it was not statistically significant. Additionally, our findings suggested that differences in the methodological elements (EQ-VT version, QC procedure, and value set modeling) were significantly associated with the higher levels (SC5, UA3, UA4, and PD5) of some dimensions. These observations suggested that some elements of the valuation method could be the potential source of variation in value sets.
Future valuation studies and users of this value can benefit from this review. First, the significant impact of EQ-VT v 2 on the fifth level of SC and PD highlights that any change in methodological procedure (i.e. the introduction of QC procedure) might have an impact on the value sets. Secondly, future studies can review the summary of potentially differentiating factors, such as sample size, sampling methods, data collection procedure, preference elicitation methods, and modeling technique. Third, we also observe that utility for the EB values set had a higher mean utility distribution than those studies that derived utility values from EQ-VT. Among studies that used EQ-VT, utility values obtained with EQ-VT v 1 tended to be higher than the EQ-VT v 2. Future researchers and users of the value set thus should note that the tendency of higher utility due to these specific approaches would impact economic evaluation as such cost-utility analysis and eventually affect decision-makingCitation14,Citation20. Fourth, the variation in the value set across studies in countries with different cultural contexts suggested the need for country-specific value sets for cost-utility analysis.
This systematic review suffered from three major limitations. First, there was a potential selection bias regarding articles included in this review. Primarily, this was due to our inclusion and exclusion criteria. For example, only studies conducted among the general populations were included, resulting in removing any valuation studies focusing on patients. The second limitation was that only specific elements of valuation methods of the retained studies were included in this review. Thus, they might not capture all methodological variations of these studies. Another limitation was that each meta-regression analysis had only one predictor variable due to the limited sample size. In other words, the meta-regression results in this study might not be robust, and further research is needed when more valuation studies are available.
Conclusions
EQ-5D-5L health state valuation methods and characteristics of value sets differed across studies. The use of EQ-VT v 2 tended to improve design similarities to reduce heterogeneity. Methodological elements were unlikely associated with the predicted utility scores and coefficients of EQ-5D-5L dimensions. The impact of variation of methodological elements on the value sets should be further investigated.
Transparency
Declaration of funding
The authors received no financial support for this research.
Declaration of financial/other interests
The authors report there are no competing interests to declare. Peer reviewers on this manuscript have no relevant financial or other relationships to disclose.
Author contributions
Concept and design: NP, SN. Acquisition of data: NP, SMF. Analysis and interpretations of data: NP, SMF, JQ, GK, NC, SN. Drafting of the manuscript: NP, SN. Critical revision of the paper for important intellectual content: NP, SMF, JQ, GK, NC, SN. Statistical analysis: NP. Provision of study materials or patients: Not applicable. Obtaining funding: Not applicable. Administrative, technical, or logistic support: Not applicable. Supervision: SN. Other: Not applicable.
Supplemental Material
Download MS Word (275.9 KB)Acknowledgements
The authors want to thank and acknowledge Ms. Adelia Grabowsky, Health Science Librarian and Associate Professor at Auburn University, for her time and expertise in developing the search strategy used in this systematic review.
Data availability statement
All data generated or analyzed during this study are included in this published article.
References
- Devlin NJ, Brooks R. EQ-5D and the EuroQol group: past, present and future. Appl Health Econ Health Policy. 2017;15(2):127–137.
- Brooks R. Book title the EuroQol group after 25 years. 1st ed. Dordrecht: Springer; 2013.
- Feng Y, Parkin D, Devlin NJ. Assessing the performance of the EQ-VAS in the NHS PROMs programme. Qual Life Res. 2014;23(3):977–989.
- Herdman M, Gudex C, Lloyd A, et al. Development and preliminary testing of the new five-level version of EQ-5D (EQ-5D-5L). Qual Life Res. 2011;20(10):1727–1736.
- Janssen MF, Pickard AS, Golicki D, et al. Measurement properties of the EQ-5D-5L compared to the EQ-5D-3L across eight patient groups: a multi-country study. Qual Life Res. 2013;22(7):1717–1727.
- Selivanova A, Buskens E, Krabbe PFM. Head-to-head comparison of EQ-5D-3L and EQ-5D-5L health values. Pharmacoeconomics. 2018;36(6):715–725.
- Mulhern B, Feng Y, Shah K, et al. Comparing the UK EQ-5D-3L and English EQ-5D-5L value sets. Pharmacoeconomics. 2018;36(6):699–713.
- Thompson AJ, Turner AJ. A comparison of the EQ-5D-3L and EQ-5D-5L. Pharmacoeconomics. 2020;38(6):575–591.
- Andrade LF, Ludwig K, Goni JMR, et al. A French value set for the EQ-5D-5L. Pharmacoeconomics. 2020;38(4):413–425.
- Feng Y, Devlin NJ, Shah KK, et al. New methods for modelling EQ-5D-5L value sets: an application to English data. Health Econ. 2018;27(1):23–38.
- Oppe M, Devlin NJ, van Hout B, et al. A program of methodological research to arrive at the new international EQ-5D-5L valuation protocol. Value Health. 2014;17(4):445–453.
- Oppe M, Rand-Hendriksen K, Shah K, et al. EuroQol protocols for time Trade-Off valuation of health outcomes. Pharmacoeconomics. 2016;34(10):993–1004.
- Stolk E, Ludwig K, Rand K, et al. Overview, update, and lessons learned from the international EQ-5D-5L valuation work: Version 2 of the EQ-5D-5L valuation protocol. Value Health. 2019;22(1):23–30.
- Olsen JA, Lamu AN, Cairns J. In search of a common currency: a comparison of seven EQ-5D-5L value sets. Health Econ. 2018;27(1):39–49.
- Shiroiwa T, Ikeda S, Noto S, et al. Comparison of value set based on DCE and/or TTO data: scoring for EQ-5D-5L health states in Japan. Value Health. 2016;19(5):648–654.
- Versteegh MM, Vermeulen KM, Evers SM, et al. Dutch tariff for the five-level version of EQ-5D. Value in Health. 2016;19(4):343–352.
- Roudijk B, Donders ART, Stalmeier PFM. Cultural values: can they explain differences in health utilities between countries? Med Decis Making. 2019;39(5):605–616.
- Yang Z, Purba FD, Shafie AA, et al. Do health preferences differ among Asian populations? A comparison of EQ-5D-5L discrete choice experiments data from 11 Asian studies. Qual Life Res. 2022;364:2.
- Wang P, Liu GG, Jo MW, et al. Valuation of EQ-5D-5L health states: a comparison of seven asian populations. Expert Rev Pharmacoecon Outcomes Res. 2019;19(4):445–451.
- Devlin N, Brazier J, Pickard AS, et al. 3L, 5L, what the L? A NICE conundrum. Pharmacoeconomics. 2018;36(6):637–640.
- Moher D, Liberati A, Tetzlaff J, et al. Preferred reporting items for systematic reviews and Meta-analyses: the PRISMA statement. BMJ. 2009;339:b2535.
- Xie F, Pickard AS, Krabbe PF, et al. A checklist for reporting valuation studies of multi-attribute utility-based instruments (CREATE). Pharmacoeconomics. 2015;33(8):867–877.
- Deeks JJ, Higgins JP, Altman DG. Chapter 10: Analysing data and undertaking meta-analyses; 2022.
- Xie F, Gaebel K, Perampaladas K, et al. Comparing EQ-5D valuation studies: a systematic review and methodological reporting checklist. Med Decis Making. 2014;34(1):8–20.
- Ikeda S, Shiroiwa T, Igarashi A, et al. Developing a Japanese version of the EQ-5D-5L value set. J Natl Inst Public Health. 2015;64(1):47–55.
- Yang F, Katumba KR, Roudijk B, et al. Developing the EQ-5D-5L value set for Uganda using the “lite” protocol. Pharmacoeconomics. 2022;40(3):309–321.
- Gutierrez-Delgado C, Galindo-Suárez RM, Cruz-Santiago C, et al. EQ-5D-5L Health-State values for the mexican population. Appl Health Econ Health Policy. 2021;19(6):905–914.
- Al Shabasy SA, Abbassi MM, Finch AP, et al. The EQ-5D-5L Valuation Study in Egypt. Pharmacoeconomics. 2021;39(5):549–561.
- Augustovski F, Belizán M, Gibbons L, et al. Peruvian valuation of the EQ-5D-5L: a direct comparison of time trade-off and discrete choice experiments. Value Health. 2020;23(7):880–888.
- Augustovski F, Rey-Ares L, Irazola V, et al. An EQ-5D-5L value set based on Uruguayan population preferences. Qual Life Res. 2016;25(2):323–333.
- Burström K, Teni FS, Gerdtham UG, et al. Experience-based Swedish TTO and VAS value sets for EQ-5D-5L health states. Pharmacoeconomics. 2020;38(8):839–856.
- Craig BM, Rand K. Choice defines QALYs: a US valuation of the EQ-5D-5L. Med Care. 2018;56(6):529–536.
- Devlin NJ, Shah KK, Feng Y, et al. Valuing health-related quality of life: an EQ-5D-5L value set for England. Health Econ. 2018;27(1):7–22.
- Ferreira PL, Antunes P, Ferreira LN, et al. A hybrid modelling approach for eliciting health state preferences: the Portuguese EQ-5D-5L value set. Qual Life Res. 2019;28(12):3163–3175.
- Golicki D, Jakubczyk M, Graczyk K, et al. Valuation of EQ-5D-5L health states in Poland: the first EQ-VT-based study in Central and Eastern Europe. Pharmacoeconomics. 2019;37(9):1165–1176.
- Hobbins A, Barry L, Kelleher D, et al. Utility values for health states in Ireland: a value set for the EQ-5D-5L. Pharmacoeconomics. 2018;36(11):1345–1353.
- Jensen CE, Sørensen SS, Gudex C, et al. The Danish EQ-5D-5L value set: a hybrid model using cTTO and DCE data. Appl Health Econ Health Policy. 2021;19(4):579–591.
- Kim S-H, Ahn J, Ock M, et al. The EQ-5D-5L valuation study in Korea. Qual Life Res. 2016;25(7):1845–1852.
- Leidl R, Reitmeir P. An experience-based value set for the EQ-5D-5L in Germany. Value Health. 2017;20(8):1150–1156.
- Lin HW, Li CI, Lin FJ, et al. Valuation of the EQ-5D-5L in Taiwan. PLoS One. 2018;13(12):e0209344.
- Ludwig K, Graf von der Schulenburg JM, Greiner W. German value set for the EQ-5D-5L. PharmacoEconomics. 2018;36(6):663–674.
- Luo N, Liu G, Li M, et al. Estimating an EQ-5D-5L value set for China. Value Health. 2017;20(4):662–669.
- Mai VQ, Sun S, Minh HV, et al. An EQ-5D-5L value set for Vietnam. Qual Life Res. 2020;29(7):1923–1933.
- Pattanaphesaj J, Thavorncharoensap M, Ramos-Goñi JM, et al. The EQ-5D-5L valuation study in Thailand. Expert Rev Pharmacoecon Outcomes Res. 2018;18(5):551–558.
- Pickard AS, Law EH, Jiang R, et al. United States valuation of EQ-5D-5L health states using an international protocol. Value Health. 2019;22(8):931–941.
- Purba FD, Hunfeld JAM, Iskandarsyah A, et al. The Indonesian EQ-5D-5L value set. Pharmacoeconomics. 2017;35(11):1153–1165.
- Ramos-Goñi JM, Craig BM, Oppe M, et al. Handling data quality issues to estimate the Spanish EQ-5D-5L value set using a hybrid interval regression approach. Value Health. 2018;21(5):596–604.
- Rencz F, Brodszky V, Gulácsi L, et al. Parallel valuation of the EQ-5D-3L and EQ-5D-5L by time Trade-Off in Hungary. Value Health. 2020;23(9):1235–1245.
- Shafie AA, Vasan Thakumar A, Lim CJ, et al. EQ-5D-5L valuation for the Malaysian population. Pharmacoeconomics. 2019;37(5):715–725.
- Sullivan T, Hansen P, Ombler F, et al. A new tool for creating personal and social EQ-5D-5L value sets, including valuing “dead”. Soc Sci Med. 2020;246:112707.
- Welie AG, Gebretekle GB, Stolk E, et al. Valuing health state: an EQ-5D-5L value set for Ethiopians. Value Health Reg Issues. 2020;22:7–14.
- Wong ELY, Ramos-Goñi JM, Cheung AWL, et al. Assessing the use of a feedback module to model EQ-5D-5L health states values in Hong Kong. Patient. 2018;11(2):235–247.
- Xie F, Pullenayegum E, Gaebel K, et al. A time trade-off-derived value set of the EQ-5D-5L for Canada. Med Care. 2016;54(1):98–105.
- Norman R, Cronin P, Viney R, et al. International comparisons in valuing EQ-5D health states: a review and analysis. Value Health. 2009;12(8):1194–1200.
- Bansback N, Brazier J, Tsuchiya A, et al. Using a discrete choice experiment to estimate health state utility values. J Health Econ. 2012;31(1):306–318.
- Mulhern B, Norman R, Street DJ, et al. One method, many methodological choices: a structured review of Discrete-choice experiments for health state valuation. Pharmacoeconomics. 2019;37(1):29–43.
- Law EH, Pickard AS, Xie F, et al. Parallel valuation: a direct comparison of EQ-5D-3L and EQ-5D-5L societal value sets. Med Decis Making. 2018;38(8):968–982.
- Yang Z, Luo N, Oppe M, et al. Toward a smaller design for EQ-5D-5L valuation studies. Value Health. 2019;22(11):1295–1302.
- Papadimitropoulos EA, Elbarazi I, Blair I, et al. An investigation of the feasibility and cultural appropriateness of stated preference methods to generate health state values in the United Arab Emirates. Value Health Reg Issues. 2015;7:34–41.
- Mahlich J, Dilokthornsakul P, Sruamsiri R, et al. Cultural beliefs, utility values, and health technology assessment. Cost Eff Resour Alloc. 2018;16:19.
- Aronsson M, Husberg M, Kalkan A, et al. Differences between hypothetical and experience-based value sets for EQ-5D used in Sweden: implications for decision makers. Scand J Public Health. 2015;43(8):848–854.
- Rabin R, Gudex C, Selai C, et al. From translation to version management: a history and review of methods for the cultural adaptation of the EuroQol five-dimensional questionnaire. Value Health. 2014;17(1):70–76.