
Abstract
Aims
Chronic lung allograft dysfunction (CLAD), a common complication of lung transplantation, is the leading cause of death for lung transplant recipients. While data on lung transplant costs are available, the impact of CLAD on healthcare resource use (HRU) and cost is not well understood. The primary objective was to quantify the HRU and costs of CLAD in the US using real-world data.
Methods
A longitudinal retrospective analysis was performed of commercial claims data from the IQVIA PharMetrics Plus database for patients aged 18–64 who underwent lung transplantation between January 1, 2006 and September 30, 2018. Lung transplantation was identified using International Classification of Disease and Common Procedure Terminology procedure codes. Patients studied were observable for at least 12 months before and after transplantation. Patients who developed CLAD were identified using novel, diagnosis codes for incident lung disease at least one year following transplantation. Descriptive analyses were conducted to assess the study’s outcomes prior to and following a CLAD diagnosis. All-cause HRU and costs, the study’s primary outcomes, leading up to and following CLAD diagnosis were calculated.
Results
Among 129 transplant patients who developed CLAD, healthcare costs were substantially higher in the year following diagnosis ($198,113), compared to the year leading to diagnosis ($85,276). Inpatient admissions were responsible for most costs in years 1 and 2 following diagnosis ($99,372 and $83,348 respectively). Drug costs were higher in the 12 months post-index, compared to the 12 months pre-index ($3,600 vs $2,527).
Limitations
Claims data do not include clinical data, have limits determining loss of follow-up, and do not provide granularity to determine disease severity. Also, there is no ICD-10-CM code specific to CLAD or BOS.
Conclusions
CLAD after lung transplant is associated with substantial HRU and costs. Further work is needed to develop interventions that reduce this impact.
Introduction
Background
Lung transplantation is the standard of care for patients with irreversible end-stage lung diseaseCitation1. According to the Organ Procurement and Transplantation database, for over 30 years, nearly half (49.2%) of lung transplant recipients used commercial insurance as the source of payment for their procedure, and a majority (75.2%) were between 18 and 64 years oldCitation2,Citation3. The long-term success of lung transplantation depends on selective donor-recipient pairing, effective surgery and post-surgical management, comprehensive screening for acute or chronic rejection, appropriate initiation and maintenance of immunosuppression, and mitigating the impact of infectionsCitation4. Over time, outcomes among lung transplant recipients have improved, but median survival after lung transplantation remains only about six years, particularly low when compared with other organ transplantation proceduresCitation5,Citation6.
Chronic lung allograft dysfunction (CLAD) is used to describe the clinical manifestations of a range of pathologic processes of the lung allograft that lead to a significant and persistent deterioration in lung function, occurring after lung transplantationCitation7. By definition CLAD is a persistent decline (≥20%) in measured (FEV1) value from the baseline valueCitation7. The most common manifestation of CLAD is the development of bronchiolitis obliterans syndrome (BOS)Citation8. Approximately 48% of all lung transplant recipients develop BOS within 5 years and 90% of recipients have the condition within 10 years of transplantationCitation9–11. Restrictive allograft syndrome (RAS), which accounts for one-third to one-fourth of all CLAD cases, is associated with markedly worse survival than BOSCitation12,Citation13. Additionally, effective treatment for CLAD has not been identified and remains an unmet medical needCitation14. CLAD, and especially the sub-phenotype of BOS, impose a large persistent impact on lung transplantation recipients and limit the utility of transplantation.
Study rationale
CLAD is also expected to impose a considerable increase on healthcare resource utilization (HRU) and costs for lung transplant recipients. Comparatively little is known about the impact of CLAD on HRU and costs following transplantation. The primary objective of this study was to quantify the HRU and costs of CLAD following lung transplantation. The secondary objective of this study was to compare the HRU and costs of CLAD following lung transplantation prior to and after a CLAD diagnosis.
Methods
Study design and data source
The data source for this retrospective longitudinal study was the IQVIA PharMetrics Plus commercial database which is nationally representative. IQVIA contains medical and prescription drug claims as well as demographic and enrollment information for over 140 million individuals with commercial insurance coverage in the US. The study was between January 1, 2006 and September 30, 2018 and exempt from IRB approval, as it did not involve any biomedical research with human subjects that was interventional.
Patient selection
Study patients were limited to 18–64 years of age, and required to have evidence of a lung transplant and CLAD in their medical claims history. Patients were age limited as those 65 years or older are likely to be primarily covered through Medicare, with commercial payers partially covering their costs of healthcare. This age limit allowed the data to provide the most comprehensive information on healthcare encounters for individuals. In addition, study patients were required to be enrolled in their health insurance plan for at least 12 months before and at least 12 months following their lung transplant. If patients died or switched health insurance coverage in the first year following their lung transplantation, they were not included in the study’s sample. Similarly, patients who were enrolled in their specific health insurance plan for less than 12 months before their transplantation date were not included.
Claims data contain International Classification of Diseases, Ninth Revision, Clinical Modification and Tenth Revision, Clinical Modification (ICD-9-CM and ICD-10-CM), Current Procedural Terminology (CPT), Healthcare Common Procedure Coding System (HCPCS), and place of service codes for each medical encounter. Each patient’s lung transplantation was identified using procedure and diagnosis codes. (Clinical codes are listed in Supplementary Appendix, Table S1). To ensure that claims for lung transplantation reflected the transplantation itself, we only included patients who had no claims related to transplantation for at least one year prior to the index transplant claim. Transplantation was also required to be part of a hospital admission.
Once we identified patients who had undergone lung transplantation, we identified those who developed CLAD by using a set of pulmonary disease diagnosis codes that are typically used in clinical practice, including: chronic obstructive pulmonary disease (COPD), bronchitis, pulmonary fibrosis, alveolar conditions, and interstitial lung disease (ILD) (Supplementary Table S2). We identified CLAD patients starting at least 12 months after the date of lung transplantation in order to ensure that we did not mistake pre-transplantation lung disease for CLAD. There is currently no ICD-9-CM or ICD-10-CM diagnosis code specific to CLAD or BOS; therefore, the COPD or ILD code is often used in lieu of a CLAD-specific code.
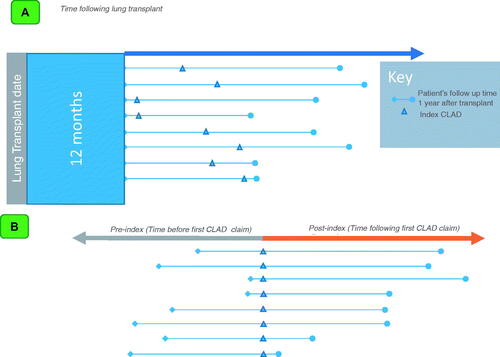
Since diagnoses codes used for CLAD could be associated with the index transplantation or for other acute conditions, we applied additional criteria to confirm the diagnosis of CLAD. To do this, we required that in cases where a diagnosis code that could indicate CLAD was used prior to transplantation, that there be a “clean period” of at least 6 months after transplantation where the pre-transplantation code was not used. This was intended to ensure that the diagnosis of CLAD was evidence of a new pulmonary condition, rather than the need for lung transplantation. Additionally, patients were required to have at least one further claim that utilized the CLAD diagnosis code at least 2 months after the first claim to identify CLAD as a chronic, ongoing issue. Finally, patients were required to have evidence of pulmonary evaluation (CT, lung biopsy, or bronchoscopy) within 60 days of the first observed CLAD diagnosis. The first CLAD-surrogate claim that met the criteria above was considered the index date (). The timing of this index date relative to the original transplant naturally varied by patient, as patients develop CLAD at different times following transplantation. The study leveraged timeframes frequently used in economic models that evaluate outcomes in patients with advanced cancers and measure outcomes and improvements in months of progression free survival.
Figure 1. (A) Study design. This figure depicts the variable time following a patient’s lung transplantation and their index of CLAD, 12 months after the initial transplant. (B). Study design. This figure depicts the time before the first CLAD claim (pre-index) and the time following the first CLAD claim (post-index) in the time following lung transplantation.
Study outcomes
HRU and costs
HRU and costs, the study’s primary outcomes, were calculated on a monthly basis for each patient before and after their index date. Each patient’s pre-index period started no earlier than the 12 month anniversary of lung transplant and ended at the date of index CLAD diagnosis. Each patient was followed for as many months as they were observable after their index CLAD diagnosis. Consequently, the actual time period before index CLAD diagnosis varied for each patient, since initial CLAD diagnosis could occur at any point one year post-transplantation. The actual time following CLAD diagnosis also varied, as patients were lost to follow-up at different time-points. Since follow-up time could vary, and severe cases of CLAD might be associated with lower costs or HRU due to early death, costs and HRU were calculated on a monthly basis following diagnosis. The costs associated with lung transplantation can be substantial, seeing costs increase with higher lung allocation scoresCitation15. A 2019 study using US electronic medical records reported that total costs of transplantation, including the transplant episode and one year of follow up, could range from $280,485 to $512,144Citation15. Consequently, costs and HRU in the first year after transplantation were excluded, as they could reflect costs and HRU associated with the transplantation ().
Healthcare resource use was separated into categories, including hospital admissions, Emergency Room visits, outpatient services (outpatient hospital visits, office visits, laboratory and imaging tests, and other outpatient encounters such as home health visits and urgent care), and prescription medication fills. ER visits were those where a patient was not admitted to the hospital, as costs for ER visits followed by an admission are part of the hospital admission. Hospital admissions were further stratified by the presence or absence of an ICU stay. Costs for hospital admissions were assigned to the month in which the patient was admitted to the hospital. Costs were the amounts paid by commercial insurers to providers for all services. All costs were adjusted to 2019 US dollars using the medical care component of the Consumer Price IndexCitation16.
Patient characteristics
Patient demographic and clinical characteristics (gender, geographic region, health plan type, comorbidities, and overall health status), the study’s secondary outcomes, were identified in the year prior to lung transplantation, and patient age as of the transplant date. Based on the disease area and the study’s inclusion criteria for patients, age was categorized as 18–40 years old and 41–64 years old to ensure there was a large enough sample to consider the outcomes for younger patients. The Charlson Comorbidity Index (CCI), a widely used measure of patient health status, was calculated using diagnosis codes on medical claims from the year before the index transplantCitation17. A higher CCI indicates more severe comorbiditiesCitation18. Patient comorbidities, including COPD, pulmonary fibrosis or ILD, cystic fibrosis, bronchiectasis, pulmonary hypertension, and pulmonary arterial hypertension were also identified in the pre-transplant year. The ICD-9-CM and ICD-10-CM diagnosis codes used to identify comorbidities are listed in Supplementary Table S3. Patients’ health statuses were measured before the index transplant to assess the health profile of the study sample as a baseline before the development of CLAD in a patient’s journey.
Descriptive analyses
Descriptive analyses were conducted to assess patient demographic and clinical characteristics, HRU, and costs over the study period. The descriptive analyses were further stratified by the index period of a CLAD diagnosis, either pre- or post-, to assess the differences between these periods. Counts and percentages for categorical variables and measures of central tendency (mean ± SD and median/IQR) for continuous variables were presented overall and by index period. Average monthly HRU across all patients for each healthcare setting were calculated. Additionally, mean per patient monthly costs before and after index diagnosis were calculated. To estimate annual HRU and costs, the average monthly HRU and costs were summed across the relevant time periods. To do so, averages for patients observable for each number of were summed before and after the index CLAD diagnosis.
The study design was similar to an interrupted time series in comparing outcomes before and after the CLAD diagnosis. In this design, each individual patient behaved as their own control as we compared their outcomes before the CLAD diagnosis to their outcomes after the diagnosis.
Results
Patient cohort
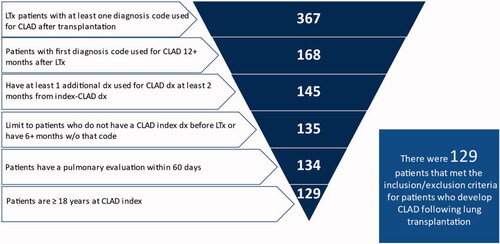
A total of 367 patients who received a lung transplant were identified who met the study’s initial enrollment criteria from 2006 to 2018. Of the 367, 46% (n = 168) had a diagnosis used for CLAD at least 12 months after the lung transplantation procedure; 40% (n = 145) had at least one additional diagnosis within 2 months of the index CLAD diagnosis; 37% (n = 135) had a “clean” period of at least 6 months with no evidence of the index diagnosis prior to the index used for CLAD; 37% (n = 134) had evidence of pulmonary evaluation within 60 days of their index diagnosis. Five patients were excluded because they were younger than 18. The final cohort of patients with CLAD, who met all of the study’s final inclusion requirements, consisted of 129 patients, reflecting 35% of the original cohort (n = 367) ().
Figure 2. Patient attrition, inclusion and exclusion criteria. This figure depicts the study inclusion and exclusion criteria that was applied to the initial sample, and the corresponding attrition at various criterium.
Patient characteristics
Study patients were primarily male (N = 84/129; 65%), with a mean age of 52 (SD: 10.8); the majority (86%) were age 41–64. The mean CCI was 2.1 (SD: 1.4), consistent with serious illness in these study patients. A majority of patients had diagnoses for pulmonary fibrosis or ILD (N = 101/129; 78%). Other diagnoses included pulmonary arterial hypertension (N = 63/129; 49%), pulmonary hypertension (N = 38/129, 29%), COPD (N = 21/129; 16%), bronchiectasis (N = 36/129; 28%), and cystic fibrosis (N = 25/129; 19%); patients could have diagnoses for more than one severe lung disease ().
Table 1. Study Patient Demographic and Clinical Characteristics at Baseline (pre-transplant).
Evidence of CLAD over time
The index CLAD claim was identified using the study’s identification algorithm. Many study patients (82/129 = 64%) had an initial claim with a diagnosis used for CLAD 13 or 14 months following transplantation, and most had an initial claim with a diagnosis used for CLAD in the second year following transplantation (121/129 = 94%). Very few patients (8/129 = 6%) had their index CLAD diagnosis in the third year after transplantation or later (). Pre-index, patients were observable for an average of 2.71 months (SD: 4.82) but were observable for an average of 30.19 months (SD: 24.05) post-index ().
Figure 3. Incidence of CLAD diagnosis relative to lung transplantation. This figure depicts the incidence of CLAD relative to lung transplantation. The horizontal axis depicts the months since lung transplant. The vertical axis depicts the number of incident diagnoses.
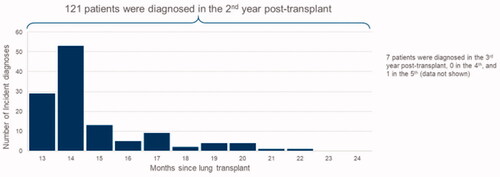
Table 2. Observable time for study patients.
Healthcare resource use
Inpatient services
Among study patients, mean monthly rates of inpatient admissions increased dramatically immediately following diagnosis and remained elevated for at least two years. Overall, inpatient admissions without ICU stays were more common than inpatient admission with ICU stays. In all observed patient-months leading up to the index CLAD claim, patients had 0.07 hospitalizations per patient per month, or 0.84 per patient per year. Of these, 0.05 (SD: +/− 0.27) were attributable to admissions without an ICU stay, and the remaining 0.02 (SD: +/− 0.14) were attributable to admissions with an ICU stay. In the pre-index period, for hospitalizations without an ICU stay, the average length of stay was 7.06 months (SD: +/− 7.48), while for admissions with an ICU stay, the average length of stay was 6.71 months (SD: +/− 5.22) (). In the post-index period, patients had 0.12 hospitalizations per month, with 0.04 (SD: +/− 0.25) of these hospitalizations including an ICU stay, and 0.08 (SD: +/− 0.31) without an ICU stay. Inpatient admissions peaked around the time of the index CLAD diagnosis, with 0.22 hospitalizations per patient in each of the two months (SD: +/− 0.28 and 0.19, respectively) immediately following the index CLAD diagnosis (). Additionally, a large majority of patients were hospitalized at least once following CLAD diagnosis (N = 101/130; 78%) and 34 of these hospitalized patients (34%) had at least one hospital admission with an ICU stay at any time following index diagnosis and the last month in which they were observable following CLAD diagnosis. In the post-index period, for hospitalizations without an ICU stay, the average length of stay was 7.5 months (SD: +/− 8.82), while for admissions with an ICU stay, the average length of stay was 13.71 months (SD: +/− 17.31) ().
Figure 4. (A) Average number of inpatient admissions per patient per month. This figure depicts the average number of inpatient admissions per patient per month. The horizontal axis depicts the months since index diagnosis, negative values corresponding to the pre-period, and positive values corresponding to the post-period. The vertical axis depicts the mean inpatient admissions per patient per month. The solid area of the plot depicts inpatient admissions without ICU. The stripped area of the plot depicts inpatient admissions with ICU. (B) Average number of outpatient services per patient per month. This figure depicts the average number of outpatient services per patient per month. The horizontal axis depicts the months since index diagnosis, negative values corresponding to the pre-period, and positive values corresponding to the post-period. The vertical axis depicts the mean outpatient services per patient per month. (C) Average number of prescription fills per patient per month. This figure depicts the average number of prescription fills per patient per month. The horizontal axis depicts the months since index diagnosis, negative values corresponding to the pre-period, and positive values corresponding to the post-period. The vertical axis depicts the mean prescription fills per patient per month.
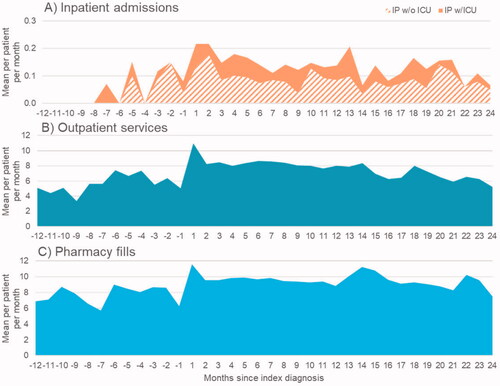
Table 3. Hospitalizations length of stay.
Outpatient services
Outpatient services were commonly utilized both before and after index diagnosis, as were prescription medications. In all observed patient-months prior to index CLAD diagnosis, patients had 5.93 (SD+/− 5.11) outpatient services per month, on average. Use of outpatient services increased following CLAD diagnosis to 7.32 (SD: +/− 6.73) per patient per month over the entire post-index period. More specifically, average monthly outpatient service use rates rose from 3.33 (SD: +/– 3.20) to 7.38 (SD: +/– 6.01) per patient in the 12 months pre-index to 10.99 (SD: +/– 6.00) in the month following the index CLAD claim. Utilization of outpatient services remained higher in month in the 12 months following the index CLAD claim, compared with pre-index utilization, ranging from 7.66 (SD: +/– 5.70) to 8.66 (SD: +/– 6.28) outpatient services per patient per month.
Prescription medications
Prescription medication fill rates followed a similar pattern and increased from 7.42 (SD: +/–5.26) per patient per month in the pre-index period to 8.83 (SD: +/– 7.44) prescriptions per patient per month in the post-index period. The number of prescriptions filled per patient peaked in the month following CLAD diagnosis (mean: 11.59; SD: +/– 7.75), and leveled off in the post-index period while remained higher than the pre-index period (mean: 8.83; SD: +/– 7.44).
Healthcare costs
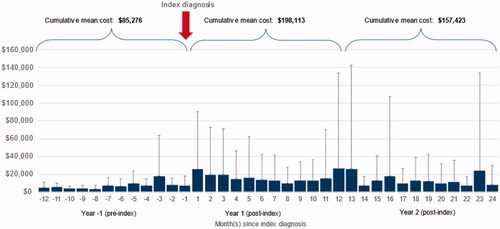
Among patients who developed CLAD, healthcare costs increased dramatically following index diagnosis. In the pre-index period, including all observed patient-months, the mean monthly cost per patient was $8,076 (SD: +/– $17,062). In the post-index period, including all observable patient-months, the mean monthly cost per patient was $11,969 (SD: +/– $43,316). In the 12 months leading up to the first claim attributable to CLAD, but including any patient-months observable in that window, the average annual per patient cost was $85,276. In the 12 months following index diagnosis, the average annual per patient cost was $198,113, more than double the previous year. The second year following index diagnosis had an average annual per patient cost of $157,423 (). In subsequent years, average patient costs continued to decline among those patients who were not lost to follow-up. In years 3, 4, and 5, mean total costs were $99,684, $86,983, and $69,466, respectively.
Figure 5. Mean per patient per month direct medical costs overall. This figure depicts the mean direct medical costs per patient per month. The horizontal axis depicts the months since index diagnosis, negative values corresponding to the pre-period, and positive values corresponding to the post-period. The vertical axis depicts the mean per patient per month cost. The vertical line for each bar on the vertical axis depicts the standard deviation.
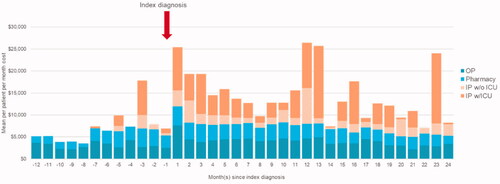
These costs were driven largely by inpatient admissions: in the 12 months leading up to index diagnosis, average annual costs per patient for inpatient admissions were $17,668, compared to $99,372 in the 12 months post-index, and $83,348 in months 13–24 post-index. Costs for outpatient services and prescription medications were the majority of costs prior to CLAD diagnosis, and were higher following CLAD diagnosis. Outpatient services costs were $3,107 per patient per month in the 12 months pre-index, and $4,629 and $3,496 per patient per month in the first and second year post-index, respectively. Average per patient per month pharmacy costs were $2,527 in the 12 months prior to index diagnosis, and $3,600 in the 12 months following index diagnosis (; Supplementary Appendix, Table S4).
Figure 6. Mean per patient per month direct medical costs by category. This figure depicts the mean direct medical costs per patient per month by category. The horizontal axis depicts the months since index diagnosis, negative values corresponding to the pre-period, and positive values corresponding to the post-period. The vertical axis depicts the mean per patient per month cost. The plot has been stratified to correspond to the categories of outpatient services, pharmacy, inpatient admissions without ICU, and inpatient admissions with ICU.
Discussion
Principal findings
In this analysis of real-world data, all-cause HRU and costs were examined for patients who had a lung transplantation and later received a diagnosis attributable to CLAD. The rates of CLAD observed in this study, 46% of the 367 observable lung transplant recipients, are in line with what is suggested by ISHLTCitation7. The findings suggest that CLAD diagnosis is associated with a substantial increase in costs, rising from $8,076 per patient per month pre-index to $11,969 per patient per month post-index. On an annual basis, patients in the first year post-index incurred all-cause direct medical costs that were over twice as high as costs in the year leading up to index CLAD diagnosis. Among patients observable in subsequent years, costs were lower but remained higher than in the pre-index period. To our knowledge, this is the first study to quantify HRU and costs associated with CLAD following lung transplantation.
CLAD is a pervasive vulnerability of lung transplantation, limiting both the quantity and quality of life after the procedure. Several studies indicate that the development of CLAD is the most important factor associated with impaired quality of life after lung transplantCitation1,Citation19,Citation20. Further, despite improvements in one-year survival, most deaths after the first post-transplant year are caused by CLAD, with minimal improvement in recent yearsCitation20–23. At the same time, treatment options for CLAD are associated with marginal improvement in lung function in a minority of patients, but these results are not consistentCitation14. In a small subset of patients with advanced disease, re-transplantation can be considered. However, results are not as favorable as after the first transplantation, and it is associated with higher operative mortalityCitation19,Citation23,Citation24.
Van den Berg et al. studied the influence of BOS on costs after lung transplantation by comparing the costs of 53 patients with and without this condition in the NetherlandsCitation23,Citation25. They found that follow up healthcare was $600 USD/week (73%) more expensive in patients with BOS, driven mainly by length of hospitalization and increased medication useCitation23,Citation25. A study by Jones et al. estimated that BOS-related illness will cost society more than $3.7 billion over the next decade, with the 10-year cost of treating BOS estimated to be $1.4BCitation26. This study adds contemporary evidence to these analyses by quantifying the HRU and costs associated with CLAD after lung transplantation in the US, and by demonstrating the increase in costs that accompany the development of CLAD.
Strengths & limitations
Limitations
This study has limitations. First, we used U.S. claims data, which do not include clinical parameters such as medical test results and other clinical values for disease confirmation. Additionally, the lack of a ICD-10-CM code specific to CLAD or BOS posed some difficulty in capturing this condition. To accommodate for this, a subset of diagnosis codes was used, which were commonly used for obstructive and interstitial lung diseases, along with additional criteria to identify CLAD patients. We believe the patients included in the study are likely to have CLAD, but this could not be confirmed with a detailed chart review, which would have been ideal. We developed our study methods and our patient inclusion requirements, to be consistent with the patient journey and clinical markers so that study patients are likely CLAD patients. These methods are similar to other studies that have made their own attempts to categorize lung disease outcomes, such as idiopathic pulmonary fibrosis and non-IPF progressive fibrosing interstitial lung disease, using claims dataCitation27,Citation28. Moreover, we did not distinguish RAS from BOS using this methodology, and the dramatic increase in monthly costs and HRU following index diagnosis likely reflected costs for both RAS and BOS.
Next, these data have limits determining loss of follow-up. The reason why patients are no longer observable is unknown, and could be due to either changing insurance or death. Also, the study patients were limited to adults 18–64 years of age with commercial insurance coverage. Consequently, our results may not be generalizable to older patients with Medicare coverage, those with Medicaid coverage, or pediatric patients. The study also required patients to be observable for at least one year following transplantation, which likely led to survivorship bias in our results. Setting this time requirement allowed for us to focus on CLAD as the likely disease, which typically manifests the first 12 months following a lung transplantation.
Additionally, as the study examined only the costs paid by commercial payers, the total economic burden of CLAD could be substantially higher if indirect costs, and costs paid by public insurers were included. It is also possible that the study missed new cases of CLAD if a patient transitioned from private insurance to public. However, the study design allowed an examination of costs on a monthly basis, so that patients lost to follow-up would not impact these results. Finally, a limitation of using claims data is that granularity is not always available in determining the severity of diseases. Consequently, it is a possibility that the study missed early cases of CLAD, if they occurred. The study’s methodology was the most appropriate way to address the limitations of administrative claims data, and the lack of ICD-10-CM codes specific to CLAD and BOS.
Strengths
Observational studies using real-world data, such as administrative claims, complement clinical data in access decisions for therapies and in informing practice guidelines. To our knowledge, HRU and costs of CLAD following lung transplantation have not been quantified in a “real-world” setting in recent years. Results from this study provide the opportunity to better understand the long-term outcomes following lung transplantation and allows one to consider the accompanying costs of a common condition, CLAD, when making clinical decisionsCitation29.
Conclusions
CLAD after lung transplant is associated with a substantial increase in HRU and costs in the months following diagnosis. CLAD increases the costs of an expensive but potentially life-saving procedure. Potential treatment options under development that can prevent the occurrence or delay the progression of CLAD in lung transplant recipients would hold considerable clinical and economic value.
Transparency
Declaration of funding
PRECISIONheor received funding from Breath Therapeutics, a division of Zambon, for the research reported here.
Declaration of financial relationships
N.S, B.H, and P.C are employees of PRECISIONheor. G.B is an employee of Zambon Company.
Peer reviewers on this manuscript have received an honorarium from JME for their review work but have no other relevant financial relationships to disclose.
Author contributions
A.S, N.S, B.H, P.C, G.B, and H.H contributed to the research study design. B.H and N.S take responsibility for accessing and analyzing data associated with the study. A.S, and N.S. take responsibility for interpreting the findings of the study and writing the manuscript. N.S will operate as the guarantor of the paper, taking responsibility for the integrity of the work as a whole.
Supplemental Material
Download MS Word (109.8 KB)Acknowledgements
None stated.
References
- Thabut G, Mal H. Outcomes after lung transplantation. J Thorac Dis. 2017;9(8):650–2691.
- Network O. Transplant: recipient age by recipient Gender - U.S. Transplants performed: for organ = lung., U.S.D.o.H.H. Services, Editor. 2022.
- Network O. Transplant: Recipient primary source of payment by recipient gender U.S. Transplants for organ = lung., U.S.D.o.H.H. Services, Editor. 2022.
- Young KA, Dilling DF. The future of lung transplantation. Chest. 2019;155(3):465–473.
- Chambers DC, Cherikh WS, Harhay MO, et al. The international thoracic organ transplant registry of the international society for heart and lung transplantation: thirty-sixth adult lung and heart-lung transplantation report-2019; focus theme: donor and recipient size match. J Heart Lung Transplant. 2019;38(10):1042–1055.
- Graham CN, Watson C, Barlev A, et al. Mean lifetime survival estimates following solid organ transplantation in the US and UK. J Med Econ. 2022;25(1):230–237.
- Verleden GM, Glanville AR, Lease ED, et al. Chronic lung allograft dysfunction: definition, diagnostic criteria, and approaches to treatment-A consensus report from the pulmonary council of the ISHLT. J Heart Lung Transplant. 2019;38(5):493–503.
- Broaddus VC, et al. Murray & Nadel’s textbook of respiratory medicine. 7th ed. 2022. Philadelphia: Elsevier.
- Hayes D. Jr., a review of bronchiolitis obliterans syndrome and therapeutic strategies. J Cardiothorac Surg. 2011;6(1):92.
- Müller C, Rosmark O, Åhrman E, et al. Protein signatures of remodeled airways in transplanted lungs with bronchiolitis obliterans syndrome obtained using Laser-Capture microdissection. Am J Pathol. 2021;191(8):1398–1411.
- de Jong PA, Vos R, Verleden GM, et al. Thin-section computed tomography findings before and after azithromycin treatment of neutrophilic reversible lung allograft dysfunction. Eur Radiol. 2011;21(12):2466–2474.
- Verleden SE, Ruttens D, Vandermeulen E, et al. Predictors of survival in restrictive chronic lung allograft dysfunction after lung transplantation. J Heart Lung Transplant. 2016;35(9):1078–1084.
- Sato M, Ohmori-Matsuda K, Saito T, et al. Time-dependent changes in the risk of death in pure bronchiolitis obliterans syndrome (BOS). J Heart Lung Transplant. 2013;32(5):484–491.
- Bedair B, Hachem RR. Management of chronic rejection after lung transplantation. J Thorac Dis. 2021;13(11):6645–6653.
- Keller CA, Gonwa TA, White LJ, et al. Utilization and cost analysis of lung transplantation and survival after 10 years of adapting the lung allocation score. Transplantation. 2019;103(3):638–646.
- Labor, U.S.B.o., Medical care in U.S. city average, all urban consumers, not seasonally adjusted; 2022.
- Quan H, Li B, Couris CM, et al. Updating and validating the Charlson comorbidity index and score for risk adjustment in hospital discharge abstracts using data from 6 countries. Am J Epidemiol. 2011;173(6):676–682.
- Charlson ME, Pompei P, Ales KL, et al. A new method of classifying prognostic comorbidity in longitudinal studies: development and validation. J Chronic Dis. 1987;40(5):373–383.
- Künsebeck HW, Kugler C, Fischer S, et al. Quality of life and bronchiolitis obliterans syndrome in patients after lung transplantation. Prog Transpl. 2007;17(2):136–141.
- Kulkarni HS, Cherikh WS, Chambers DC, et al. Bronchiolitis obliterans syndrome-free survival after lung transplantation: an international society for heart and lung transplantation thoracic transplant registry analysis. J Heart Lung Transplant. 2019;38(1):5–16.
- Chambers DC, Cherikh WS, Goldfarb SB, et al. The international thoracic organ transplant registry of the international society for heart and lung transplantation: thirty-fifth adult lung and heart-lung transplant report-2018; focus theme: Multiorgan transplantation. J Heart Lung Transplant. 2018;37(10):1169–1183.
- Chambers DC, Yusen RD, Cherikh WS, et al. The registry of the international society for heart and lung transplantation: thirty-fourth adult lung and Heart-Lung transplantation report-2017; focus theme: allograft ischemic time. J Heart Lung Transplant. 2017;36(10):1047–1059.
- Verleden GM, Raghu G, Meyer KC, et al. A new classification system for chronic lung allograft dysfunction. J Heart Lung Transplant. 2014;33(2):127–133.
- Rana A, Gruessner A, Agopian VG, et al. Survival benefit of solid-organ transplant in the United States. JAMA Surg. 2015;150(3):252–259.
- van den Berg JW, van Enckevort PJ, TenVergert EM, et al. Bronchiolitis obliterans syndrome and additional costs of lung transplantation. Chest. 2000;118(6):1648–1652.
- Jones CA, Chapman DG, Weimersheimer P, et al. The burden of cost in bronchiolitis obliterans syndrome: predictions for the next decade. JHEOR. 2016;4(2):119–126., date= 2016-06-09.
- Mortimer KM, Bartels DB, Hartmann N, et al. Characterizing health outcomes in idiopathic pulmonary fibrosis using US health claims data. Respiration. 2020;99(2):108–118.
- Olson AL, Maher TM, Acciai V, et al. Healthcare resources utilization and costs of patients with Non-IPF progressive fibrosing interstitial lung disease based on insurance claims in the USA. Adv Ther. 2020;37(7):3292–3298.
- Rudrapatna VA, Butte AJ. Opportunities and challenges in using real-world data for health care. J Clin Invest. 2020;130(2):565–574.