
Abstract
Aim
This post-hoc analysis estimated annual indirect cost savings with galcanezumab (GMB) treatment in patients with episodic migraine (EM) or chronic migraine (CM).
Methods
Data from 4 randomized, Phase 3, double-blind (DB), placebo (PBO)-controlled studies of GMB were analyzed: EVOLVE-1 and EVOLVE-2 (EM, 6-months DB), REGAIN (CM, 3-months DB), and CONQUER (previous failure of 2–4 migraine preventive medication categories, 3-months DB). Indirect costs were calculated at baseline and Month 3 using the first 2 items in Migraine Disability Assessment (MIDAS): (A + B)/60*country specific annual wage (A = days of missed work/school; B = days of reduced productivity at work/school; assuming 60 working days in 3 months). All costs were annualized and expressed in international dollars (Int$) in 2018. ANCOVA models estimated the indirect cost savings as a change from baseline. Secondary analyses determined cost savings by employment and responder status.
Results
Patients (>80% females) from EVOLVE-1 and −2 (n = 1,201; mean age 41.9 years), REGAIN (n = 759; mean age 41.3 years), and CONQUER (n = 453; mean age ∼46.0 years) were analyzed. GMB showed significant indirect cost savings for EM (Int$6256, p < .0001) and CM (Int$7129, p = .0002), with substantial savings for patients with previous failure of 2–4 migraine preventive medication categories (EM: Int$5664, p = .0030; CM: Int$5181, p = .1300). Compared with PBO, GMB showed significantly greater indirect cost savings for EM (p = .0156) and patients with previous failure of 2–4 migraine preventive medication categories (p = .0340). Employed patients with CM (p = .0018) and with previous failure of 2–4 migraine preventive medication categories (p < .0001) had significant cost savings after GMB treatment. GMB showed significant indirect cost savings in patients with a reduction in migraine headache days.
Conclusion
GMB treatment resulted in annual indirect cost savings in patients with EM, CM, and with previous failure of 2–4 migraine preventive medication categories, with similar observations in the sensitivity analyses.
Introduction
The mean percentage of overall work impairment due to migraine among patients who are seeking medical care and eligible for prevention treatment (≥4 monthly migraine headache days) is approximately 40% for patients in the United States (US) (40.3%) and Europe (39.7%), which equates to approximately 16 h out of a 40-hour work-week with impairmentCitation1. Loss in productivity with migraine is either due to more unscheduled missed days of work (absenteeism) or decreased performance at work (presenteeism)Citation1. In a cross-sectional study in Europe, >60% of employed people with migraine reported a negative impact of migraine on work productivity. The mean number of absences was 2.3 days per person per month, which increased with greater migraine headache day frequency. Persons with chronic migraine (CM) reported absences of 4.4. days per person per month due to their diseaseCitation2. The migraine impact model used in the US estimated that approximately 60,000–686,000 annual workdays were lost due to migraineCitation3. This loss in workdays incurs an annual indirect cost, which is up to 8.5 times the annual direct cost of treatmentCitation2–5.
In 2016, the total cost incurred due to migraine in the US was $36 billion, which constituted both medical costs and costs due to loss in work productivity. The study showed a greater indirect cost burden in patients with migraine than in patients without migraine ($2,350 per person per year) due to missing workdaysCitation6. Studies in Europe and Asia have also reflected on the similar unscheduled loss of work and productivityCitation5,Citation7–9. In a population survey in Japan, the economic loss due to absenteeism (in US Dollars [USD]) was $238.3 per person per year for day-off, whereas the economic loss (in USD) due to presenteeism was $375.4 per person per year. The costs were calculated using the Migraine Disability Assessment (MIDAS) questionnaire, with the cost of productivity loss due to presenteeism estimated at $3.3 billion per year across JapanCitation5. The Eurolight project reported the mean per-person annual costs for migraine as Euros (EUR) 1,222; with 93% being indirect costs, two-thirds were attributable to presenteeism (EUR 765) and one-third to absenteeism (EUR 371)Citation7. Considering prevalence estimates for migraine in European adults (18–65 years), the total annual cost of migraine was EUR 111 billion; with indirect costs being the larger contributor to this economic burdenCitation7.
More effective treatments have the potential to reduce the cost of illness by improving patient outcomesCitation10. Galcanezumab (GMB) is a calcitonin gene-related peptide monoclonal antibody (CGRP mAb), approved in the US in 2018Citation11. In Phase 3 studies, GMB showed greater efficacy and safety compared with placebo (PBO) in patients with episodic migraine (EM), CM, or with previous failure of 2–4 migraine preventive medication categories in the past 10 years due to insufficient efficacy and/or safety/tolerability reasonsCitation11–14. In addition, GMB 120 mg has also shown significantly greater improvements in health-related quality of life (HRQoL) and significantly reduced disability compared with PBOCitation15,Citation16. However, to date, no study has evaluated the indirect cost savings after treatment with GMB. The MIDAS questionnaire (absenteeism and presenteeism) has been used to estimate the costs of lost productivity in 3 clinical studiesCitation17. Lost productivity costs were calculated based on the median hourly wage in US dollars and predicted values of absenteeism and presenteeism from a zero-inflated Poisson regression model.
This pre-specified post-hoc analysis of Phase 3 clinical studies in patients with EM or CM evaluated annual indirect cost savings after treatment with GMB (i.e. savings with GMB vs. baseline). Indirect cost savings for GMB vs. PBO, indirect cost savings after GMB treatment is employed for patients and patients with a reduction in migraine headache days were also conducted.
Methods
Study design and patients
This post-hoc analysis included 4, Phase 3, double-blind (DB), PBO-controlled, randomized studies of GMB in patients with EM, CM, and with previous failure of 2–4 migraine preventive medication categories over the past 10 years due to insufficient efficacy and/or safety/tolerability reasons. The study designs for the studies have been published previouslyCitation11–14. The studies included in this analyses were EVOLVE-1 and EVOLVE-2 for EM (DB period, 6 months)Citation11,Citation12; REGAIN for CM (DB period, 3 months)Citation13; and CONQUER for patients with previous failure of 2–4 migraine preventive medication categories (EM or CM: DB period, 3 months)Citation14. CONQUER study was designed to include patients who had failed 2–4 migraine preventive medication categoriesCitation14 in the past 10 years due to inadequate efficacy and/or tolerability reasons, including propranolol or metoprolol, topiramate, valproate or divalproex, amitriptyline, flunarizine, candesartan, botulinum toxin A or B, medication locally approved for the prevention of migraineCitation18. Whereas the EVOLVE-1, EVOLVE-2 and REGAIN studies excluded patients with a history of failure due to inadequate efficacy of ≥3 different classes of migraine preventive treatmentsCitation11–13 as defined by the AAN and the AHS (Level A and B) or botulinum toxin A or BCitation18. All studies were conducted globally (EVOLVE-2: Asia, Europe, South America, and United States; REGAIN: Asia, Europe, and North America; CONQUER: Asia, Europe, and North America)Citation12–14 except for EVOLVE-1, which was conducted in North America (United States, Canada, Puerto Rico) onlyCitation11.
The analysis of the 4 clinical studies included patients who had received either 240 mg loading dose of GMB followed by 120 mg GMB monthly subcutaneously or PBO and also had baseline and at least one post-baseline measurement of MIDAS. MIDAS scores at baseline and at Month 3 (last observation carried forward [LOCF] applied if patients were early dropout) were used for calculation of indirect cost savings in the analysis. All the patients had migraine diagnosis defined by the International Headache Society (IHS) International Classification of Headache Disorders (ICHD), 3rd edition (beta version) (ICHD-3 2013)Citation19, had a history of migraine headaches for ≥1 year prior to screening, and had migraine onset before 50 years of age. The primary results for all 4 clinical studies have been previously reportedCitation11–14.
The clinical studies included in this analysis complied with the Declaration of Helsinki, the International Conference on Harmonization Guidelines for Good Clinical Practice, and applicable local regulations. Ethics committees at all participating centers approved the protocol, and all patients provided written informed consent. This research was conducted as post-hoc analysis with anonymized dataCitation11–14.
Patient-Reported outcome measures (PROM) and variables of interest
The primary outcome was the annual indirect cost savings with GMB, calculated based on the MIDAS questionnaire. The unit of measurement for indirect cost savings was the international dollar (Int$). An Int$ would buy, in a particular country, the number of goods and services that a USD would buy in the US (in 2018)Citation20. The analysis was conducted for the overall population of the included studies and by region.
Secondary outcomes were annual indirect cost savings with GMB vs. PBO, annual indirect cost savings in Int$ among the employed population, and indirect cost savings with GMB in Int$ in patients with migraine headache day reduction. Sensitivity analyses included determining indirect cost savings in USD by region, indirect cost savings in EUR by region, indirect cost savings with GMB and GMB vs. PBO assuming that reduced productivity may not have occurred over the entire day, and indirect cost savings with GMB and GMB vs. PBO in the CONQUER study using Work Productivity and Activity Impairment (WPAI) questionnaireCitation21.
The MIDAS is a validated PROM that quantifies headache-related disability over a 3-month periodCitation22. The impact on patients’ life is measured in terms of days of work or school missed, days with productivity at work or school reduced to half or more, days with household work missed, days with productivity in household work reduced to half or more, and days missed family/social/leisure activities. In the MIDAS questionnaire, question 1 is used to measure absenteeism (i.e. number of days of missed work/school due to headaches in the last 3 months) and question 2 to measure presenteeism (i.e. number of days productivity at work/school was reduced by half or more due to headache in the last 3 months). Therefore, these 2 questions from MIDAS were used to estimate indirect costs. Higher scores on MIDAS indicate greater disability: (i) 0–5: little or no disability; (ii) 6–10: mild disability; (iii) 11–20: moderate disability; (iv) and 21+: severe disabilityCitation22. The WPAI is a 6-item questionnaire to assess the ability to work and perform regular activities. Except for the question on employment, questions on work productivity loss, absenteeism, presenteeism, and activity impairment focus on the activities in the past 7 daysCitation21.
Data for employment status were collected from the REGAIN and CONQUER studies only. During the individual studies, the clinical site personnel used direct questioning of patients on employment status. The patients could select only one responsible for their work status: “Employed” – working for pay, student (full or part-time), or self-employed; “Unemployed” – otherwise not in the responses of “Employed” including keeping house/household work (full-time), volunteer work, retired, or “Unemployed” due to unrelated to study disease disability or due to study disease disabilityCitation23. Patients were considered “Employed” if a patient had employment at both baseline and Month 3, “Unemployed” otherwise. Patients with a ≥ 50% reduction in monthly migraine headache days for EM or ≥30% reduction in monthly migraine headache days for CM, were included in the analysis.
Outcomes
The outcomes of interest are indirect costs. To account for the wage difference among multiple countries, indirect costs were derived at the patient level based on the MIDAS absenteeism and presenteeism and country-specific annual wage. For primary analysis and analysis by employment, indirect costs were calculated for each patient employed at baseline and Month 3 using the first two items in MIDAS as follows: (A + B)/60*country specific annual wage (where A = number of days missed work/school; B = number of days reduced productivity at work/school assuming 60 working days in 3 months; annual country-specific wages were obtained from the world economic outlook data). The annual indirect cost savings were expressed in terms of purchasing power parity (PPP) in Int$ in 2018 for all the analyses. Indirect cost savings were annualized by multiplying the proportion of work productivity loss by annual wage assuming the proportion of missing work (based on 3 months MIDAS) is the same throughout a year.
The annual indirect costs were also calculated as A + B/60, when calculated for patients with a reduction in migraine headache days, and when expressed in terms of USD (which was also converted to EUR). Country-specific annual wages were taken from the International Monetary Fund (IMF): “National Accounts: Gross domestic product per capita, current prices; PPP” for Int$ and “National Accounts: Gross domestic product per capita, U.S. dollars” for USD. The wages in USD were converted from USD to EUR using the exchange rate in October 2018 (1 USD = 0.8836 EUR)Citation24. For sensitivity analysis, as a more conservative estimate given that reduced productivity may not have occurred over the entire day, the indirect cost was calculated using A + 0.5B/60 and expressed in terms of Int$. This analysis equated lost productivity days to contribute to only half a day lost; however, patients will also experience days where their work productivity is reduced by levels <50% and these days are not accounted for in the MIDAS or this analysis.
Indirect costs (in Int$) were also determined in employed patients using the WPAI questionnaireCitation25 from the CONQUER studyCitation14, the only study with this measure. The WPAI overall work productivity loss score is expressed as percentages (absenteeism + presenteeism), with higher percentages indicating greater work productivity loss. The indirect cost due to migraine for each patient was calculated at baseline and Month 3 by multiplying the proportion of work productivity lost by the country-specific annual wage in Int$ in 2018.
The indirect cost savings (change from baseline to Month 3) and baseline indirect cost were used for the analyses. Using the WPAI questionnaireCitation25: Absenteeism (% work time missed due to migraine) = Q2/(Q2 + Q4) × 100; Presenteeism (% impairment while working due to migraine) = Q5 × 100/10 for those who actually worked in the past 7 days; and Overall Work Productivity Loss due to migraine (%) = (Q2/(Q2 + Q4) + (1 - Q2/(Q2 + Q4)) × (Q5/10)) × 100.
Statistical analysis
A pre-specified statistical analysis plan (separate from the clinical studies) was developed to document the objectives and the analysis methods for this research. Intent-to-treat population with a baseline and a Month 3 measurement of MIDAS (LOCF to Month 3 for patients with early dropout) Item 1 and Item 2 were used for all analyses. For indirect cost analyses, two-treatment arms (120 mg GMB + PBO) from the 4 studies were included in the analyses. We describe the baseline characteristics of each study population using frequencies with percentages for categorical variables and means with standard deviation (SD) for continuous variables.
Analysis of covariance (ANCOVA) models was performed with change from baseline in annual indirect costs as the dependent variable, treatment as the main effect controlling for covariates. For the pooled studies of EVOLVE-1 and EVOLVE-2, covariates in ANCOVA models included study ID, region, baseline annual indirect cost, and interaction between treatment and region. For the REGAIN study, covariates in ANCOVA models included region, baseline annual indirect cost, interaction between treatment and region, baseline medication overuse (yes/no), and concomitant prophylaxis use. For CONQUER overall, covariates in ANCOVA models included region, baseline annual indirect cost, the interaction between treatment and region, and baseline migraine headache day frequency category (low-frequency EM, and high-frequency EM, CM). For CONQUER, covariates in ANCOVA models included region, baseline annual indirect cost, and the interaction between treatment and region. Type III sum of squares for the least-squares means were used for the statistical comparisons. The least-square means for each arm and the difference between GMB and PBO were provided with 95% confidence intervals (CI). Results were reported by the study separatelyCitation11–14. Analyses by employment status (data from REGAIN and CONQUER), and by a reduction in migraine headache days (data from all 4 studies) after treatment with GMB were also conducted using ANCOVA models.
Treatment effects were evaluated based on a 2-sided significance level of 0.05 for all the analyses, with no adjustments made for multiplicity. P-value was used as an indicator of association between the treatment and the indirect costs savings Statistical Analysis System (SAS) version 9.4 (SAS Institute Inc) was used for all analyses.
Results
Patient demographics and baseline characteristics
Indirect costs were estimated in 1,201 patients with EM (mean age 41.9 ± 11.2 years), 759 with CM (mean age 41.3 ± 11.9 years), and 453 with previous failure of 2–4 migraine preventive medication categories (EM: n = 246, mean age 46.3 ± 11.4 years; CM: n = 189, mean age 45.3 ± 12.4 years). The majority of the patients across all the groups, i.e. patients with EM, CM, and EM or CM with previous failure of 2–4 migraine preventive medication categories were females. In addition, >70% of patients in REGAIN or CONQUER were employed. On average, patients with EM, CM, or EM with the previous failure of 2–4 migraine preventive medication categories had 3–4 comorbidities. In CONQUER, all patients had failed 2–4 migraine preventive medication categories. Whereas 36.0% of patients in the EVOLVE studies and 22.0% of patients in the REGAIN study were preventive treatment-naive ().
Table 1. Patient demographic and baseline characteristics.
Indirect cost savings with GMB – overall and by region
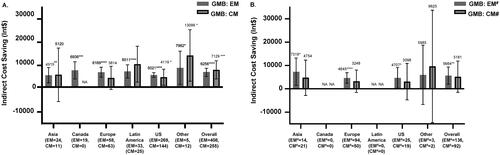
Treatment with GMB resulted in significant annual indirect cost savings, in patients with EM (Int$6256; 95% CI: 4,738, 7,774; p < .0001) and CM (Int$7129; 95%; CI: 3,378, 10,881; p < .001). Indirect cost savings were also seen with GMB treatment across all regions (). GMB resulted in significant indirect cost savings in patients with EM and previous failure of 2–4 migraine preventive medication categories (Int$5664; 95% CI: 1,966, 9,362; p = .0028). Indirect cost savings among patients with CM and previous failure of 2–4 migraine preventive medication categories did not reach statistical separation; however, were numerically similar to patients with EM and previous failure of 2–4 migraine preventive medication categories. Indirect cost savings with GMB were also greater in Asia, Europe, and the US for patients with EM and previous failure of 2–4 migraine preventive medication categories (). Indirect cost savings in total patients with previous failure of 2–4 migraine preventive medication categories after GMB treatment were significant (Int$5246; 95% CI: 1,696, 8,795; p = .0039).
Figure 1. Indirect cost savings with GMB in Int$. (A) Patients with EM or CM. (B) Patients with Failure of 2–4 Migraine Preventive Medication Categories. All data are presented as least square mean difference (95% CI). Abbreviations. CI, confidence interval; CM, chronic migraine; EM, episodic migraine; GMB, galcanezumab; Int$, international dollars; NA, patients not included from the region; PBO, placebo; US, United States. All indirect costs assumed a 5-day work week, which is 60 working days in 3 months as the number of work week may vary among regions. Least-squares mean in annual indirect cost savings in patients treated with GMB. #Defined as 2–4 migraine-preventive medication category failures at baseline over the past 10 years. *p < .05; **p < .01; ***p < .001; ****p < .0001.
Indirect cost savings with GMB vs. PBO – EM and CM
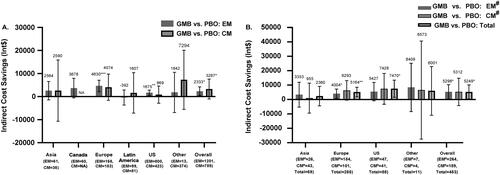
Compared with PBO treated patients, GMB treated patients had significantly greater mean indirect cost savings in the EM group (Int$2333; 95% CI: 443, 4,223; p = .0156), but not in the CM group (Int$3287; 95% CI: −1,022, 7,595; p = .1347). Among the different regions, GMB showed significantly greater indirect cost savings vs. PBO in Europe (Int$4630; 95% CI: 2,143, 7,117; p = .0003) and the US (Int$1675; 95% CI: 529, 2,821; p = .0042) in patients with EM ().
Figure 2. Annual indirect cost savings with GMB 120 mg vs. PBO in Int$. (A) Patients with EM or CM. (B) Patients with failure of 2–4 migraine preventive medication categories. All data are presented as least square mean difference (95% CI). Abbreviations. CI, confidence interval; CM, chronic migraine; EM, episodic migraine; GMB, galcanezumab; Int$, international dollars; NA, patients not included from the region; PBO, placebo; US, United States. #Defined as 2–4 migraine-preventive medication category failures at baseline over the past 10 years. All indirect costs assumed a 5-day work week, which is 60 working days in 3 months as the number of workweek may vary among regions. Least-squares mean difference in annual indirect cost savings in patients treated with GMB vs. patients treated with PBO. *p < .05; **p < .01; ***p < .001.
Indirect cost savings with GMB vs. PBO – patients with previous failure of 2–4 migraine preventive medication categories
Significantly greater savings were observed in patients with EM and previous failure of 2–4 migraine preventive medication categories (Int$5298; 95% CI: 267, 10,329; p = .0391) and the total patients with previous failure of 2–4 migraine preventive medication categories (Int$5249; 95% CI: 395, 10,102; p = .0341) from the CONQUER study (). Compared with PBO, GMB treated patients with EM and previous failure of 2–4 migraine preventive medication categories from Europe (Int$4004; 95% CI: 768, 7,240; p = .0155), all patients with the previous failure of 2–4 migraine preventive medication categories from Europe (Int$5164; 95% CI: 1,858, 8,470; p = .0023) and the US (Int$7470; 95% CI: 1,524, 13,416; p = .0139) had significantly higher indirect cost savings ().
Indirect cost saving with GMB – in employed patients
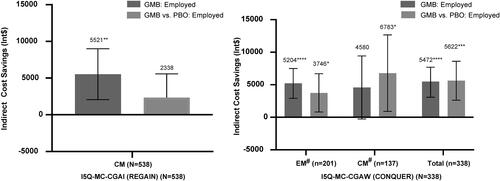
GMB showed significantly greater indirect cost savings after treatment (change from baseline) among employed patients with CM (Int$5521; 95% CI: 2,058, 8,984; p = .0018), and with previous failure of 2–4 migraine preventive medication categories (Int$5472; 95% CI: 3,075, 7,869; p < .0001). Compared with PBO, GMB showed significantly greater indirect cost savings in patients with previous failure of 2–4 migraine preventive medication categories (Int$5622; 95% CI: 2,631, 8,613; p = .0002) ().
Figure 3. Annual indirect cost savings in Int$– employed population. All data are presented as least square mean difference (95% CI). No patients enrolled from Canada and Latin America. Abbreviations. CI, confidence interval; CM, chronic migraine; EM, episodic migraine; GMB, galcanezumab; Int$, international dollar; PBO, placebo; US, United States. All indirect costs assumed a 5-day work week, which is 60 working days in 3 months as the number of workweek may vary among regions. Least-squares mean difference in annual indirect cost savings in patients treated with GMB, and in patients treated with GMB vs. PBO. #Defined as 2–4 migraine-preventive medication category failures at baseline over the past 10 years. *p < .05; **p < .01; ***p < .001; ****p < .0001.
Indirect cost saving with GMB – in patients with reduction in migraine headache days
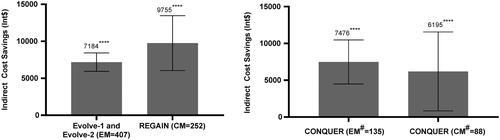
In patients with a reduction in migraine headache days, GMB showed significant indirect cost savings (change from baseline) in patients with EM (Int$7184; 95% CI: 5,939, 8,429; p < .0001), patients with CM (Int$9755; 95% CI: 6,042, 13,469; p < .0001), and in patients with previous failure of 2–4 migraine preventive medication categories (EM: Int$7476; 95% CI: 4,488, 10,464; p < .0001; and CM: Int$6195; 95% CI: 835, 11,555; p = .0238) ().
Figure 4. Indirect cost savings with GMB in Int$ – patients with reduction in migraine headache days. All data are presented as mean differences (95% CI). Abbreviations. CI, confidence interval; CM, chronic migraine; EM, episodic migraine; LS, least squares; MHD, migraine headache days. Migraine headache days responders: ≥50% reduction in monthly migraine headache days for EM or ≥30% reduction in monthly migraine headache days for CM; and non-responders (otherwise). aLeast-squares mean difference in annual indirect cost savings in responders after treatment with GMB. bLeast-squares mean difference in indirect cost savings in responders vs. non-responders in patients treated with GMB. # Defined as 2–4 migraine-preventive medication category failures at baseline over the past 10 years. *p < .05; **p < .01; ***p < .001; ****p < .0001.
Sensitivity analyses
Indirect cost savings in USD and EUR – overall and by region
Indirect cost savings with GMB were significant in the patients with EM (USD 6118; 95% CI: 4,652, 7,584, and EUR 5406; 95% CI: 4,110, 6,701; p < .0001 for both), or CM (USD 7051; 95% CI: 3,563, 10,539, and EUR 6230; 95% CI: 3,148, 9,312; p < .0001 for both), or EM and previous failure of 2–4 migraine preventive medication categories (USD 4490; 95% CI: 1,427, 7,552, and EUR 3967; 95% CI: 1,261, 6,673, p = .0042 for both) (Supplementary Table S1 and Supplementary Table S2).
GMB treated patients with EM (USD 2,079; 95% CI: 255, 3,902, and EUR 1837; 95% CI: 225, 3,448; p = .0255 for both), and EM with previous failure of 2–4 migraine preventive medication categories (USD 4,661; 95% CI: 491, 8,832; and EUR 4119; 95% CI: 434, 7,804; p = .0286 for both) had significantly greater indirect cost savings vs. PBO (Supplementary Table S1 and Supplementary Table S2).
Indirect cost savings with GMB and GMB vs. PBO in int$ – 0.5B for presenteeism
Supplementary Table S3 presents the sensitivity analysis (i.e. A + 0.5B/60) for indirect cost savings in patients after treatment with GMB overall population and by region. Patients with EM (Int$3911; 95% CI 2,865, 4,957; p < .0001) and patients with CM (Int$4478; 95% CI: 1,827, 7,129; p = .0009) had significantly greater indirect cost savings after treatment with GMB. Patients with EM and previous failure of 2–4 migraine preventive medication categories also had significantly greater indirect cost savings after treatment with GMB (Int$3619; 95% CI: 1,003, 6,236; p = .0069). For GMB vs. PBO, only patients with EM in Europe and the US demonstrated significant indirect cost savings.
Indirect cost savings with GMB and GMB vs. PBO in CONQUER study – using WPAI
GMB showed significant annual indirect cost savings in employed patients with previous failure of 2–4 migraine preventive medication categories (EM: Int$8160; 95% CI: 2,007, 14,313; p = .0097, CM: Int$7054; 95% CI: 2,081, 12,027; p = .0059, and total: Int$8077; 95% CI: 4,206, 11,948; p < .0001) from the CONQUER study. Other than the US, the total population with the previous failure of 2–4 migraine preventive medication categories from other regions also showed significant annual indirect cost savings (Supplementary Figure S1).
Compared with PBO, GMB showed significant annual indirect cost savings in patients with previous failure of 2–4 migraine preventive medication categories (CM: Int$11819; 95% CI: 3,701, 19,937; p = .0047, and total: Int$8231; 95% CI: 2,607, 13,854; p = .0043) (Supplementary Figure S2).
Discussion
The results of this post-hoc analysis of 4 Phase 3 studies indicate greater indirect cost savings in patients with migraine after 3-months of treatment with GMB in comparison with baseline and in patients treated with GMB vs. PBO. Indirect costs were numerically reduced relative to baseline in all the included populations, i.e. patients with EM or CM, patients with previous failure of 2–4 migraine preventive medication categories (EM and CM), overall and for all the regions. Furthermore, statistically significant separation in annual indirect cost savings was observed after 3 months of GMB treatment for the following global populations: EM, CM, and EM with the previous failure of 2–4 migraine preventive medication categories. Indirect cost savings were substantial with GMB vs. PBO for all the population groups; however, significant differences were observed for patients with EM and the population with previous failure of 2–4 migraine preventive medication categories (EM and CM). We also observed a trend of higher indirect cost savings after treatment with GMB and GMB vs. PBO in employed patients. In addition, the annual indirect cost savings in patients with a reduction in migraine headache days were greater after GMB treatment.
This study is important because it provides unique data on indirect cost savings after GMB treatment across multiple migraine subgroups and in multiple geographical regions. In addition, we used unique methods which accounted for the global nature of the included clinical trials; the methods for the analysis leveraged the use of MIDAS (questions 1 and 2), a validated PRO for migraine, which was used to quantify the indirect cost savings from 4 clinical studies conducted globally (EVOLVE-2, REGAIN and CONQUER) and regionally (EVOLVE-1 in North America) in patients with EM, CM, and patients with a history of 2–4 treatment failures. Thus, the clinical trials used to quantify economic benefit encompass a broad range of the migraine population defined by geography and migraine type. The methods accounted for the wage differences by country of residence deriving indirect costs based on the MIDAS absenteeism and presenteeism and country-specific annual wage, which is different from the previous study by Porter et al.Citation17 where the US hourly wage was applied even though patients were from multiple countries. To reinforce our findings, indirect costs were also estimated in employed patients based on the WPAI questionnaire from the CONQUER study, in which our findings were confirmed. As migraine-related productivity losses are a major burden for patients, employers, and societyCitation3,Citation4; there was a need to evaluate the degree of reduced productivity losses with GMB. The current research is important to the field in that indirect cost burden in migraine and cost savingsCitation26 are essential to understanding the societal value of CGRP-targeted medications, including GMBCitation27.
Disability in patients with migraine extends to multiple aspects of life, which in turn translate to an economic burden for patientsCitation28,Citation29. In the US, indirect costs of migraine (absenteeism and presenteeism) far exceed the cost of outpatient management and the inpatient/emergency department costsCitation30,Citation31. In Europe, the Eurolight study showed indirect costs accounting for up to 93% of the annual per-person management cost of migraine, with presenteeism and absenteeism from work as the major drivers of the indirect costsCitation4,Citation7. Using the data from Global Campaign population-based studies, Thomas et al. demonstrated a significant positive association between migraine and lost paid worktime, lost household work time, and total productivity. The study also demonstrated a >20% recovery in productivity after effective treatmentCitation32. Multiple factors are associated with an increased cost burden of migraine, which includes the longer duration of migraine, higher frequency of attacks, and headaches with substantial to severe impactCitation33,Citation34. Studies have shown the effect of non-CGRP preventive treatments in reducing the utilization of healthcare resources and costs and reducing migraine-related productivityCitation6,Citation30,Citation31. However, non-CGRP preventive treatment classes are limited by challenges of high discontinuation rates due to lack of efficacy and/or safety/tolerabilityCitation35, which could have implications to work productivity.
A previous study utilized a Markov model to determine the cost-effectiveness of preventive migraine pharmacotherapy and demonstrated that preventive medications were cost-effective compared with abortive medication; however, the study did not include CGRP targeted medicationsCitation31. Non-pharmacologic measures also play a role in migraine management and in reducing productivity losses. For example, Burton et al. used a migraine education intranet website to educate patients with migraine. Following the program for 6-months led to patients recognizing the triggers for migraine, relaxation and stress management, consulting physicians, and changing medications. These measures led to a reduction in workdays missed and a reduction in loss of work productivity with migraineCitation30. Seng et al. showed that mindfulness-based cognitive therapy reduced MIDAS scores in a randomized trialCitation36. In addition, similar to this research a previous study used the questions on absenteeism and presenteeism from the MIDAS questionnaire (questions 1 and 2); however, the methods were different which entailed using a zero-inflated Poisson regression model to calculate lost productivity costs; actual estimates of potential cost-saving with erenumab treatment were not determinedCitation17. Tinelli et al. developed economic evaluation models for migraine, tension-type headache (TTH), and medication overuse headache (MoH) using the WHO-CHOICE framework from European Region country settings (Russia, Spain, and Luxemburg). The migraine model showed cost-effectiveness, and cost savings over the current standard treatment. The findings from the models were consistent with our findingsCitation37,Citation38. In the current analysis, treatment with GMB, a migraine preventive treatment, resulted in significant annual indirect cost savings in patients with EM, CM, and EM with previous failure of 2–4 migraine preventive medication categories in terms of Int$. The cost-benefit with GMB treatment after 3-months (vs. baseline and vs. PBO) could be attributed to the decrease in the number of monthly migraine headache daysCitation11–14, which is in line with the previous studies in which preventive treatment for migraine was administered.
Traditional MIDAS scoring weights a day of absenteeism and a day when productivity is reduced by 50% or more as equivalent based on a validation study using a daily productivity diaryCitation39. We believe this is accurate because MIDAS does not count days where work productivity is reduced by levels <50%. We conducted a sensitivity analysis assuming that a reduced productivity day resulted in only half a day of work loss; using 0.5 for presenteeism we also demonstrated significant indirect cost savings in patients with EM (p < .0001), CM (p = .0009), and patients with EM and previous failure of 2–4 migraine preventive medication categories (p = .0069) after treatment with GMB, which was similar to the original analysis. This sensitivity analysis was conducted to provide a conservative estimate.
The indirect cost savings were also expressed in USD and EUR. As observed for Int$, the indirect cost savings with GMB were significant for the populations with EM (p < .0001 for both), CM (p < .0001 for both), and EM with previous failure of 2–4 migraine preventive medication categories (p = .0042 for both). For GMB vs. PBO, indirect cost savings were significant in USD and EUR for populations with EM and EM with previous failure of 2–4 migraine preventive medication categories. The calculation of indirect cost savings in USD and EUR allows for interpretation in familiar financial units.
Indirect costs due to productivity loss with migraine are significant, especially in employed patientsCitation26,Citation40. A previous study demonstrated that patients with ≥15 headache days/month had a significantly greater chance of losing employmentCitation34. Therefore, we conducted a sensitivity analysis in employed patients, which demonstrated significant indirect cost savings at Month 3 after treatment with GMB for CM (p = .0018), and patients with previous failure of 2–4 migraine preventive medication categories (p < .0001). The sensitivity analysis is important as it demonstrates the equivalency of cost savings in an employed population, i.e. gives more confidence in results, given that a limitation was that not all the trials captured who was employed.
As discussed previously, a reduction in migraine headache days is associated with loss of productivity and indirect costsCitation30,Citation33. The findings in our study for patients with a reduction in migraine headache days also showed significant indirect cost savings after GMB treatment for EM (p < .0001), for CM (<.0001), and for patients with previous failure of 2–4 migraine preventive medication categories (p < .0001 for EM; p = .0238 for CM). This sensitivity analysis by responder status addressed the question that in the real world, patients who respond to treatment will remain on treatment, and therefore, will be the population that contributes to more indirect cost savings over time.
The strengths of our study include the sensitivity analyses conducted to factor in the real-world scenarios: (i) considering 0.5 days lost for a conservative estimate of indirect costs; (ii) extrapolating the findings to USD and EUR, which may be easier to understand; (iii) highlighting the indirect costs in employed patients and patients with reduction in migraine headache days; the expected population to be treated with GMB and who contribute to employment costs.
There are a few limitations to our research. First, the studies included were not specifically designed to analyze indirect costs and employment status was not captured in 2 of the 4 clinical trials. We approximated indirect costs at the patient level based on the MIDAS absenteeism and presenteeism and country-specific annual wage, which may not reflect the indirect costs. Sensitivity analyses in the employed patients from the REGAIN and CONQUER studies showed similar indirect cost savings after treatment (change from baseline) and for GMB vs. PBO treated patients. Second, as this is a post-hoc analysis of PBO controlled studies, this analysis did not include an active comparator. However, previous data have shown that adherence and persistence are higher with GMB versus non-CGRP preventive medicationsCitation41. From a clinical perspective, indirect cost savings with preventive migraine treatment cannot be assumed, as multiple factors need to be considered, including persistence with treatment, efficacy, and the safety/AE profile of the treatment. Third, the collection of employment status did not allow for more than 1 selection, which might have introduced misclassification bias in the analyses. That is, patients who had 2 employment statuses were not reflected (e.g. retired and working part-time). Fourth, not distinguishing between full and part-time employment in this study, may lead to underestimation. Fifth, the results of this analysis may not be generalizable to other real-world patient populations or outside the countries in the study. Furthermore, this analysis did not consider the extended social coverage provided in European countries for patients with reduced productivity or without employment. Last, MIDAS is subject to recall bias due to the 3-month recall period and might be less precise compared with WPAI (which has a 1-week recall period). Reilly et al. showed that the WPAI score might be influenced by the most severe disease during an interval and suggested the use of a recall period ≤24 h to reduce recall bias. However, for episodic migraine, the reliability of WPAI might be improved with longer sampling intervals or by averaging multiple 7-day sampling intervalsCitation42. On the other hand, MIDAS estimates have been validated against a 3 month diary for activity limitations due to migraineCitation43.
Conclusion
In conclusion, treatment with GMB resulted in indirect cost savings at Month 3 after treatment (change from baseline) in patients with EM or with CM across regions, and in a population with previous failure of 2–4 migraine preventive medication categories. Similarly, GMB-treated patients also had greater indirect cost savings compared with PBO in patients with EM. GMB also caused significant indirect cost savings in patients with a reduction in migraine headache days at Month 3 from baseline. Overall, these results indicated that treatment with GMB reduced the indirect costs of migraine due to lost work productivity.
Transparency
Declaration of funding
This study was funded by Eli Lilly and Company.
Declaration of financial/other relationships
JHF, ATH, WY, RMN, and KS are employees and stockholders at Eli Lilly and Company.
RB is a former employee of Eli Lilly and Company.
JT is an employee of Neurosciences Clinic, Banner University Medical Center. He is a former employee of Xenoscience Inc. (affiliation during the research and manuscript writing). Independent Contractor (Including Contracted Research), Speaking, Teaching, and Advisory Boards 2021 – Eli Lilly and Company; Speaking – SK Life Sciences, Lundbeck, Eli Lilly and Company, AbbVie.
XM is an employee of TechData Service Company and is under contract with Eli Lilly and Company.
RBL: Consulting – AbbVie (Allergan), Amgen, Biohaven, Dr. Reddy’s Laboratories (Promius), ElectroCore, Eli Lilly and Company, eNeura Therapeutics, GlaxoSmithKline, Merck, Novartis, Teva, Vector, and Vedanta Research; Membership on Advisory Committees or Review Panels - American Academy of Neurology, American Headache Society, Biovision, Dr. Reddy’s (Promius), Equinox, Grifols, Headache, Lundbeck (Alder), Pernix, and Pfizer; Stocks – Biohaven, CtrlM; Board Membership – Cephalgia, Neurology; Received Royalties – Informa (Other Activities), Wolff's Headache, 8th edition (Oxford University Press, 2009) (Other Activities); Others – Migraine Research Foundation, National Headache Foundation, National Institute of Neurological Disorders and Stroke, National Institute on Aging, and National Institutes of Health.
A reviewer on this manuscript has disclosed that they have received honoraria from Allergan, Novartis, Lilly and Teva Pharmaceuticals for their work as a consultant and speaker. Peer reviewers on this manuscript have no other relevant financial relationships or otherwise to disclose.
Author contributions
Conception of work: JHF. Design of the work: JHF. Acquisition of data: JT, RB, WY, XM. Data Analysis: WY, XM. Data interpretation: JT, JHF, ATH, RMN, RB, KS, RBL. Manuscript writing and critical revision: JT, JHF, ATH, RMN, WY, RB, KS, RBL. Final approval: JT, JHF, ATH, RMN, WY, RB, XM, KS, RBL.
Previous presentations
The data were presented as a poster at the 63rd Annual Meeting American Headache Society (P-78: https://headachejournal.onlinelibrary.wiley.com/doi/10.1111/head.14130).
Supplemental Material
Download MS Word (274.8 KB)Acknowledgements
None reported.
Data availability statement
Lilly provides access to all individual participant data collected during the trial, after anonymization, with the exception of pharmacokinetic or genetic data. Data are available to request 6 months after the indication studied has been approved in the US and EU and after primary publication acceptance, whichever is later. No expiration date of data requests is currently set once data are made available. Access is provided after a proposal has been approved by an independent review committee identified for this purpose and after receipt of a signed data sharing agreement. Data and documents, including the study protocol, statistical analysis plan, clinical study report, blank or annotated case report forms, will be provided in a secure data sharing environment. For details on submitting a request, see the instructions provided at www.vivli.org.
References
- Ford JH, Foster SA, Nichols RM, et al. A real-world analysis of patient-reported outcomes in patients with migraine by preventive treatment eligibility status in the US and Europe. J Patient Rep Outcomes. 2020;4(1):630.
- Vo P, Paris N, Bilitou A, et al. Burden of migraine in Europe using self-reported digital diary data from the migraine buddy(c) application. Neurol Ther. 2018;7(2):321–332.
- Yucel A, Thach A, Kumar S, et al. Estimating the economic burden of migraine on US employers. Am J Managed Care. 2020;26(12):e403–e408.
- Agosti R. Migraine burden of disease: from the patient's experience to a socio-economic view. Headache. 2018;58(Suppl 1):17–32.
- Shimizu T, Sakai F, Miyake H, et al. Disability, quality of life, productivity impairment and employer costs of migraine in the workplace. J Headache Pain. 2021;22(1):29.
- Bonafede M, Sapra S, Shah N, et al. Direct, indirect healthcare resource utilization and costs among migraine patients in the United States. Headache. Avaibale on https://www.ajmc.com/view/study-summary-costs-associated-with-migraine-in-the-united-states.
- Linde M, Gustavsson A, Stovner LJ, et al. The cost of headache disorders in Europe: the eurolight project. Eur J Neurol. 2012;19(5):703–711.
- Haw NJ, Cabaluna IT, Kaw GE, et al. A cross-sectional study on the burden and impact of migraine on work productivity and quality of life in selected workplaces in the Philippines. J Headache Pain. 2020;21(1):125.
- Negro A, Sciattella P, Rossi D, et al. Cost of chronic and episodic migraine patients in continuous treatment for two years in a tertiary level headache Centre. J Headache Pain. 2019;20(1):120.
- Polson M, Williams TD, Speicher LC, et al. [cited 2021 October 4]. Available from: https://www.ajmc.com/view/total-cost-of-care-in-patients-with-migraine-a-realworld-claims-analysis.
- Stauffer VL, Dodick DW, Zhang Q, et al. Evaluation of galcanezumab for the prevention of episodic migraine: the EVOLVE-1 randomized clinical trial. JAMA Neurol. 2018;75(9):1080–1088.
- Skljarevski V, Matharu M, Millen BA, et al. Efficacy and safety of galcanezumab for the prevention of episodic migraine: results of the EVOLVE-2 phase 3 randomized controlled clinical trial. Cephalalgia. 2018;38(8):1442–1454.
- Detke HC, Goadsby PJ, Wang S, et al. Galcanezumab in chronic migraine: the randomized, double-blind, placebo-controlled REGAIN study. Neurology. 2018;91(24):e2211–e2221.
- Mulleners WM, Kim BK, Lainez MJA, et al. Safety and efficacy of galcanezumab in patients for whom previous migraine preventive medication from two to four categories had failed (CONQUER): a multicentre, randomised, double-blind, placebo-controlled, phase 3b trial. Lancet Neurol. 2020;19(10):814–825.
- Ford J, Tassorelli C, Leroux E, et al. Changes in patient functioning and disability: results from a phase 3, double-blind, randomized, placebo-controlled clinical trial evaluating galcanezumab for chronic migraine prevention (REGAIN). Qual Life Res. 2021;30(1):105–115.
- Smitherman TA, Tietjen GE, Schuh K, et al. Efficacy of galcanezumab for migraine prevention in patients with a medical history of anxiety and/or depression: a post hoc analysis of the phase 3, randomized, double-blind, placebo-controlled REGAIN, and pooled EVOLVE-1 and EVOLVE-2 studies. Headache. 2020;60(10):2202–2219.
- Porter JK, Di Tanna GL, Lipton RB, et al. Costs of acute headache medication use and productivity losses among patients with migraine: insights from three randomized controlled trials. Pharmacoecon Open. 2019;3(3):411–417.
- Silberstein SD, Holland S, Freitag F, et al. Evidence-based guideline update: pharmacologic treatment for episodic migraine prevention in adults: report of the quality standards subcommittee of the American Academy of Neurology and the American Headache Society. Neurology. 2012;78(17):1337–1345.
- Headache Classification Committee of the International Headache Society (HIS). The international classification of headache disorders, 3rd edition (beta version). Cephalalgia. 2013;33(9):629–808.
- Gross Domestic Product (GDP), per capita, international $(PPP-adjusted). [cited 2021 October 4]. Available on https://www.who.int/data/gho/indicator-metadata-registry/imr-details/1145.
- Work Productivity and Activity Impairment Questionnaire: General Health V2.0 (WPAI:GH). [cited 2021 August 2]. Available on http://oml.eular.org/sysModules/obxOML/docs/id_98/WPAI-GH_English_US_V2.pdf.
- The Migraine Disability Assessment Test. [cited 2021 June 15]. Available on https://headaches.org/wp-content/uploads/2018/02/MIDAS.pdf.
- Ford JH, Tockhorn-Heidenreich A, Nichols RM, et al. Annual Indirect Cost Savings in Patients with Episodic or Chronic Migraine: Post-hoc Analyses from Multiple Galcanezumab Clinical Trials (P-78). 63rd Annual Scientific Meeting American Headache Society. [cited 2021 October 21]. Available from: 10.1111/head.14130.
- World Economic Outlook Database. Gross Domestic Product Per Capita 2021. US. [cited 2021 August 2]. Available on https://www.imf.org/en/Publications/WEO/weo-database/2021/April/select-country-group.
- Work Productivity and Activity Impairment Questionnaire: General Health V2.0 (WPAI:GH). [cited 2021 October 4]. Available on https://oml.eular.org/sysModules/obxOML/docs/id_98/WPAI-GH_English_US_V2.pdf.
- Lubloy A. Economic burden of migraine in Latvia and Lithuania: direct and indirect costs. BMC Public Health. 2019;19(1):1242.
- Seddik AH, Schiener C, Ostwald DA, et al. Social impact of prophylactic migraine treatments in Germany: a state-transition and open cohort approach. Value Health. 2021;24(10):1446–1453.
- Leonardi M, Raggi A. A narrative review on the burden of migraine: when the burden is the impact on people's life. J Headache Pain. 2019;20(1):41.
- Buse DC, Yugrakh MS, Lee LK, et al. Burden of illness among people with migraine and >/= 4 monthly headache days while using acute and/or preventive prescription medications for migraine. JMCP. 2020;26(10):1334–1343.
- Burton WN, Chen CY, Li X, et al. Evaluation of a workplace-based migraine education program. J Occup Environ Med. 2016;58(8):790–795.
- Yu J, Smith KJ, Brixner DI. Cost effectiveness of pharmacotherapy for the prevention of migraine: a Markov model application. CNS Drugs. 2010;24(8):695–712.
- Thomas H, Kothari SF, Husoy A, et al. The relationship between headache-attributed disability and lost productivity: 2. Empirical evidence from population-based studies in nine disparate countries. J Headache Pain. 2021;22(1):153.
- Pradeep R, Nemichandra SC, Harsha S, et al. Migraine disability, quality of life, and its predictors. Ann Neurosci. 2020;27(1):18–23.
- Stewart WF, Wood GC, Bruce C, et al. Longitudinal change in migraine headache-days and indirect cost consequences. J Occup Environ Med. 2011;53(5):478–487.
- Hepp Z, Bloudek LM, Varon SF. Systematic review of migraine prophylaxis adherence and persistence. J Manag Care Pharm. 2014;20(1):22–33.
- Seng EK, Singer AB, Metts C, et al. Does mindfulness-based cognitive therapy for migraine reduce migraine-related disability in people with episodic and chronic migraine? A phase 2b pilot randomized clinical trial. Headache. 2019;59(9):1448–1467.
- Tinelli M, Leonardi M, Paemeleire K, et al. Structured headache services as the solution to the ill-health burden of headache. 2. Modelling effectiveness and cost-effectiveness of implementation in Europe: methodology. J Headache Pain. 2021;22(1):99.
- Tinelli M, Leonardi M, Paemeleire K, et al. Structured headache services as the solution to the ill-health burden of headache. 3. Modelling effectiveness and cost-effectiveness of implementation in Europe: findings and conclusions. J Headache Pain. 2021;22(1):90.
- Stewart WF, Lipton RB, Kolodner KB, et al. Validity of the migraine disability assessment (MIDAS) score in comparison to a diary-based measure in a population sample of migraine sufferers. Pain. 2000;88(1):41–52.
- Martelletti P, Schwedt TJ, Vo P, et al. Healthcare resource use and indirect costs associated with migraine in Italy: results from the my migraine voice survey. J Med Econ. 2021;24(1):717–726.
- Varnado O, Manjelievskaia J, Ford F, et al. P0218. Adherence and persistence to preventive migraine treatments over 12 months follow-up for patients with migraine: calcitonin gene-related peptide monoclonal antibodies versus other preventive treatments. Cephalalgia. 2021;41(1S):1–227.
- Reilly MC, Bracco A, Ricci JF, et al. The validity and accuracy of the work productivity and activity impairment questionnaire–irritable bowel syndrome version (WPAI:IBS). Aliment Pharmacol Ther. 2004;20(4):459–467.
- Stewart WF, Lipton RB, Dowson AJ, et al. Development and testing of the migraine disability assessment (MIDAS) questionnaire to assess headache-related disability. Neurology. 2001;56(6 Suppl 1):S20–S8.