
Abstract
Aims
The Parkinson’s KinetiGraph (PKG) is a wrist-worn movement recording system that collates continuous, objective, data during daily activities in people with Parkinson’s disease (PD) providing a report for clinicians. This study explores the cost-effectiveness of adding the PKG to routine PD assessments.
Methods
A de novo Markov model of three health states: uncontrolled, controlled and death compared PKG plus routine assessment by a Movement Disease Specialist (MDS) versus routine assessment. Uncontrolled and controlled states were based on the Movement Disorder Society – Unified Parkinson’s Disease Rating Scale (MDS-UPDRS) II and III scores. The transition between health states was dependent on improvement in MDS-UPDRS II and III, and transition to death state on all cause-mortality and PD-specific relative mortality risk. Markov cycle length was yearly beyond year 1 and lifetime horizon 22 years.
Limitations
PKG evidence incorporated in this analysis is based on findings from one clinical trial. Health state utilities were mapped and the probability of patients progressing from uncontrolled to controlled health state at the second visit and beyond was derived from a bootstrap method which assumed a normal distribution for MDS-UPDRS.
Results
The addition of the PKG to usual PD assessments is a cost-effective intervention. PKG plus routine assessment is associated with lower total costs compared to routine assessment (£141,950 versus £159,312) and improved quality-adjusted life years (7.88 versus 7.61), resulting in an incremental cost-effectiveness ratio of −£64,978.99 and a net monetary benefit of £22,706.37 using a £20,000 threshold. Results were robust across sensitivity and scenario analyses.
Conclusions
Management of PD involves monitoring and evaluation of symptoms to assess disease progression and ensure appropriate treatment choices. Adding the PKG to clinical assessment in routine care allows for improved and objective identification of PD motor symptoms which can be used in clinical decision making to improve patient outcomes.
PLAIN LANGUAGE SUMMARY
Hospital doctors caring for people with Parkinson's disease (PwP) regularly monitor and assess their patients’ symptoms, relying on patient recall and patient-completed diaries to find out about current symptoms, which can be unreliable. The Parkinson's KinetiGraph (PKG) is a wrist-worn device that collects continuous information on movement in PwP. A report is then provided to the patient's Consultant helping them to understand the PwP's symptoms and make decisions about changing medication to improve symptom control.
An economic model compared asking patients to wear a PKG device for 6 days before their check-up appointment with their Consultant with usual check-up without the PKG. Information from a clinical trial exploring the use of PKG provided data on Movement Disorder Society – Unified Parkinson's Disease Rating Scale (MDS-UPDRS) II and III scores, which were used in the model to predict improvements in quality of life and whether PwP had controlled or uncontrolled disease.
The model showed that addition of PKG to usual check-ups is a cost-effective approach. Use of the PKG reduced costs (£141,950 versus £159,312 for usual check-ups) and had a positive impact on quality and quantity of life as measured by quality adjusted life years (7.88 versus 7.61).
This study shows that adding the PKG to routine check-ups allows Consultants to accurately assess movement (or motor) symptoms in PwP, which can then be used to ensure optimal mediation choice and improve patient outcomes.
Introduction
Parkinson’s disease (PD) is a chronic, neurogenerative condition that primarily affects the elderly. It is one of the most common neurological conditionsCitation1 and the leading source of disability globallyCitation2,Citation3. Parkinson’s UK estimates that the prevalence of PD in the UK will rise from 145,000 in 2018 to 256,608 in 2065, driven principally by an aging populationCitation4. PD is expensive to manage and the cost of PD to the National Health Service (NHS) has been estimated at £4,422 per year for people with mild or moderate disease and £5,491 for those with severe disease (2013 cost data)Citation5.
PD is characterised by progressive degeneration of dopaminergic neurons in the nigrostriatal system, resulting in the core motor symptoms of bradykinesia (slowness of movement), rigidity, tremor, postural instabilityCitation6 and non-motor symptoms including vomiting, constipation, confusion, sleep disorders, depression, memory loss and cognitive impairment that can precede motor symptoms by several yearsCitation7,Citation8. Levodopa, administered in combination with carbidopa, remains the gold standard for the treatment of motor and non-motor symptoms of PDCitation9. It has a time-limited effect and fluctuations in symptoms, both motor and non-motor, that complicate this therapyCitation10, including end-of-dose-deterioration or “wearing-off”, peak dose dyskinesias (abnormal flailing motions) and non-motor fluctuations. Around 50% of PwP with late-stage disease develop “wearing off” symptoms before their next dose including bradykinesia, fluctuations and dyskinesiasCitation11.
Limitations of the current assessment of PD patients with fluctuating symptoms relate to the motor symptoms of bradykinesia, dyskinesia, gait dysfunction as well as non-motor symptoms, such as sleep dysfunction, fatigue, pain, depression, anxiety and cognitive dysfunction much of which could be part of non-motor fluctuations. Short periodic medical consultations lasting 15–30 min at intervals of 3–6 months are the standard of care (SOC) in the NHS and many other healthcare systems. These provide an inadequate opportunity for assessment of the overall motor and non-motor status of PwP. Digital solutions which can provide an objective assessment of motor functions and indirectly signpost some non-motor symptoms and subsequent transformation of these clinical endpoints, usually measured by scales, are currently a key unmet need in an effort to produce better patient outcomes.
The Parkinson’s KinetiGraph (PKG) is a wrist-worn movement recording system that collates continuous, objective, ambulatory movement data during daily activities. The PKG report provides clinicians with a graphic record of bradykinesia, dyskinesia, tremor, motor fluctuations, immobility and medication adherence. In addition, it provides a bradykinesia score (BKS) and a dyskinesia score (DKS), with indications of whether the patient is in or out of range based on a normal control population. The system also provides timed reminders to the patient who can then acknowledge taking their medication. The PKG device is worn for 6 days prior to consultation with the patient’s clinician and the PKG report can aid the clinician in optimising PD treatment according to the symptoms recorded.
Evidence suggests that improved functional status is related to a lower cost of care in PDCitation12. The efficacy of the PKG in enabling clinicians to optimise treatment thus improving symptomatic control is supported by a blinded, controlled study versus conventional monitoring, carried out by Woodrow et al.Citation13. The objective of this analysis is to explore the cost-effectiveness of the PKG and clinical assessment in the management of PD compared to SOC in the context of the UK NHS.
Methods
Model structure
A cost-utility model was developed using a Markov model structure. The model is made up of three health states: uncontrolled, controlled and death, with the chance of bidirectional transitions between all the states except death, which is an absorbent state.
The uncontrolled and controlled states are based on the Movement Disorder Society – Unified Parkinson’s Disease Rating Scale (MDS-UPDRS) II and III scores. In the Woodrow study, controlled patients were identified based on the bradykinesia score of BKS <26 corresponding to the MDS-UPDRS III score <30. Although the Woodrow study considered Total MDS-UPDRS as the primary end-point, MDS-UPDRS II and III were used in the model due to the availability of mapping algorithms and constitute the largest components of the Total MDS-UPDRS score. The MDS-UPDRS is an assessment tool used to measure the severity and progression of PD. It has four parts with a total summed score.
Part I: non-motor experiences of daily living
Part II: motor experiences of daily living
Part III: motor examination
Part IV: motor complications
The Markov model structure is presented in . The model has two inputs costs and utilities. The output is the cost per quality adjusted life year (QALY) and incremental cost effectiveness ratio (ICER). Patients accrue costs and utilities in each cycle until they die or complete a defined number of cycles.
Figure 1. Markov model structure.
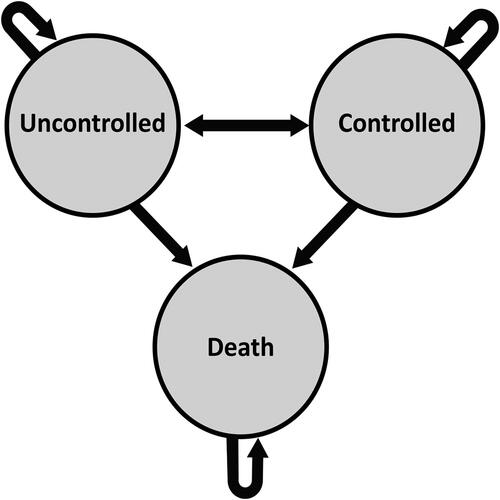
The oval boxes represent the health states in the model. Arrows denote the transition between health states and the occurrence of events. The transition between health states is dependent on the improvement in MDS-UPDRS II and III, and the transition to death state is dependent on all cause-mortality and PD-specific relative mortality risk.
The Markov cycle length is 1 year, with a lifetime horizon of 10–22 years to approximate lifetime treatment and capture the long-term costs and health effects of therapy. A half cycle correction is applied to costs and QALYs. The multi-state Markov model is deemed appropriate for use as it represents events that reoccur over time and patients move among a finite number of health states over the time period consideredCitation14. PwP is subject to disease progression, and the number of possible health states is finite.
All patients entering the model start in an uncontrolled state and transition to a controlled state providing their motor function is considered controlled after review by a Movement Disorder Specialist (MDS), with or without a PKG. The base case assumes that PKG + patients who are controlled will use two PKGs per year and of the uncontrolled patients, 50% will use three PKGs and 50% will use four PKGs per year.
During the initial 6 months cycle of the model, transition probabilities (TPs) between uncontrolled and controlled states were informed by the proportion of patients controlled after the initial use of the PKG device. After 6 months, TPs were estimated using a bootstrap approach.
The analysis used the perspective of the NHS and accounted for direct medical costs only. A discount rate of 3.5% was used for both costs and effects, in line with the National Institute for Health and Care Excellence (NICE) recommendations.
Patient population
The Markov model incorporated patient data derived from the pivotal study for the PKG, referred to as the Woodrow studyCitation13. summarises the values used for all baseline patient characteristics. The Woodrow study was a blinded, controlled trial that compared outcomes of routine clinical management by physicians with training in movement disorders to clinical management by similar physicians also assisted by the PKG. Patients were managed in one of two arms based on the availability of the PKG in the clinic where they received their regular care: the PKG + clinician (intervention or PKG+) and clinician (control or PKG) who received SOC (defined as a movement disorder consultation without the PKG). Almost one-quarter of patients in the Woodrow study had controlled PD at the time of enrolment, defined as in-target according to the PKG.
Table 1. Baseline characteristics.
The primary study outcome was the difference in MDS-UPDRS total score from baseline to the end of the study. Secondary outcomes included UPDRS III (the motor component of the UPDRS rating scale), Parkinson’s Disease Questionnaire 39 (PDQ-39) which assesses PD specific health-related quality of life across eight dimensions of daily living including relationships, social situations, and communication and the Severity of Non-dopaminergic Symptoms in Parkinson’s Disease (SENS-PD) scale which measures non-motor symptoms of PD.
In the PKG + arm, MDS-UPDRS total score significantly improved by 8.5 points and MDS-UPDRS III significantly improved by 6.4 points in the ON state over the duration of the study. The PDQ-39 and SENS-PD failed to reach statistical significance in the primary analysis, but the significant benefit was seen in a post hoc subgroup analysis of patients poorly controlled at the initiation. In the PKG − arm, the change in MDS-UPDRS total score, MDS-UPDRS III, PDQ-39 and SENS-PD failed to reach statistical significance.
Participating clinicians in the Woodrow study were of similar expertise and received 1-day training in the assessment of PD, emphasising the use of history to identify motor and non-motor features of PD, contra-indications to and side effects of anti-Parkinson’s medications, and recognition of candidates for device-assisted therapies. However, clinicians assigned to the PKG + arm received a further day of training in interpreting the PKG. Whilst this may not accurately represent current practice, the base case is modelled to mitigate the benefit observed in the Woodrow study to 75%.
Comparative treatments
The UK NICE Parkinson’s disease in adults guideline (2017) advocate that patients with a diagnosis of PD should be reviewed regularly (every 6–12 months). Once treatment is commenced, a follow-up (every 2–3 months) may be required to assess the response to medication and titrate dosageCitation15. The model compares PKG plus SOC (defined as clinical assessment as per NICE guidelinesCitation15) referred to as PKG + in this paper with SOC alone (referred to as PKG−).
The PKG system obtains data points every 2 min over a 6-day period and reporting of data is by a graphic presentation with scores indicating achievement of target levels of bradykinesia and dyskinesia. PD is defined as controlled if targets are met and as uncontrolled if targets are not met. The graphical and numerical output of the PKG is interpreted by an MDS during a clinical evaluation ().
Figure 2. Example of a PKG summary reportCitation16.
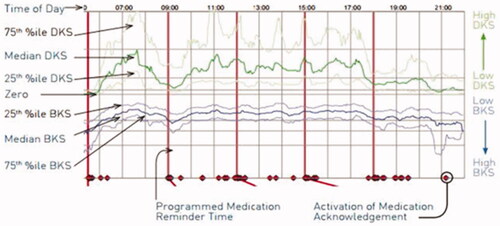
Data from the recording day aligned to the time of the day. Red horizontal lines show when medication reminders were given. Median DKS (green line), median BKS (blue line) and their 25th and 75th percentiles are plotted against time of day. Increasing/decreasing severity levels are represented on the right Y axis. Time patient acknowledged taking medications represented as red diamonds on the X axis.
Efficacy data
Clinical efficacy data and utilities were obtained from the Woodrow studyCitation13 and other published clinical and economic literatureCitation17,Citation18. Initial scores of all clinical scales including UPDRS II and UPDRS III were obtained at the screening visit in the Woodrow studyCitation13 and a PKG logger was provided to all patients. PKG results were only provided to clinicians in the PKG + group. These scores were obtained again at the study exit. For each treatment arm in the model, PKG + and PKG−, uncontrolled patients were assumed to have a UPDRS score in line with the UPDRS score obtained at the screening visit and controlled patients were assumed to have a controlled UPDRS.
Response in the PKG + arm in the Woodrow study was based on absolute reduction in UPDRS II and UPDRS III scores derived from data recorded at entry and data recorded between 09:00 and 18:00 after 6 recording days, together with routine clinician assessment. Response in the PKG − the arm was based on absolute reduction in UPDRS II and UPDRS III scores derived only from routine clinician’s assessment to determine whether treatment was adequate or if further treatment was required.
Patients were assumed to retain the 6–12 month treatment effect for 5 years, based on data from a systematic literature review on the impact of levodopa-carbidopa intestinal gelCitation19. Although the levodopa-carbidopa intestinal gel is not used in PwP with moderate disease, there is a lack of published evidence and this systematic literature review was considered an appropriate proxy.
The long-term waning of treatment effect, from 6 years onwards is assumed to gradually decline in line with the natural disease progression of PD. However, the progression rate varies from person to person and therefore the model supports two alternative rates of progression: a rate of progression based on a bootstrap analysis of published UPDRS III progression data, which equates to an average rate of progression of 10.9%Citation20 and a published annual rate of progression (2%–7%) based on a prospective studyCitation21.
Safety data
This model did not include adverse events (AEs). No serious AE, adverse device effects or discontinuation rates were reported during the Woodrow studyCitation13.
Mortality
Mortality is based on all-cause mortality probabilities from the UK Office of National Statistics Interim Life Tables 2018–2020Citation22. Additional PD-specific mortality rate was applied based on Xu et al.Citation23 who calculated a PD-specific Standardised Mortality Ratio of 2.22. The effect of mortality (all-cause and PD-specific) was incorporated by applying both mortality rates to patient traces of the Markov model.
Health state transitions
Probabilities of transitions between health states in the first 6 months were derived from the proportion of patients that were identified as controlled after the initial use of the PKG in the Woodrow studyCitation13. It is assumed that controlled patients at the first visit will not be reviewed until 6 months later as per standard practiceCitation15.
Utilities
Health state utilities
Patients’ responses to the UPDRS II and UPDRS III obtained from the Woodrow study were used in a published algorithm to accurately predict the EQ-5D index values. The values were based on the European population (European index) valued by a visual analogue technique and weights from the German population (German index) valued with the time trade-off approachCitation17.
A NICE 2016 model developed for the NICE PD guidelines was also used to inform utility values for the modelCitation18. The model estimated that health-related quality of life increases by 0.04 for every point reduction in UPDRS II and 0.02 for every point reduction in UPDRS III. shows the utility state values.
Table 2. Utility state values are used for cost-effectiveness analysis.
Table 3. Cost of PKG and service in the model (based on two visits per year).
Costs
Treatment and service costs
PKG costs were based on the manufacturer’s price list of £225, equating to £450 per year based on the recommended 6-monthly patient review for PwP in the UKCitation15. The base case assumes that controlled patients will use two PKGs and have two visits per year and of the uncontrolled patients, 50% will use three PKGs with three visits and 50% will use four PKGs with four visits per year ().
Service costs for all patients in the model were based on the NHS Schedule of Reference Costs 2019–2020 and 2020/21 Best Practice Tariff calculated by NHS England for PDCitation24. Costs associated with current service, monitoring of PD symptoms by an MDS is not included in the treatment service cost as the Best Practice Tariff only applies to year 1 post-diagnosis.
Health state-related costs
Costs in the model were obtained from a published literature review based on the progression of PD and costs over a lifetime. Direct medical and non-medical costs were based on the Hoehn and Yahr (HY) scaleCitation18. UPDRS scores were applied to derive average annual costs by HY stage, see . No cost was associated with the death health state.
Table 4. Direct medical and non-medical costs according to HY stage.
Sensitivity analyses
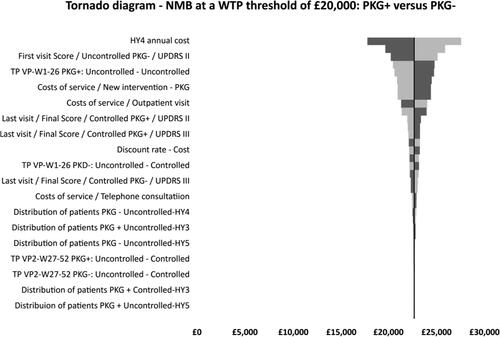
One-way sensitivity analysis (OWSA) and probabilistic sensitivity analysis (PSA) were carried out to determine the influence of uncertainty surrounding input parameters. OWSA was used to investigate variability on all parameters included in the model. Values for all parameters with univariate uncertainty distributions were set to their upper and lower limits of the confidence intervals. For unavailable data, a plausible range for values (i.e. ±20%) was applied. The results are presented in a Tornado diagram based on net monetary benefit (NMB). A positive NMB indicates the imputed values are cost-effective at the willingness to pay (WTP) threshold of £20,000.
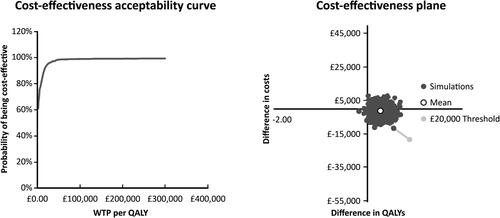
To account for the uncertainty in model inputs a PSA was conducted using Monte Carlo stimulationCitation25. Multiple model runs (1,000 iterations) were performed, each with a random draw from every parameter’s probabilistic distribution. The result is presented in a cost effectiveness acceptance curve (CEAC). See Supplementary Table 1 for a summary of variables applied to the model.
Scenario analyses were performed on model assumptions to better understand their impact on the results. The analyses were conducted by varying model efficacy inputs or assumptions at a time while holding other parameters constant with the base case values.
Two scenario analyses were carried out:
Zero face-to-face consultations to assess the benefit of PKG assuming a remote consultation compared to an in-person consultation
One face-to-face consultation to assess the cost effectiveness of PKG + MDS if one in-person consultation is held per year
Alternative scenarios using the PKG device and different consultation scenarios with varying proportions of patients were also carried out. The key inputs of the analyses are shown in Supplementary Table 2.
Results
Base case analysis
Base case results are summarised in . The intervention (PKG+) is associated with lower total costs compared to the control (PKG−) (£141,950 versus £159,312) and improved QALY (7.88 versus 7.61). This resulted in an ICER of −£64,978.99 and an NMB of £22,706.37 using a £20,000 threshold. Given the typical NICE threshold of £30,000 per QALY, the base case analysis indicates that PKG + is cost effective.
Table 5. Base case result: discounted costs and effects.
One-way sensitivity analysis
Results from the OWSA are shown in the Tornado diagram below () and in Supplementary Table 3. The analysis showed that the model outcome (PKG + dominated PKG−) was robust to variations in model assumptions. Key drivers of the cost-effectiveness results were identified. The ICER was most sensitive to the annual cost of HY stage 4 with the upper limit producing the greatest variation from the base case at £27,625 compared to the lower limit of £17,801 generating a difference of £9,824.
Figure 3. Tornado diagram – NMB at a WTP threshold of £20,000: PKG + versus PKG−.
Probabilistic sensitivity analysis
A cost effectiveness acceptability plot is shown in . This produced a mean incremental cost saving of £774 and a mean incremental QALY of 0.27 resulting in an ICER of £1,254 per QALY. The CEAC estimated that PKG + was more cost effective compared with PKG − in 93.4% of iterations, with a cost effectiveness at a WTP threshold of £20,000/QALY.
Figure 4. Cost-effectiveness plane and CEAC.
Scenario analysis
The scenario analyses demonstrated the robustness of the results. All the scenario analyses produced dominant ICERs, even when the effect size was 50% of that seen in the Woodrow paper. Furthermore, reductions in the number of face-to-face consultations, increases in telephone consultations and increasing the number of PKGs utilised to 3 all maintained a dominant ICER. Results of the scenario analyses are presented in Supplementary Table 4.
Discussion
This analysis indicates that the use of PKG with therapeutic decisions taken by an MDS is a cost-effective method of managing PD, with PKG + dominant over PKG−. Over a 22-year lifetime horizon, the model estimated an NMB of £22,706.37 at a WTP threshold of £20,000 with a cost saving of £17,362.37 per patient, a substantial incremental gain in QALYs for patients treated with PKG + of 0.267 and an associated ICER of −£64,978.99 compared to patients treated with routine assessment by MDS. Results of the sensitivity and scenario analyses demonstrated the robustness of the conclusions.
The Woodrow paper considers PwP with moderate disease (HY 1.9 ± 0.6 in the PKG + arm and 2.0 ± 0.6 in the PKG − arm). Therefore, it is likely that PKG will be used in approximately one-third of patients with moderate disease – which equates to around 53,000 PwP in the UK assuming that there are 159,000 PwP in the UK in 2022Citation4,Citation26. This group of PwP is the population with the most to gain from adjustment to their medication and optimising of treatment.
Strengths
This is the first cost-effectiveness analysis performed for a continuous objective measurement system in PD in the UK. The model is directly based on data obtained from the Woodrow study, the first blinded, controlled trial of objective measurement in PD, comparing care by trained clinicians with and without access to the PKGCitation13. The analyses provided are consistent with the NICE reference case and the decision problem at hand.
The magnitude of the improvements seen in the PKG + group in the Woodrow study was comparable or better than those observed in trials of other effective interventions such as drugs and deep brain stimulationCitation27. PwP were blinded as to whether they were participants in the PKG+-arm or standard clinical evaluation (PKG−), which avoids potential bias. Another important strength is the choice of the lifetime horizon, research has shown time horizon has a significant impact on results, even more, substantial than the discount rateCitation28.
The modelling approach is conservative; the benefit from using PKG for 1 year is included, whereas the cost of provision of PKG for the following years is included in the model, although any additional benefit of PKG use in subsequent years is not included. Furthermore, the base case is modelled to mitigate the benefit observed in the Woodrow study to 75%, to account for additional support provided to clinicians in the PKG + arm and the effect of participating in a clinical trial. A scenario analysis that considered 100% of the benefit in the Woodrow study results in a QALY of −£67,708.57 and an NMB of £26,398.74. In addition, the rate of progression used in waning after year 5 was calculated based on a bootstrap analysis of published UPDRS III progression data, which equates to an average rate of progression of 10.9%, which is considerably higher than that observed in the progressive study used in the scenarios (2%–7%).
Limitations
The results of any modelling exercise need to be treated with some degree of caution. While there are a large number of studies describing the PKG system and its correlation with various other measures of PD and potential contribution to clinical careCitation16,Citation29–31, the Woodrow study was deemed to be the only one with an appropriate design and sufficient controls to serve as the basis for this model. Patients and doctors were not randomised to PKG + and PKG−, but the assignment was based on clinics that did or did not have experience with the PKG. Due to this design, it was not possible to blind the doctors as to whether they were in the PKG + or PKG − groups, but the latter group was not able to review the PKG report information in their assessment of patients’ level of control.
Trial data does not necessarily represent real clinical practice, indeed, data from clinical trials may lack external validity since adherence to intervention protocols is higher in the trial setting than in the real worldCitation32. Patients were excluded from the Woodrow study if they were receiving <4 doses of levodopa/day, aged >75, had advanced dementia, orthostatic hypotension or other contra-indications to increasing PD medications. The clinicians in the PKG + group received an extra day of instruction in interpreting the PKG report and how to help patients achieve better control with medication adjustments. Furthermore, the Woodrow study was carried out in Australia, which may have different management strategies to the UK. Other limitations to the Woodrow study include a dropout rate of > 20% and a lack of information on AEs.
There is a paucity of data on the duration of treatment effect for this population, therefore a systematic review on the impact of levodopa-carbidopa intestinal gel on the duration of treatment effect has been used as a proxy. This model focuses purely on motor symptoms as captured in MDS-UPDRS III, given that the PKG device specifically captures the severity of motor fluctuations. It should also be noted that the progression of PD should also consider the onset of significant milestones with an impact on care and care costs such as falls, limitations in walking and gait, dementia which are not captured by the MDS-UPDRS III.
Some uncertainties existed due to data limitations which resulted in several assumptions being made in the model. Health state utilities were mapped from and not taken directly from clinical trial data. The benefit of using PKG is derived from a mapping algorithm of UPDRS scores which assumes that UPDRS scores recorded at entry belong to the uncontrolled population and scores recorded at exit belong to the better or less controlled population as impacted by the experimental conditions. The use of a mapping algorithm in this way is likely to create some noise in the model. At enrolment, almost one-quarter of the patients in the Woodrow study were considered “in target” on the PKG report and may therefore be deemed to be well-controlled.
Costs were estimated due to a lack of explicit cost data. However, fluctuating and uncontrolled PD is generally treated with second-line therapies for PD, which are usually more expensive than oral anti-Parkinsonian drugs, which have not been taken into consideration in the model.
The probability of patients progressing from uncontrolled to a controlled health state at the second visit phase of the model is derived from a bootstrap method which assumes that the MDS-UPDRS score follows a normal distribution. In the absence of contrary evidence and no available data to populate long-term TPs and clinical evidence to suggest that all PD patients progress with time, a constant rate of progression for PwP was assumed. As with all health economic evaluations, the longer-term impact of the results should be viewed with caution, particularly so in this case, since long-term outcomes are based on bootstrapping.
Conclusions
PD is a progressive disease and management involves monitoring and evaluation of motor and non-motor symptoms to assess disease progression and the appropriate treatment choices. Personalising management of PD is the cornerstone of modern management of PDCitation33 and such a strategy requires a granular examination of a patient’s motor and non-motor status in the home. However, this is not possible within the current pathways of clinical assessments in PD, which usually entail a 15–30 min examination in an out-patient clinic where the patient’s clinical symptoms may also be confounded by a white coat effectCitation34. Patient-completed diaries are also associated with noisy data and recall biasCitation35. With these limited insights into the patient status and disease progression, it is difficult to marshal the available therapies to optimise patient’s quality of life. PKG provides granular insight into data on motor aspects of PD along with sleep monitoring over a period of 6 days at home and allows a quantitative guide to dopaminergic drug intake and clinical motor response over the 6-day period.
PKG with clinical assessment in routine care of PwP allows for the identification of PD motor symptoms which can be used in clinical decision making. It enables clinicians to objectively assess and track symptoms over time and improve symptom scores. This Markov model favours PKG with clinical assessment as a cost-effective option for PD assessment. The results were generally consistent across a range of sensitivity analyses.
The PKG has great potential to make the NHS more effective in improving health outcomes and providing a better quality of care for PwP. It enables new models of delivering care for better outcomes such as a nurse or allied health care professional-led clinics. Furthermore, giving patients access to their own data, facilitating patient-provider communication and enhancing communication and information flow across the continuum of care can facilitate the integration of activities and contribute to the NHS Long Term Plan.
Overall, PD represents a significant cost and burden to society, this should be taken into account when considering assessments and treatments for PD patients. The data in this study will encourage the use of objective measurement of PD symptoms to aid clinical assessment and therapeutic decisions in PD.
Transparency
Declaration of funding
The study was funded by Global Kinetics Pty Ltd.
Declaration of financial/other relationships
KRC received honoraria and grants from 4 D Pharma, AbbVie, Acadia, Bial Pharma, Boeringer Ingelheim, Britannia, Cynapsus, EU Horizon 2020, GKC, Kyowa Kirin, Lobsor, Medtronic, NIHR, Novartis, Parkinson’s Foundation, Parkinson's UK, Profile Pharma, Roche, Scion, SK Pharma, Stada, Synovion, Therevance, UCB Pharma, Wellcome Trust and Zambon.
AH received honoraria and grants from Bial Pharma, GE Healthcare, Lundbeck, Parkinson’s UK, Syneos Health, Teva UK and UCB Pharma.
FO and JB are employees of JB Medical who were funded by Global Kinetics Pty Ltd to carry out this work and provide medical writing support. JB Medical is a consultancy which works with pharmaceutical and device companies to support market access.
Peer reviewers on this manuscript have no relevant financial or other relationships to disclose.
Author contributions
FO and JB were responsible for the conception and design of this work. All authors reviewed the manuscript for intellectual content and their comments were incorporated. All authors agree to be accountable for all aspects of this work.
Supplemental Material
Download MS Word (39.3 KB)Acknowledgements
We acknowledge the support of Sohaila Rahman of JB Medical Ltd, who provided medical writing expertise funded by Global Kinetics Pty Ltd.
References
- Rogers G, Davies D, Pink J, et al. Parkinson's disease: summary of updated NICE guidance. BMJ. 2017;358:j1951.
- Dorsey ER, Constantinescu R, Thompson JP, et al. Projected number of people with Parkinson disease in the most populous nations, 2005 through 2030. Neurology. 2007;68(5):774–386.
- Dorsey ER, Sherer T, Okun MS, et al. The emerging evidence of the Parkinson pandemic. J Parkinsons Dis. 2018;8(s1):S3–s8.
- Parkinson's UK. The incidence and prevalence of Parkinson's in the UK. Results from the Clinical Practice Research Datalink Summary Report; 2018.
- Weir S, Samnaliev M, Kuo TC, et al. Short- and long-term cost and utilization of health care resources in Parkinson's disease in the UK. Mov Disord. 2018;33(6):974–981.
- Jankovic J. Parkinson's disease: clinical features and diagnosis. J Neurol Neurosurg Psychiatry. 2008;79(4):368–376.
- Chaudhuri KR, Healy DG, Schapira AH. Non-motor symptoms of Parkinson's disease: diagnosis and management. Lancet Neurol. 2006;5(3):235–245.
- Schapira AHV, Chaudhuri KR, Jenner P. Non-motor features of Parkinson disease. Nat Rev Neurosci. 2017;18(7):435–450.
- Vijiaratnam N, Foltynie T. Therapeutic strategies to treat or prevent off episodes in adults with Parkinson's disease. Drugs. 2020;80(8):775–796.
- Ray Chaudhuri K, Poewe W, Brooks D. Motor and nonmotor complications of levodopa: phenomenology, risk factors, and imaging features. Mov Disord. 2018;33(6):909–919.
- Rosqvist K, Horne M, Hagell P, et al. Levodopa effect and motor function in late stage Parkinson's disease. J Parkinsons Dis. 2018;8(1):59–70.
- Chandler C, Folse H, Gal P, et al. Modeling long-term health and economic implications of new treatment strategies for Parkinson's disease: an individual patient simulation study. J Mark Access Health Policy. 2021;9(1):1922163.
- Woodrow H, Horne MK, Fernando CV, et al. A blinded, controlled trial of objective measurement in Parkinson's disease. NPJ Parkinsons Dis. 2020;6(1):35.
- Meira-Machado L, de Uña-Alvarez J, Cadarso-Suárez C, et al. Multi-state models for the analysis of time-to-event data. Stat Methods Med Res. 2009;18(2):195–222.
- National Institute for Health and Care Excellence. Parkinson’s disease in adults NICE guideline Published: 19 July 2017. Available at: www.nice.org.uk/guidance/ng71. 2017.
- Joshi R, Bronstein JM, Keener A, et al. PKG movement recording system use shows promise in routine clinical care of patients with Parkinson's disease. Front Neurol. 2019;10:1027.
- Dams J, Klotsche J, Bornschein B, et al. Mapping the EQ-5D index by UPDRS and PDQ-8 in patients with Parkinson's disease. Health Qual Life Outcomes. 2013;11:35.
- National Institute for Health and Care Excellence. Internal clinical guideline. NICE Economic analysis.- Parkinson's Disease, Appendix F:Full Health Economics Report; 2016.
- Antonini A, Odin P, Pahwa R, et al. The Long-Term impact of levodopa/carbidopa intestinal gel on 'off'-time in patients with advanced Parkinson's disease: a systematic review. Adv Ther. 2021;38(6):2854–2890.
- Holden SK, Finseth T, Sillau SH, et al. Progression of MDS-UPDRS scores over five years in de novo Parkinson disease from the Parkinson's progression markers initiative cohort. Mov Disord Clin Pract. 2018;5(1):47–53.
- Schrag A, Dodel R, Spottke A, et al. Rate of clinical progression in Parkinson's disease. A prospective study. Mov Disord. 2007;22(7):938–945.
- Office for National Statistics. National Life Tables. 2021.
- Xu J, Gong DD, Man CF, et al. Parkinson's disease and risk of mortality: meta-analysis and systematic review. Acta Neurol Scand. 2014;129(2):71–79.
- NHS England. NHS England » National tariff payment system 2021. /22. Available from: https://www.england.nhs.uk/pay-syst/national-tariff/national-tariff-payment-system/.
- Claxton K, Sculpher M, McCabe C, et al. Probabilistic sensitivity analysis for NICE technology assessment: not an optional extra. Health Econ. 2005;14(4):339–347.
- Global, regional, and national burden of Parkinson's disease, 1990-2016: a systematic analysis for the global burden of disease study 2016. Lancet Neurol. 2018;17(11):939–953.
- Shulman LM, Gruber-Baldini AL, Anderson KE, et al. The clinically important difference on the unified Parkinson's disease rating scale. Arch Neurol. 2010;67(1):64–70.
- O'Mahony T. Cost-Benefit analysis and the environment: the time horizon is of the essence. Environ Impact Assess Rev. 2021;89:106587.
- Chen L, Cai G, Weng H, et al. More sensitive identification for bradykinesia compared to tremors in Parkinson's disease based on Parkinson's KinetiGraph (PKG). Front Aging Neurosci. 2020;12:594701.
- Khodakarami H, Shokouhi N, Horne M. A method for measuring time spent in bradykinesia and dyskinesia in people with Parkinson's disease using an ambulatory monitor. J Neuroeng Rehabil. 2021;18(1):116.
- Pahwa R, Bergquist F, Horne M, et al. Objective measurement in Parkinson's disease: a descriptive analysis of Parkinson's symptom scores from a large population of patients across the world using the personal KinetiGraph®). J Clin Mov Disord. 2020;7:5.
- Kennedy-Martin T, Curtis S, Faries D, et al. A literature review on the representativeness of randomized controlled trial samples and implications for the external validity of trial results. Trials. 2015;16(1):495.
- Titova N, Chaudhuri KR. Personalized medicine in Parkinson's disease: time to be precise. Mov Disord. 2017;32(8):1147–1154.
- Bloem BR, Okun MS, Klein C. Parkinson's disease. Lancet. 2021;397(10291):2284–2303.
- Papapetropoulos SS. Patient diaries as a clinical endpoint in Parkinson's disease clinical trials. CNS Neurosci Ther. 2012;18(5):380–387.