
Abstract
Aims
Provide the first national description across the US of variations in healthcare measures in 2018 among Medicaid beneficiaries with schizophrenia.
Materials and methods
Adult beneficiaries with ≥2 diagnoses for schizophrenia, and continuous enrollment with consistent geographical data in all of 2018 were identified from Transformed Medicaid Statistical Information System (T-MSIS) Analytic Files (TAF) data for 45 of 50 states. Antipsychotic (AP) utilization rates, including long-acting injectable APs (LAIs), quality metrics, and all-cause healthcare resource utilization and costs for claims submitted to Medicaid were reported nationally and by state. Pearson correlation evaluated associations between LAI utilization and total healthcare costs at state and county levels.
Results
Across the US 688,437 patients with schizophrenia were identified. The AP utilization rate was 51% (state range: 24–77%), while the LAI utilization rate was 13% (range: 4–26%). The proportion of patients adherent to any AP was 56% (range: 19–73%). Within 30 days post-discharge from an inpatient admission, 22% (range: 8–58%) of patients had an outpatient visit, and 12% (range: 4–48%) had a readmission. The proportion of patients with ≥1 inpatient admission and ≥1 emergency room visit was 34% (range: 19–82%) and 45% (range: 20–70%). Per-patient-per-year total healthcare costs averaged $32,920 (range: $717–$93,972). At the county level, a weak negative correlation was observed between LAI utilization and total healthcare costs.
Limitations
This study included Medicaid beneficiaries enrolled with pharmacy and medical benefits, including beneficiaries dually eligible for Medicare; results cannot be generalized to the overall schizophrenia population or those with other payer coverage.
Conclusions
In 2018, half of beneficiaries with schizophrenia did not submit any claims for APs to Medicaid, nearly half had an emergency room visit, and one-third had an inpatient admission. Moreover, healthcare measures varied considerably across states. These findings may indicate unmet treatment needs for Medicaid beneficiaries with schizophrenia.
PLAIN LANGUAGE SUMMARY
Schizophrenia is a severe mental disorder that poses a large health, social, and cost burden to patients and society. While treatment with antipsychotic medications can reduce the number of relapses and hospitalizations, many patients do not adhere to treatment, which can lead to poor symptom control and further use of healthcare services. Interestingly, these measures of schizophrenia care seem to vary across US states. Therefore, we ran the first study to describe the regional differences in antipsychotic use, measures of quality of care, healthcare use, and healthcare costs among Medicaid-insured patients across the US in 2018.
Our results showed that only half of patients used antipsychotics in 2018 (with a range of 24–77% across states) and the proportion of patients adherent to antipsychotic treatment was low (range of 19–73%). Additionally, nearly half of all patients had an emergency room visit (range of 20–70%), and one-third had an inpatient admission (range of 19–82%). These findings highlight large variations in antipsychotic use, performance measures, and healthcare use, possibly due to regional differences in unmet needs in schizophrenia care for Medicaid-insured patients in the US. Since use of inpatient and emergency room services was consistently high in specific states or regions, and yearly healthcare costs per patient varied from $717–$93,972 (mean = $32,920), there may be a particularly high burden in certain areas of the country where patients with schizophrenia may potentially be experiencing multiple relapses. Further research is needed to identify policies that may help narrow these regional differences.
Background
Schizophrenia is a severe mental disorder associated with substantial health, social, and economic burden, with an estimated prevalence ranging from 0.25% to 0.64%Citation1,Citation2 and affecting approximately 1.5 million adults in the United States (US)Citation3. Notably, higher schizophrenia prevalence estimates of 2.16% to 4.01% have been reported among beneficiaries of government programs for low-income individuals (i.e. Medicaid)Citation4. Additionally, Medicaid beneficiaries with schizophrenia have been shown to incur higher healthcare resource utilization (HRU), including emergency room (ER) visits and inpatient admissions, and incremental healthcare costs of $14,087 per-patient-per-year (PPPY) compared to Medicaid beneficiaries without schizophrenia, based on 6-state Medicaid data from 2012 to 2017Citation4.
Although hospitalizations and relapse may be mitigated with the consistent use of antipsychotic (AP) medications, low adherence and persistence to therapy is commonCitation5,Citation6. As such, timely outpatient follow-up after hospital discharge is particularly important to reduce readmissions and encourage medication adherence in these patientsCitation7,Citation8. Given the importance of APs for long-term schizophrenia disease management, adherence to APs is an important quality measure collected by the Centers for Medicare and Medicaid Services (CMS) to ensure that patients receive high quality healthcareCitation9,Citation10. Indeed, nonadherence to APs can lead to poor symptom control, relapse, use of inpatient/ER services (clinical manifestations of relapse that are often used as proxiesCitation11,Citation12) and subsequently, high healthcare costs, all of which have been shown to contribute to the “unmet needs” in schizophrenia careCitation13. However, a study of Medicaid beneficiaries with schizophrenia in 6 states found that only 28–31% of patients were adherent to AP therapy during a 12-month observation periodCitation14. Additionally, a recent, preliminary, claims-based analysis using data from 2012 to 2014 for all available US states found that on average, 52.4% of Medicaid beneficiaries with schizophrenia did not have a claim for an AP over the course of the calendar yearCitation15.
Compared with oral APs (OAPs), long-acting injectable (LAI) AP therapies need to be administered less frequently, and studies have shown that they are associated with improved adherence, reduced risk of hospitalization, and decreased medical costsCitation14,Citation16–19. As such, LAIs are now recommended across schizophrenia treatment guidelines in various clinical scenarios, including among patients with history of poor or uncertain AP adherenceCitation20, after tolerability has been assessed with the oral formulation of the same APCitation21, as initial treatment with a second-generation OAP, or after failure of initial treatmentCitation22. Despite the clinical advantages associated with LAIs relative to OAPs, only an average of 11% of Medicaid beneficiaries used LAIs per year from 2012 to 2014Citation15. Notably, this utilization rate, along with AP utilization, varied between US states, suggesting regional differences in care for Medicaid beneficiaries with schizophrenia.
To this end, an updated and comprehensive evaluation of AP utilization, quality measures, HRU, and healthcare costs, as well as regional differences in these outcomes following the preliminary analysis of 2012–2014 Medicaid data is warranted to address the current knowledge gap, especially given the evolving LAI treatment landscape in recent yearsCitation23 and the particularly high schizophrenia prevalence among Medicaid beneficiaries. To the best of our knowledge, the current study provides the first national and state-level description of the variations in AP utilization rates, quality measures, HRU, and healthcare costs across the US in 2018 based on claims submitted to Medicaid for all patients with full or partial coverage. The description of these measures at the state-level provides important insight to identify and address local unmet needs in schizophrenia care.
Methods
Data source
This study used Transformed Medicaid Statistical Information System (T-MSIS) Analytic Files (TAFs) from 2018 for 45 of the 50 US states and the district of Columbia. Data was not available for Idaho, Illinois, Mississippi, Rhode Island, and Wyoming. The annual data files include enrollment and claims data for all Medicaid enrollees, including those with a managed care plan, as well as for Medicaid-expansion Children’s Health Insurance Program (CHIP) enrollees. Patients with dual eligibility (Medicaid and Medicare, such as Medicaid beneficiaries who qualify for Social Security Disability benefitsCitation24) are also included, but claims submitted to Medicare (i.e. not submitted to Medicaid) are not observed. The database provides data on medical enrollment, characteristics of patients (including state of residence, sex, and race), date of death, HRU, and healthcare cost variables (amount paid by Medicaid for services rendered).
Per Title 45 of Code of Federal Regulations, Part 46.101(b)(4), the analysis of this study is exempt from institutional review for the following reasons: (a) it is a retrospective analysis of existing data with no patient intervention or interaction, and (b) no patient identifiable information is included in the claims datasetCitation25.
Study design and patient selection
A cross-sectional ecological study design was used. Information on Medicaid enrollment and demographic variables, as well as on claims submitted to Medicaid for medical visits and prescription drugs, including corresponding Medicaid paid amounts, was extracted for analysis.
Patients were included in the study if they had ≥2 schizophrenia diagnoses (International Classification of Diseases, 10th Revision, Clinical Modification [ICD-10-CM] codes: F20.XX, F21, or F25.X as a primary or secondary diagnosis) on different dates in 2018, continuous Medicaid enrollment at a constant 3-digit Zone Improvement Plan (ZIP) code for all of 2018 and were aged 18 years as of 1 January 2018 ().
Figure 1. Identification of the study population. Abbreviation. ICD-10-CM, International Classification of Diseases, Clinical Modification, Tenth Revision. Notes: [1] ICD-10-CM codes were used to identify schizophrenia in the primary or secondary diagnosis positions [ICD-10-CM: F20.xx, F21.xx, F25.xx]. [2] Patients were required to have a single state, 3-digit ZIP code, and county of residence throughout the calendar year to ensure reliability of geographic information. Patients from Illinois were excluded from this analysis because of data quality issues.
![Figure 1. Identification of the study population. Abbreviation. ICD-10-CM, International Classification of Diseases, Clinical Modification, Tenth Revision. Notes: [1] ICD-10-CM codes were used to identify schizophrenia in the primary or secondary diagnosis positions [ICD-10-CM: F20.xx, F21.xx, F25.xx]. [2] Patients were required to have a single state, 3-digit ZIP code, and county of residence throughout the calendar year to ensure reliability of geographic information. Patients from Illinois were excluded from this analysis because of data quality issues.](/cms/asset/f9599ccc-23b6-44cb-9f53-7d63480972e2/ijme_a_2084234_f0001_b.jpg)
Outcome measures
Study outcomes were reported based on claims submitted to Medicaid for all patients with full or partial coverage, including AP use, quality metrics, HRU, and healthcare costs during 2018. AP, LAI, and OAP utilization rates, including the use of second-generation APs (SGAs) in either oral or LAI formulation, were defined as the proportion of patients with ≥1 claim for the specified medication during 2018; LAI use was based on both pharmacy and medical claims. OAP utilization rates were assessed only among patients without claims for LAIs while LAI utilization rates were assessed among all patients, irrespective of OAP use.
Quality measures were informed by CMS metrics evaluated as part of the Inpatient Psychiatric Facility Quality Reporting Program and Hospital Quality InitiativeCitation9,Citation10,Citation26,Citation27; source definitions are included in Appendix 1. Adherence to any AP was defined as the proportion of patients with proportion of days covered (PDC) equal to at least 80% in the calendar year, conditional upon receiving AP treatment. PDC was defined as the sum of non-overlapping days of supply for all AP fills combined divided by the time from the first dispensing to the end (i.e. December 31st) of 2018. Among patients with ≥1 all-cause inpatient admission in 2018, quality metrics evaluated included the proportion of patients with an all-cause outpatient follow-up visit within 30 days post-discharge, the proportion of patients with an all-cause inpatient readmission within 7 or 30 days post-discharge, and the proportion of patients with any AP dispensed within 30 days post-discharge.
All-cause HRU included utilization (i.e. proportion of patients with a visit) and the number of visits by healthcare setting (i.e. inpatient, ER, outpatient), as well as average length of stay for inpatient admissions during 2018. HRU and healthcare costs were reported PPPY from a Medicaid payer perspective. All-cause healthcare costs included medical (i.e. inpatient, ER, outpatient, long-term care, mental health institute, home care, and other services), and pharmacy components. Total healthcare costs (i.e. medical and pharmacy) as well as inpatient, ER, and outpatient costs were reported. Costs were adjusted for inflation using the medical care component of the US Consumer Price Index and were reported in 2020 US dollars.
Statistical analysis
Using patient-level data, rates of AP utilization, quality metrics, HRU, and healthcare costs at the national, state, and county level were estimated and reported using means for continuous variables and proportions for binary variables; medians and standard deviations (SDs) were additionally reported for continuous variables at the national and state levels. Pearson second coefficient of skewness was reported for all-cause HRU and all-cause healthcare costs at the national and state-level. To fulfill the CMS reporting criteria, state-level data with measured outcomes including <11 participants were censored. Study outcomes at the county-level are included in Supplemental Files.
Pearson correlations were used to describe the correlation between LAI utilization rates and total healthcare costs at the state and county-level.
Sensitivity analysis
Given AP claims for dually eligible patients may be captured by Medicare and not by Medicaid (i.e. Medicare pays first, and Medicaid may subsequently cover some drugs that are not covered by Medicare)Citation28, the analysis of AP, LAI, and OAP utilization rates was replicated in the subpopulation of patients who were not dually covered by Medicaid and Medicare (i.e. whose primary payer was Medicaid).
Results
Across all outcomes, data were not available or censored for Idaho, Illinois, Mississippi, Rhode Island, and Wyoming, because of sample selection criteria (e.g. patients did not have continuous Medicaid enrollment at a constant 3-digit ZIP code for all of 2018) and the aforementioned CMS reporting criteria. Additional censored data are indicated for each outcome below as applicable.
Patient characteristics
A total of 688,437 patients with schizophrenia met the inclusion criteria, ranging from 52 patients in Utah to 110,528 patients in California (). The mean age ± SD was 48.2 ± 15.2 years nationally, with a range of 39.5 (Utah) to 53.4 (North Dakota) years across states. The range of female patients was 33% (Utah) to 55% (Virginia), with an average of 43%. Forty-two percent of the overall population was White (range of 5% in the District of Columbia to 92% in New Hampshire), 27% was Black (range of 1% in Montana to 84% in the District of Columbia), 12% was Hispanic (range of 0% in Alabama and Georgia to 72% in Iowa), and 15% had an unknown race; additional race categorizations including Asian, American Indian, Native Hawaiian, and multiracial are included in . Across the US, 44% of patients had dual Medicaid/Medicare coverage (range of 17% in Nevada to 76% in New Hampshire) and 67% of patients had a managed care plan (range of 0% in Arkansas to 100% in Kansas, Nebraska, North Carolina, and Tennessee).
Table 1. Patient characteristics in 2018.
AP utilization
Utilization rates for APs ranged from 24% to 77% across states, with an average of 51% ()Footnotei. Twenty out of 43 states had AP utilization rates ≥50%, with Nevada (77%), Washington (66%), and Ohio (65%) having the highest and New Hampshire (24%), and Montana (28%) having the lowest AP utilization rates.
Table 2. AP use and quality measures in 2018.
At the national level, the LAI utilization rate was 13%, ranging from 4% to 26% across states (); data were additionally censored for Utah. Out of 44 states, South Carolina (26%) and Arizona (20%) had LAI utilization rates ≥20%, while Nebraska (4%), Vermont (4%), Massachusetts (7%), and Montana (7%) had the lowest LAI utilization rates.
The utilization rate for OAPs was 39% overall, ranging from 16% to 62% across states (); data were additionally censored for Nebraska. Three out of 44 states had OAP utilization rates ≥50% (Nevada, 62%; Oregon, 55%; and Washington, 51%), while 6 out of 44 states had OAP utilization rates <25% (New Hampshire, 16%; Montana, 21%; North Dakota, 23%; South Carolina, 23%; South Dakota, 23%, North Carolina, 24%).
The use of SGAs ranged from 22% to 73% across states, with an average of 46% ()Footnotei. Ten out of 43 states had SGA utilization rates ≥50%, with Nevada (73%), Washington (63%), Oregon (61%), and Ohio (60%) having the highest and New Hampshire (22%), and Montana (26%) having the lowest SGA utilization rates.
Nationally, the SGA LAI utilization rate was 9%, ranging from 2% to 15% across states (); data were additionally censored for Utah. Twenty out of 44 states had SGA LAI utilization rates ≥10%, with Arizona (15%), Alabama (13%), South Carolina (13%), and Washington (13%) having the highest and Nebraska (2%) and Vermont (3%) having the lowest SGA LAI utilization rates.
The utilization rate for SGA OAPs ranged from 15% to 59% across states, with an average of 36% (). Among 45 states, Nevada (59%), Oregon (53%), and Washington (49%) had the highest SGA OAP utilization rates, while New Hampshire (15%) and Montana (20%) had the lowest SGA OAP utilization rates.
In sensitivity analyses among patients without dual Medicaid/Medicare eligibility, utilization rates for APs ranged from 45% to 89% across states, with an average of 82% ()Footnotei. At the national level, the LAI utilization rate was 20%, ranging from 4% to 40% across states (); data were additionally censored for Utah. The utilization rate for OAPs was 63% overall, ranging from 35% to 75% across states (); data were additionally censored for Nebraska.
Table 3. AP use among patients without dual eligibility (i.e. Medicaid and Medicare) in 2018.
Quality measures
Across all quality measure outcomes, data were additionally censored for Utah due to CMS reporting criteria.
The proportion of patients adherent to any AP ranged from 19% to 73% across states, with an average of 56% (). At least 50% of patients were adherent to any AP throughout the 2018 calendar year in 38 out of 44 states, with North Dakota (73%), South Dakota (73%), West Virginia (69%), and Vermont (68%) having the highest proportion of patients adherent to APs. Nebraska (19%), District of Columbia (33%), and North Carolina (37%) had the lowest proportion of patients adherent to APs.
An average of 22% of patients had an outpatient visit within 30 days post-discharge from an inpatient admission, with a range of 8% to 58% across states (). At least 25% of patients had an outpatient visit within 30 days post-discharge in 10 of 44 states; the District of Columbia (58%) and Nevada (41%) had the highest proportion of such patients.
The proportion of patients with an inpatient readmission within 7 days post-discharge ranged from 2% to 33% across states, with an average of 8% (). The District of Columbia (33%), Virginia (17%), and Nevada (15%) had the highest proportion of patients, while Colorado (2%), North Dakota (2%), and Vermont (2%) had the lowest proportion.
Nationally, 12% of patients had a readmission within 30 days from discharge, ranging from 4% to 48% across states (). The highest proportion of patients was in the District of Columbia (48%), Nevada (23%), and Virginia (20%), while the lowest proportion was in Colorado (4%), North Dakota (4%), Alaska (6%), Oregon (6%), and Vermont (6%).
The proportion of patients with an AP dispensing within 30 days post-discharge from an inpatient admission ranged from 1% to 46% across states, with an average of 14% (). The District of Columbia (46%), Nevada (30%), and Ohio (21%) had the highest proportion of patients, while Nebraska (1%), New Hampshire (4%), Colorado (5%), North Dakota (5%), and South Dakota (5%) had the lowest proportion.
All-cause healthcare resource utilization
The proportion of patients with ≥1 inpatient admission during the 2018 calendar year ranged from 19% (Colorado and North Dakota) to 82% (District of Columbia), with an average of 34% (). Seven of 45 states had <25% of participants with ≥1 inpatient admission (Colorado, 19%; North Dakota, 19%; Maine, 20%; New Hampshire, 21%; Hawaii, 23%; Vermont, 23%; South Carolina, 24%). The number of inpatient admissions PPPY ranged from 0.3 (Colorado and North Dakota) to 3.6 (District of Columbia) across states, with an average number of inpatient admissions ± SD PPPY of 0.9 ± 2.4. Thirty-five out of 45 states had a mean number of admissions PPPY <1.0, and the average length of stay for an inpatient admission ranged from 3.9 (Virginia) to 14.7 (Vermont) days, with a national average ± SD of 9.0 ± 15.6 days.
Table 4. All-cause HRU in 2018.
The proportion of patients with ≥1 ER visit during the 2018 calendar year ranged from 20% (South Dakota) to 70% (District of Columbia), with an average of 45% (). Sixteen of 45 states had ≥50% of participants with ≥1 ER visit. The number of ER visits PPPY ranged from 0.9 (North Dakota and South Dakota) to 13.3 (South Carolina) across states, with an average number of ER visits ± SD PPPY of 2.6 ± 10.6. Twenty-seven out of 45 states had a mean number of ER visits PPPY ≥2.0.
The proportion of patients with ≥1 outpatient visit during the 2018 calendar year ranged from 63% (Utah) to 97% (Wisconsin), with an average of 86% (). The number of outpatient visits PPPY ranged from 3.9 (Utah) to 86.2 (Connecticut) across states, with an average number of outpatient visits ± SD PPPY of 24.0 ± 45.7. Twenty-one out of 45 states had a mean number of outpatient visits PPPY ≥24.0.
All-cause healthcare costs
Nationally, average total healthcare costs ± SD PPPY were $32,920 ± 46,300, with a range of $717 (Kansas) to $93,972 (District of Columbia) across states (). Average total healthcare costs were ≥$25,000 PPPY in 33 out of 45 states. Total medical costs ± SD PPPY ranged from $662 (Kansas) to $76,159 (District of Columbia) across states, with an average of $25,908 ± 38,196. Average total medical costs were ≥$25,000 PPPY in 25 out of 45 states. Total pharmacy costs PPPY ranged from $1 (Nebraska) to $19,497 (Missouri) across states, with an average ± SD of $7,012 ± 24,302. Average total pharmacy costs were ≥$5,000 PPPY in 23 out of 45 states. At the national and state levels, the total all-cause healthcare costs were asymmetrically positively skewed (national coefficient = 0.98, 42 of 45 US states had a coefficient ≥0.5). A similar distribution was observed in all-cause HRU and other healthcare cost variables ().
Table 5. All-cause healthcare costs PPPY in 2018 ($2020 USD).
Correlation between LAI utilization rates and total all-cause healthcare costs
Pearson correlation was used to describe the correlation between LAI utilization and total all-cause healthcare costs using state and county data. Overall, a weak negative correlation between LAI utilization and cost was found at the county level (r = −0.1635; p < .0001), but not at the state level (r = −0.0655; p = .6692; and ).
Figure 2. LAI utilization rates (%) and variation in total all-cause healthcare costs. Abbreviations. LAI, long-acting injectable antipsychotic; N/A, not available; PPPY, per-patient-per-year.
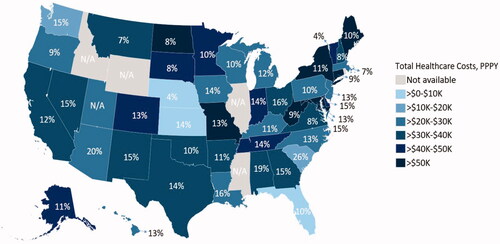
Figure 3. Plot of LAI utilization rates versus total all-cause healthcare costs PPPY, at the (A) state level and (B) county level. Abbreviations. LAI, long-acting injectable antipsychotic; PPPY, per-patient-per-year. Note: [1] The equation represents the relationship between the LAI utilization rate (denoted by x) and total healthcare costs (denoted by y). Based on Figure B, if a county had an LAI utilization rate of 0%, total healthcare costs PPPY are estimated as $37,427. For every 5 percentage point increase in LAI utilization in a given county, total healthcare costs were estimated to decrease by $1,900 PPPY.
![Figure 3. Plot of LAI utilization rates versus total all-cause healthcare costs PPPY, at the (A) state level and (B) county level. Abbreviations. LAI, long-acting injectable antipsychotic; PPPY, per-patient-per-year. Note: [1] The equation represents the relationship between the LAI utilization rate (denoted by x) and total healthcare costs (denoted by y). Based on Figure B, if a county had an LAI utilization rate of 0%, total healthcare costs PPPY are estimated as $37,427. For every 5 percentage point increase in LAI utilization in a given county, total healthcare costs were estimated to decrease by $1,900 PPPY.](/cms/asset/4e02395f-2156-43e9-849f-8e8ed392b28d/ijme_a_2084234_f0003_c.jpg)
Discussion
In this nationwide evaluation of claims submitted to Medicaid by beneficiaries with schizophrenia, overall national AP utilization rates in 2018 across the country averaged 51%, and LAI utilization rates were 13%. Rates of AP adherence and follow-up care based on quality measures were generally low, with 22% of patients having an outpatient visit within 30 days post-discharge from an inpatient admission. Overall, the majority of patients had an outpatient visit over the course of the calendar year, though nearly half of patients had an ER visit and approximately one-third had an inpatient admission, highlighting potential unmet needs of Medicaid beneficiaries with schizophrenia in the US. Notably, use of inpatient and ER services was consistently high in specific states/regions (e.g. Nevada, District of Columbia), suggesting a particularly high burden in certain areas of the country where patients with schizophrenia may not be receiving sufficient care to prevent relapse.
Up-to-date, nation-wide estimates of AP utilization rates from a Medicaid payer perspective are sparse in the literature. The current AP and LAI utilization rates from 2018 are consistent with those from the recent preliminary analysis of 2012 to 2014 Medicaid data from all available states, which reported rates of 48% and 11%, respectivelyCitation15. These low rates are of particular concern given the demonstrated clinical advantages of LAIs in preventing hospitalization or relapse and their recommendation across US schizophrenia treatment guidelinesCitation20–22,Citation29. Further research is warranted to determine if stronger recommendations for LAI use in schizophrenia treatment guidelines may lead to improved patient outcomes and reduced burden.
Further, it is important to note that in the sensitivity analysis focusing on patients with Medicaid as their primary payer, AP and LAI utilization rates were higher (82% and 20%, respectively), which may represent estimates that are closer to the real-world AP utilization of Medicaid beneficiaries with schizophrenia. Indeed, among the entire population of Medicaid beneficiaries, those with dual Medicaid and Medicare eligibility likely had a portion of AP claims covered by Medicare since Medicare is the primary payerCitation28, leading to fewer AP claims submitted to Medicaid.
This study described the correlation between LAI utilization and total healthcare costs, finding a weak negative correlation at the county level but not at the state level. This difference may be reflective of within-state variations in treatment access and costs or may indicate that regional rather than state-level policies have a greater influence on the relationship between LAI use and healthcare costs. Future work should evaluate the impact of state and regional policies on the correlation.
Consistent with the weak negative correlation found at the county level in this study, a preliminary analysis of 2012 to 2014 Medicaid dataCitation15, as well as studies comparing LAI and OAP use in real-world clinical practice, have demonstrated that LAI use was associated with lower medical costs, in addition to higher adherence and reduced HRU, compared to OAPsCitation14,Citation16–19. While mental health–related and schizophrenia-related costs have been shown to comprise 86% and 58%, respectively, of the total incremental healthcare costs associated with schizophreniaCitation4, the remaining proportion of non–mental health–related costs may explain the weak negative correlation observed in the current study at the county level between LAI utilization and costs. However, since this correlation analysis was descriptive, further study accounting for confounders is warranted to evaluate the specific factors influencing this correlation.
While the CMS routinely collects and reports on measures with the goal of providing high-quality healthcareCitation9, the current study demonstrated that the majority of patients are not receiving care that is consistent with recommendations for improved patient outcomes. For instance, only half of the patients with schizophrenia were adherent to APs in 2018. Medication adherence is emphasized by treatment guidelines as an integral part of the patient-centered treatment plan, with barriers to adherence being particularly important to address, since poor adherence is associated with increased risk of relapse, rehospitalization, and mortalityCitation20,Citation22. Outpatient follow-up post-discharge can improve medication adherence and reduce the risk of rehospitalizationCitation7,Citation30; however, this was infrequently observed in this study, with only 22% and 14% of patients having an outpatient follow-up or AP dispensing, respectively, within 30 days following discharge from an inpatient admission. Future work evaluating patient and risk factors associated with poor adherence may be of particular importance.
Together with the low prevalence of AP use, the suboptimal attainment of healthcare quality measures may partially explain the high utilization of ER and inpatient services observed, with one-third of patients having at least one inpatient admission and almost half having at least one ER visit in 2018. Importantly, the average length of stay for an inpatient admission was 9.0 days, which is aligned with Healthcare Cost and Utilization Project (HCUP) data (average 10.4 days in 2012) and is higher than the average length of stay for all other mood disorder (6.6 days) and non-mood disorder conditions (4.8 days) reportedCitation31. Furthermore, in the current study, 12% of patients who were initially hospitalized for any cause were then re-hospitalized within 30 days, suggesting that an important proportion of patients with schizophrenia are not receiving care that is improving patient outcomes in the long term. When looking at schizophrenia-related hospitalizations specifically, the HCUP reported that in 2012, an estimated 15.7% of patients with a hospital admission for schizophrenia were re-admitted for schizophrenia within 30 days, which is the highest rate reported among all other conditions in adult Medicaid patientsCitation31. In addition, in 2012 the HCUP reported that among Medicaid beneficiaries, schizophrenia was the second most common condition for ‘super-utilizers’, defined as beneficiaries with four or more hospital stays in 2012, with 28% of all hospital stays for schizophrenia attributable to super-utilizers among whom average hospital costs were 30% higherCitation32. This is consistent with the positively skewed distributions of the number of all-cause inpatient admissions and of total all-cause healthcare costs observed nationally and across states, which may suggest that a notable proportion of Medicaid beneficiaries with schizophrenia are super-utilizers, who may represent a larger proportion of the Medicaid cost burden for schizophrenia. Together with the literature, these findings highlight the unmet treatment and healthcare needs of this particularly high-risk population. Despite existing efforts by the CMS to promote alignment with best healthcare practices, there is a continued need for clinicians to work with patients to increase engagement in disease management so that outcomes may improve, and the use of medical services may be minimized.
This study contributed important insight to the schizophrenia literature and to effective management of this disease. By describing AP use, quality measures, HRU, and costs at the state-level in addition to nationally in the US, it is important to note that considerable variation was observed across all states, such as in the rates of AP utilization (4–77%) and inpatient admission (19–82%). Since each state operates its own Medicaid program, this variability may be a reflection of specific policies influencing access to healthcare at the state level, recording variances, and lack of care coordination. Additionally, the scarcity of hospitals and specialist facilities in rural areas relative to urban areasCitation33 may also influence the variation of HRU observed in the study. Indeed, availability of community-based mental health services (CCBHCs)Citation34, ability of pharmacists to administer LAIsCitation35, and adoption of Medicaid expansion vary widely by stateCitation36. Further research is warranted to determine the impact of these policies on AP utilization, quality measures, HRU, and healthcare costs among Medicaid beneficiaries with schizophrenia.
Limitations
This study is subject to some limitations. The analytic sample included Medicaid recipients enrolled with pharmacy and medical benefits; hence, the results cannot be generalized to the overall schizophrenia population or those with other payer coverage (e.g. commercial plans). Additionally, dual-enrolled patients (i.e. Medicaid and Medicare) were included in the sample population, but their total cost and AP utilization data may be incomplete since only the Medicaid portion was captured, thus underestimating the overall cost of care and rates of AP utilization. Indeed, the sensitivity analysis excluding patients with dual eligibility suggested that Medicare covers an important proportion of AP claims in dual-enrolled patients. Relatedly, in addition to care that patients may have received through Medicare, other avenues of healthcare delivery outside of Medicaid (e.g. during incarcerations, access to free trial programs), would not be captured in the study. Additionally, the LAI utilization rate may have been conservatively estimated if specific procedure codes for injections administered during an inpatient stay were not observed in the claims data, with LAI administration incorporated as part of inpatient services (e.g. room and board). While the total study sample was limited to patients with at least 2 diagnoses of schizophrenia during 2018 that were continually covered and received benefits through Medicaid during the year, the study may have inadvertently excluded prevalent schizophrenia patients.
The objective of this ecological study was to describe the variations in healthcare measures at the state and county levels among Medicaid beneficiaries, hence the current findings do not provide empirical evidence on the association between AP use and outcomes at the individual level. Furthermore, as this study was cross-sectional, AP utilization was defined as the proportion of patients using an AP in a given region during 2018, which is a weaker measure of exposure to AP than the intensity of use (e.g. time on treatment). Since the most recent year of data available for this analysis is 2018, actual utilization rates of APs could differ from the study results. Healthcare resource utilization and cost outcomes reported in this study were all-cause; therefore, they reflect the burden among patients with schizophrenia, though they are not necessarily directly attributable to the disease. Additionally, information on clinical outcomes, such as psychopathology and quality of life, were not available in the data source, and as APs were described at the class and not agent level, specific AP agent-related adverse events were not evaluated. This study presented descriptive statistics at the state and region level, and while differences in state-level policies and availability of healthcare resources may have had an impact on patient access to care, as well as cost of services, they were not evaluated. Data for certain metrics were unavailable for individual states or counties due to sample selection criteria and CMS reporting requirements. Relatedly, small sample sizes for some states may have led to high variability in the data. As with all claims-based studies, billing inaccuracies and missing data may have occurred. Lastly, the correlation coefficient measuring the relationship between LAI utilization and healthcare costs was not adjusted to control for factors which may influence the association, such as patient characteristics or intra-state correlation.
Conclusions
This cross-sectional study of 2018 Medicaid claims data showed nearly half of Medicaid beneficiaries with schizophrenia did not have a claim for any AP in 2018, and only 1 out of every 8 beneficiaries submitted a claim for any LAI. High utilization of ER and inpatient services, with a particularly long average length of stay, translated to healthcare costs of nearly $33,000 PPPY. These findings may indicate considerable disease burden and suboptimal pharmacotherapy support among Medicaid beneficiaries with schizophrenia. Across states, healthcare measures varied considerably, implying regional differences in availability or delivery of care, including access to pharmacological treatment. The correlation observed between LAI utilization and healthcare costs varied at the state and county levels, potentially indicating differences across regional or state policies; however, further research accounting for confounding factors is required.
Transparency
Declaration of funding
This study was supported by Janssen Scientific Affairs, LLC. The sponsor was involved in the study design, interpretation of results, manuscript preparation, and publication decisions.
Declaration of financial/other relationships
CP and CB are employees of Janssen Scientific Affairs, LLC and stockholders of Johnson & Johnson. DP, DG, LM, MHL, and PL are employees of Analysis Group, Inc., a consulting company that has provided paid consulting services to Janssen Scientific Affairs, LLC, which funded the development and conduct of this study and manuscript.
A reviewer on this manuscript has disclosed that they have received manuscript or speaker’s fees from Astellas, Dainippon Sumitomo Pharma, Eisai, Eli Lilly, Elsevier Japan, Janssen Pharmaceuticals, Kyowa Yakuhin, Lundbeck Japan, Meiji Seika Pharma, Mitsubishi Tanabe Pharma, MSD, Nihon Medi-Physics, Novartis, Otsuka Pharmaceutical, Shionogi, Shire, Takeda Pharmaceutical, Tsumura, Wiley Japan, and Yoshitomi Yakuhin, and research grants from Dainippon Sumitomo Pharma, Eisai, Mochida Pharmaceutical, Meiji Seika Pharma and Shionogi.
All the peer reviewers on this manuscript have received an honorarium from JME for their review work but have no other relevant financial relationships to disclose.
The Deputy Editor in Chief helped with adjudicating the final decision on this paper.
Author contributions
All authors were involved in the following aspects of the research: the conception and design of the study, or analysis and interpretation of the data; drafting of the paper and revising it critically for intellectual content; and the decision to submit the manuscript for publication. All authors agree to be accountable for all aspects of the work.
Previous presentation
Part of the material in this manuscript was presented at the Psych Congress held on 10–13 September 2020, as a virtual poster presentation.
Supplemental Material
Download MS Excel (872.6 KB)Acknowledgements
Medical writing support was provided by a professional medical writer, Christine Tam, an employee of Analysis Group, Inc. Additional support for manuscript review and interpretation of data was provided by Shannon Grabich, an employee of Xcenda (AmerisourceBergen), and Crystal Murcia, owner of Inkwell Medical Communications LLC.
Data set
The data that support the findings of this study are available in the supplementary files.
Notes
i Data related to AP and SGA utilization were not reported for Nebraska given low rates of observed OAP use, suggesting that OAP claims data may be incomplete. Data related to AP and SGA utilization were not reported in Utah given the small population of patients identified for the study. For example, the proportion of patients with LAI use was censored based on CMS reporting criteria.
References
- Wu EQ, Shi L, Birnbaum H, et al. Annual prevalence of diagnosed schizophrenia in the USA: a claims data analysis approach. Psychol Med. 2006;36(11):792–1540.
- Desai PR, Lawson KA, Barner JC, et al. Estimating the direct and indirect costs for community-dwelling patients with schizophrenia. J Pharm Health Serv Res. 2013;4(4):187–194.
- National Alliance on Mental Illness. Mental health by the number Arlington, VA2021. [cited 2021 Sep 28]. Available from: https://www.nami.org/mhstats.
- Pilon D, Patel C, Lafeuille MH, et al. Prevalence, incidence and economic burden of schizophrenia among Medicaid beneficiaries. Curr Med Res Opin. 2021;37(10):1811–1819.
- Haddad PM, Brain C, Scott J. Nonadherence with antipsychotic medication in schizophrenia: challenges and management strategies. Patient Relat Outcome Meas. 2014;5:43–62.
- Lieberman JA, Stroup TS, McEvoy JP, et al. Effectiveness of antipsychotic drugs in patients with chronic schizophrenia. N Engl J Med. 2005;353(12):1209–1223.
- Beadles CA, Ellis AR, Lichstein JC, et al. First outpatient follow-up after psychiatric hospitalization: does one size fit all? Psychiatr Serv. 2015;66(4):364–372. Apr 1
- Marcus SC, Chuang CC, Ng-Mak DS, et al. Outpatient follow-up care and risk of hospital readmission in schizophrenia and bipolar disorder. Psychiatr Serv. 2017;68(12):1239–1246. Dec 1
- Centers for Medicare and Medicaid Services. Quality measures. 2020. [cited 2021 Oct 20]. Available from: https://www.cms.gov/Medicare/Quality-Initiatives-Patient-Assessment-Instruments/QualityMeasures.
- Centers for Medicare and Medicaid Services. Core set of behavioral health measures for Medicaid and CHIP (behavioral health core set). 2021. [cited 2021 Oct 28]. Available from: https://www.medicaid.gov/medicaid/quality-of-care/downloads/2021-bh-core-set.pdf.
- Patel C, Emond B, Morrison L, et al. Risk of subsequent relapses and corresponding healthcare costs among recently-relapsed Medicaid patients with schizophrenia: a real-world retrospective cohort study. Curr Med Res Opin. 2021;37(4):665–674.
- Waters HC, Ruetsch C, Tkacz J. A claims-based algorithm to reduce relapse and cost in schizophrenia. Am J Manag Care. 2019;25(12):e373–e378.
- Pompili M, Giordano G, Luciano M, et al. Unmet needs in schizophrenia. CNS Neurol Disord Drug Targets. 2017;16(8):870–884.
- Pilon D, Tandon N, Lafeuille MH, et al. Treatment patterns, health care resource utilization, and spending in Medicaid beneficiaries initiating second-generation long-acting injectable agents versus oral atypical antipsychotics. Clin Ther. 2017;39(10):1972–1985.e2.
- Pilon D, Patel C, Zuckerman P, et al. Antipsychotic treatment utilization and healthcare spending in medicaid beneficiaries by state and region within the United States Psych Congress 2020; September 10–13, 2020. Virtual 2020.
- El Khoury AC, Pilon D, Morrison L, et al. Projecting the long-term economic impact of once-monthly paliperidone palmitate versus oral atypical antipsychotics in Medicaid patients with schizophrenia. J Manag Care Spec Pharm. 2020;26(2):176–185.
- Lin D, Thompson-Leduc P, Ghelerter I, et al. Real-world evidence of the clinical and economic impact of long-acting injectable versus oral antipsychotics among patients with schizophrenia in the United States: a systematic review and meta-analysis. CNS Drugs. 2021;35(5):469–481.
- Patel C, Emond B, Lafeuille MH, et al. Real-world analysis of switching patients with schizophrenia from oral risperidone or oral paliperidone to once-monthly paliperidone palmitate. Drugs Real World Outcomes. 2020;7(1):19–29.
- Zhdanava M, Lin D, Lafeuille MH, et al. Antipsychotic adherence, resource use, and costs before and after the initiation of once-monthly paliperidone palmitate therapy among Medicaid beneficiaries with prior schizophrenia relapse. Clin Ther. 2021;43(3):535–548.
- American Psychiatric Association. Practice guideline for the treatment of patients with schizophrenia. Washington (DC): APA; 2021. p. 1–312.
- Mental Health Clinical Advisory Group. Mental health care guide for licensed practitioners and mental health professionals. Salem (OR): Oregon Health Authority; 2019.
- Florida Medicaid Drug Therapy Management Program for Behavioral Health. 2019-2020 Florida best practice psychotherapeutic medication guidelines for adults. 2020. p. 1–78. Available from: https://floridabhcenter.org/wp-content/uploads/2021/04/2019-Psychotherapeutic-Medication-Guidelines-for-Adults-with-References_06-04-20.pdf.
- Citrome L. Long-acting injectable antipsychotics: what, when, and how. CNS Spectr. 2021;26(2):118–129.
- Center for Medicare Advocacy. Medicare coverage for people with disabilities. 2022. [cited 2022 Apr 8]. Available from: https://medicareadvocacy.org/medicare-info/medicare-coverage-for-people-with-disabilities/#is%20available.
- US Department of Health and Human Services. 45 CFR 46: pre-2018 requirements. 2021. [cited 2021 Nov 10]. Available from: https://www.hhs.gov/ohrp/regulations-and-policy/regulations/45-cfr-46/index.html#46.101.
- Centers for Medicare and Medicaid Services. Inpatient psychiatric facility quality reporting program manual. 2021. [cited 2022 Jan 6]. Available from: https://qualitynet.cms.gov/ipf/ipfqr.
- Centers for Medicare and Medicaid Services. Hospital quality initiative: measure methodology. 2021. [cited 2022 Jan 6]. Available from: https://www.cms.gov/Medicare/Quality-Initiatives-Patient-Assessment-Instruments/HospitalQualityInits/Measure-Methodology.
- Medicare.gov. Medicaid. 2022. [cited 2022 Mar 9]. Available from: https://www.medicare.gov/your-medicare-costs/get-help-paying-costs/medicaid.
- Kishimoto T, Hagi K, Kurokawa S, et al. Long-acting injectable versus oral antipsychotics for the maintenance treatment of schizophrenia: a systematic review and comparative meta-analysis of randomised, cohort, and pre-post studies. Lancet Psychiatry. 2021;8(5):387–404.
- Marcus SC, Zummo J, Pettit AR, et al. Antipsychotic adherence and rehospitalization in schizophrenia patients receiving oral versus long-acting injectable antipsychotics following hospital discharge. J Manag Care Spec Pharm. 2015;21(9):754–769.
- Agency for Healthcare Research and Quality. Hospital readmissions involving psychiatric disorders, 2012. 2015. [cited 2021 Nov 3]. Available from: https://www.hcup-us.ahrq.gov/reports/statbriefs/sb189-Hospital-Readmissions-Psychiatric-Disorders-2012.jsp.
- Agency for Healthcare Research and Quality. Characteristics of hospital stays for super-utilizers by payer, 2012. 2015. [cited 2022 May 16]. Available from: https://www.hcup-us.ahrq.gov/reports/statbriefs/sb190-Hospital-Stays-Super-Utilizers-Payer-2012.jsp.
- Douthit N, Kiv S, Dwolatzky T, et al. Exposing some important barriers to health care access in the rural USA. Public Health. 2015;129(6):611–620.
- National Council for Mental Wellbeing. CCBHC locator. 2021. [cited 2021 Aug 16]. Available from: https://www.thenationalcouncil.org/ccbhc-success-center/ccbhc-locator/.
- National Alliance of State Pharmacy Association. Pharmacist authority to administer long-acting antipsychotic. 2019. [cited 2021 Aug 11]. Available from: https://naspa.us/wp-content/uploads/2017/07/Pharmacists-Authority-to-Administer-Medications.pdf.
- Kaiser Family Foundation. Status of state Medicaid expansion decisions. 2021. [cited 2021 Aug 11]. Available from: https://www.kff.org/medicaid/issue-brief/status-of-state-medicaid-expansion-decisions-interactive-map/.