
Abstract
Aims
This study compared the psychometric properties of EQ-5D-5L and SF-6D to assess the interchangeability of both instruments in patients with a recent fracture presenting at a Fracture Liaison Service (FLS).
Materials and methods
Data from a prospective observational study in a Dutch FLS clinic were used. Over 3 years, subjects were interviewed at several time points using EQ-5D-5L and SF-36. Floor and ceiling effects were evaluated. Agreement was evaluated by intra-class correlation coefficients and visualized in Bland–Altman plots. Spearman’s rank correlation coefficients were applied to assess convergent validity. Mann–Whitney U test or Kruskal–Wallis H test as well as effect size (ES) were used to explore known-groups validity. Responsiveness was explored using standardized response mean (SRM) and ES. For each measurement property, hypotheses on direction and magnitude of effects were formulated.
Results
A total of 499 patients were included. EQ-5D-5L had a considerable ceiling effect in comparison to SF-6D (21 vs. 1.2%). Moderate agreement between the (UK and Dutch) EQ-5D-5L and SF-6D was identified with intra-class correlation coefficients of 0.625 and 0.654, respectively. Bland–Altman plots revealed proportional bias as the differences in utilities between two instruments were highly dependent on the health states. High correlation between instruments was found (UK: rho = 0.758; Dutch: rho = 0.763). EQ-5D-5L and SF-6D utilities showed high correlation with physical component score but low correlation with mental component score of SF-36. Both instruments showed moderate discrimination (ES > 0.5) for subgroup by baseline fracture type, and moderate responsiveness (SRM > 0.5) in patients that sustained a subsequent fracture.
Conclusion
Both EQ-5D-5L and SF-6D appeared to be valid utility instruments in patients with fractures attending the FLS. However, they cannot be used interchangeably given only moderate agreement was identified, and differences in utilities and ceiling effect were revealed. Comparable construct validity and responsiveness were indicated, and neither instrument was found to be clearly superior.
PLAIN LANGUAGE SUMMARY
The EQ-5D and SF-36 as generic multi-domain questionnaires are widely used to measure the health-related quality-of-life (HRQoL) in a sample of the persons who suffer from the diseases or the general population. Their responses could be converted to patients or societal Health State Utility Values (HSUVs) with the range of 0 (“death”) to 1 (“full health”). A specific application of HSUV is to calculate quality-adjusted life years as the indicator of effectiveness to evaluate whether the cost of a new intervention is justified in terms of health gains through cost-utility analysis in health economics, the evidence can be further used to inform decision-making. However, different instruments differ in construct and valuation, potentially leading to different estimates for the person’s same “health state”, and healthcare decisions could be compromised when researchers or decision-makers are not aware of potential differences in HSUV. Therefore, it is important to gain insight into the specific psychometric properties of these instruments, and to understand whether instruments are interchangeable. Our study is based on data from a Dutch Fracture Liaison Service (FLS is a program for secondary fracture prevention), compared the psychometric properties and interchangeability of two instruments (EQ-5D-5L and SF-6D) in patients with a recent fracture presenting at the FLS, and suggested both instruments are valid in utility elicitation in our target population. However, they cannot be used interchangeably given only moderate agreement and differences in utilities. Neither instrument was found to be clearly superior given comparable construct and longitudinal validity, but different instruments values in different aspects of HRQoL assessment.
Introduction
Patients with prior fractures are at high risk of a subsequent fracture in their remaining lifetime, by up to 86%Citation1. This risk is particularly elevated in the first 2 years after an initial fractureCitation2,Citation3. Bone fractures can result in acute as well as chronic health physical impairmentsCitation4. The high incidence and morbidity imposed by fractures are associated with physical, psychological, and social consequences that can further affect health-related quality-of-life (HRQoL)Citation5. Fracture Liaison Services (FLSs) as a coordinated, multi-disciplinary model of care, are advocated as the best practice for secondary fracture prevention. We recently reported significant improvements in HRQoL within 12 months following the initial fracture of patients attending FLS in the NetherlandsCitation6.
Health state utility value (HSUV) is a specific type of HRQoL assessment which reflects the strength of preference for a given health state. A specific application of HSUV is to calculate quality-adjusted life years (QALYs) by integrating the time spent in that particular health state (quantity) and its corresponding preference-based value (HSUV)Citation7,Citation8. QALYs as the indicator of effectiveness are used to evaluate whether the cost of a new treatment is justified in terms of health gains through cost-utility analysis (CUA). The evidence of economic evaluation can be further used to inform decision-makingCitation9. For societal decisions (e.g. reimbursement), it is recommended to elicit the population’s preferences/values of the health states (societal HSUV), as these are assumed to be less biased as the patients preferences, and as the general population has a democratic right to participate (indirectly) in such decisionsCitation10.
HSUVs can be estimated in a variety of ways including direct and indirect methods. The most common direct utility elicitation techniques are gambling with respect to a hypothetical treatment that may result in perfect health or death (standard gamble, SG) or trading-off part of future life for a shorter time in perfect health (time trade-off, TTO)Citation7. However, these choice task based techniques are complicated, and a face-to-face interview or an interactive online survey are necessary, which are time-consuming. A EuroQol visual analog scale (EQ-VAS), known as rating scale, is a simpler direct preference elicitation method. Patients are asked to evaluate their current health state on a graduated scale ranging from 0–100. Compared to SG and TTO, EQ-VAS are elicited in a choice-less context, and respondents are not required to make trade-offs within their utility functionCitation11, however, which is generally considered to be methodologically inferior to SG and TTO due to measurement biasesCitation7. Consequently, the indirect utility elicitation method, named multi-attribute utility instruments (MAUIs), is increasing applied to obtain HSUVs in recent years. These instruments consist of a generic multi-domain HRQoL questionnaire and corresponding utility algorithm or set of weights (tariffs) obtaining (through a scoring function) from direct utility assessment of a sample of the persons who suffer from the diseases or general populationCitation8 for converting responses to patients or societal HSUVs. These indirect instruments are widely used given the main benefit of allowing comparisons between various diseases, interventions, and health programsCitation1. The EuroQol 5-dimension (EQ-5D) is the most dominant MAUI, especially given the increasing availability of societal country-specific health utilities. The Short Form 6-dimension (SF-6D) is also widely used, which produces societal health utilities based on an algorithm using a subset of 11 questions from the 36-item Short Form Survey (SF-36)Citation12.
The use of generic indirect utilities in CUA is supported by country-specific guidelines for economic evaluations, along with the European Society for Clinical and Economic Aspects of Osteoporosis, Osteoarthritis, and Musculoskeletal Diseases, and the US branch of the International Osteoporosis Foundation ((ESCEO-IOF) guideline for conduct of economic evaluations in osteoporosisCitation13. In the field of bone fractures, the widespread implementation of the FLS (until 11th April of 2022, 721 FLSs were registered across 50 countries under Capture the Fracture Campaign initiated by International Osteoporosis Foundation) stimulated interest into the CUA of FLSCitation13. On this line, the HSUVs of patients attending the FLS have been assessed in some of these studies using different instruments. However, instruments differ in (i) descriptive content of the construct “health utility”, and (ii) valuation method to derive the scoring algorithms (TTO for the EQ-5D, and SG for the SF-6D), potentially leading to different estimates for the person’s same “health state”. This can contribute to differences in incremental cost-utility ratio (ICUR), as indicated by a previous studyCitation14. Potentially, healthcare decisions could have been compromised when researchers or decision-makers are not aware of potential differences in HSUV. Therefore, it is important to gain insight into the specific psychometric properties of these instruments, and to understand whether caution is needed in interpretation or whether instruments are interchangeable.
The psychometric properties of EQ-5D and SF-6D have been compared in multiple studies in patients with different diseases, including low back painCitation15, coronary heart diseaseCitation16, and diabetesCitation17. Different conclusions were made regarding the interchangeability of the questionnaires. To our knowledge, longitudinal data on the sensitivity of HSUVs (responsiveness/longitudinal validity) are sparse in the literature, especially in the field of fractures, and no studies included patients presenting at an FLS. The objective of our study was therefore to compare the psychometric properties (construct validity, known-group validity, and responsiveness/longitudinal validity) and interchangeability of EQ-5D-5L and SF-6D in prospective Dutch patients with a recent fracture presenting at an FLS.
Methods
Design and study population
Patients included in the analyses participated in a 3-year prospective observational study (“FX MoVies Study”) conducted between October 2014 and June 2016 at the FLS of VieCuri medical center in VenloCitation18. The study protocol was approved by an independent Medical Ethics Committee and complied with the Declaration of Helsinki (registration number NL45707.072.13). All patients gave written informed consent prior to participation. In total, 1,380 FLS attenders were screened for eligibility, of whom 990 were eligible to participate and a total of 500 relatively healthy patients aged between 50 and 90 years with a recent radiologically confirmed fracture participated eventually. Patients with a high-energy traumatic fracture, bone metastasis, failure of prosthesis, or osteomyelitis; non-Caucasian patients; and patients with cognitive problems were excluded.
After inclusion, dual X-ray absorptiometry (DXA) measurement, vertebral fracture assessment (VFA), and a blood test were scheduled for each participant. Both HRQoL questionnaires (EQ-5D-5L and SF-36) were completed by patients in paper, along with a detailed questionnaire to evaluate risk factors for fractures, at the first FLS visit following inclusion. Three and 6 months after inclusion, the HRQoL questionnaires were posted to patients. Although EQ-5D-5L and SF-36 were self-reported questionnaires, quality control was performed during data collection, i.e. a research assistant conducted an additional telephone call to verify whether patients sustained a new fall or a subsequent fracture and to provide support to complete the questionnaires if needed. Twelve, 24, and 36 months after inclusion, patients had a physical visit at a FLS clinic and were invited again to complete the paper versions of HRQoL questionnaires. Given patients’ first visit at FLS was scheduled 3-4 months after their index fracture (which was regarded as baseline), there was no availability of immediate HRQoL data after fracture.
Demographics and disease-related characteristics
The socio-demographics included age at time of fracture, gender, and body mass index (BMI). A detailed questionnaire was used to evaluate clinical risk factors for fractures and collect fracture-related characteristics including medical history, previous anti-osteoporosis medication (AOM) use, calcium and vitamin D intake, previous fractures, previous falls (last year), parental hip fracture, use of a walking aid, smoking, and visual and hearing impairment. Besides, bone mineral density (BMD) was measured by DXA, and prevalent vertebral fracture (VF) by VFA. The definition and classification of BMD and prevalent VF has been described in detail in previous studiesCitation6,Citation18. In addition, laboratory tests were performed to detect contributors to secondary osteoporosis and metabolic bone diseases. For all participants, time of mortality and suffering subsequent fractures were recorded during 3-year follow-up.
Indirect health state utility valuation
HSUVs are scored on a cardinal scale anchored at 0 (“death”) and 1 (“full health”), with some instruments also allowing for negative values representing states worse than deathCitation7,Citation19. Given the unavailability of a Dutch algorithm to translate SF-36 health status measures to SF-6D societal HSUVs, the SG-based UK (version 1) algorithm developed by Brazier et al.Citation20 was applied. The utility values range from +0.291 to +1. The SF-6D estimates a preference-based single index measure for health in terms of six dimensions (physical functioning, role limitation, social functioning, mental health, pain, and vitality), each dimensions contains four to six levels. The EQ-5D-5L comprises five dimensions (mobility, self-care, usual activities, pain/discomfort, and anxiety/depression) to quantify health status, each dimension has five levels, ranging from no problem to extreme problem. The elicitation of the EQ-5D-5L uses TTO alongside a discrete choice experiment (DCE), with value sets available for many countries. For our analyses, we used both UK and Dutch value sets for comparisonCitation21,Citation22. The EQ-5D-5L utilities theoretically range from −0.446 to +1 and −0.285 to +1 for the Netherlands and UK, respectively. Besides, the EQ-VAS was used to evaluate/mark patients’ overall health status on the day of the interview on a 20 cm vertical scale with end points of 0 (the worst health you can imagine) and 100 (the best health you can imagine). The EQ-VAS was rescaled to a 0–1 value for comparison.
Statistical analysis
Multiple imputation
Multiple imputation (MI) with fully conditional specification was employed to impute missing EQ-5D and SF-6D utilities. Patients’ missing utilities at six time-points were drawn using predictive mean matching. The details of MI can be found in our previous studyCitation6.
Patient characteristics and descriptive statistics
Baseline characteristics were reported as means and standard deviations (SD) for continuous variables, and as number (%) for categorical variables. Baseline HSUV for EQ-5D-5L (UK and Dutch), EQ-VAS, and SF-6D were skewed and reported as mean (SD), observed range, and median (IQR inter-quartile range). Floor and ceiling effects were evaluated by calculating the proportion of respondents scoring the highest (ceiling) or lowest (floor) possible score across any given domain, measuring the sensitivity and coverage of a questionnaire at each end of the scaleCitation23. For EQ-5D-5L, the proportion of patients in the worst (11,111) and best (55,555) possible health states are accounted for as floor and ceiling effects, respectively. For SF-6D, the proportions of minimal (0.29) and maximal possible HSUV score (1.00) were calculated.
Interchangeability between EQ-5D-5L and SF-6D questionnaires
Assessment of interchangeability between two questionnaires comprised of agreement, construct validity (convergent and known-group validities), and responsiveness (longitudinal validity). Hypotheses were established for each analysis, as shown in . Agreement and construct validity were investigated using baseline HSUV, and responsiveness using 3-year HSUV data.
Table 1. Hypotheses regarding the interchangeability between EQ-5D and SF-6D.
Agreement between EQ-5D-5L and SF-6D
Agreement tests the capacity to arrive at identical results for the same subjects using different instruments/measures. Given both EQ-5D-5L and SF-6D HSUVs measure the same “construct” (i.e. the societal preference for health on a scale anchored at 0 and 1), good agreement is expected. The agreement between (Dutch and UK) EQ-5D-5L and SF-6D HSUVs was evaluated using intra-class correlation coefficients (ICCs). The ICCs were calculated based on a two-way random effects model using single measures and absolute agreement, and was interpreted according to the following limits “poor” (ICC <0.50), “moderate” (0.50 < ICC <0.75), “good” (0.75 < ICC <0.90), or “excellent” (ICC >0.90)Citation24.
Additionally, the Bland–Altman plot was used to visually quantify the agreement between measures as a function of the average of the two. For all subjects, mean values and differences between two scores were plotted on the X and Y-axis, respectively. The mean of differences and “limit of agreement” (calculated as the mean difference ±1.96 SD) were indicated by three lines in the plot. Good agreement was considered when the calculated mean difference is close to zero and approximately 95% of scatter points lying inside the “limits of agreement”Citation25.
Construct validity
Construct validity tests whether both questionnaires measure the same construct. First, convergent validity refers to the degree to which two measures of constructs are correlated with what it is theoretically predicted to correlate with, which was investigated using Spearman’s rank correlation coefficients between EQ-5D-5L and SF-6D HSUVs, between both HSUVs and EQ-VAS, between both HSUVs and the Physical Component Score (PCS) and the Mental Component Score (MCS) of the SF-36, and between both HSUVs and eight domains (physical functioning PF, role physical RP, bodily pain BP, general health GH, vitality VT, social functioning SF, role emotional RE, and mental health MH) of the SF-36. Coefficients of 0.9–1.0 are considered as very highly correlated, 0.7–0.9 as highly correlated, 0.5–0.7 as moderately correlated, and 0.3–0.5 as low correlatedCitation26. Hypotheses on the magnitude of effect are presented in .
“Known-groups” validity is used to assess whether a test or questionnaire can discriminate between two or more groups known to differ on the variable of interest. It was evaluated by calculating the EQ-5D-5L and the SF-6D HSUVs for subgroups of patients: age (≤ 65 years, > 65 years), gender (male, female), BMD (normal, osteopenia, osteoporosis), baseline fracture location (femoral/vertebral/multiple fractures, other fractures), self-reported previous fracture (yes, no), prevalent VFs (yes, no), falls in the past year (yes, no), and the previous AOM use (yes, no). Mann–Whitney U-tests were implemented for dichotomous variables and Kruskal–Wallis H tests for polytomous variables. Cohen's d, a standardized effect size (ES)Citation27, was used to quantify the magnitude of differences between groups on HSUVs. ES’s were then assigned ordinal change categories using the Cohen’s criteria: negligible difference (|ES| < 0.2), small difference (0.2 ≤ |ES| < 0.5), moderate difference (0.5 ≤ |ES| < 0.8), or large difference (|ES| ≥ 0.8)Citation27. Different hypotheses were made for different subgroups ().
Responsiveness
Responsiveness refers to the ability of a HSUV measure to capture true underlying change (recovery or worsening) in the patients’ health status over timeCitation28 and is an important measurement property for longitudinal validity. During 3-year follow-up, five patients died, and the contribution of these patients to the data on responsiveness is limited. In addition, based on our previous longitudinal studyCitation6, the change of both EQ-5D-5L and SF-6D HSUV over 3 years was not statistically significant, as was not unexpected given patients were included upon 3 months after the fracture. Therefore, recovery following a fracture would not be a situation eligible to assess responsiveness. However, significant change in HSUV was identified for patients before and after subsequent fracture. We therefore chose the worsening situation and assessed the responsiveness only in this target group (i.e. patients had subsequent fracture during 3-year follow-up, n = 50). To capture the maximum impact of a subsequent fracture, the HSUV just before and immediately after the subsequent fracture was treated as pre- and post-HSUV, respectively (i.e. if one patient had a subsequent fracture at 6 months, the HSUV at 3 months was treated as pre-HSUV and the HSUV at 6 months as post-HSUV)Citation6.
The responsiveness of EQ-5D-5L and SF-6D was assessed by use of ES and the standardized response mean (SRM). ES is calculated as the ratio of the mean change of HSUV between pre- and post-subsequent fracture to the SD of the group before subsequent fracture. SRM is calculated as the ratio of the mean change in HSUV between pre- and post-subsequent fracture to the SD of the mean changeCitation29. Both ES and SRM categories are according to Cohen’s thresholdsCitation27 as defined previously. It was hypothesized that moderate-to-large responsiveness in HSUV would be captured in this target group.
All statistical analyses were conducted using SPSS (version 26.0, IBM Statistics) and Stata (version 16), and a p-value ≤0.05 was considered statistically significant.
Results
Patient characteristics
Given one patient did not complete any questionnaire, who was therefore excluded from the analysis, therefore a total of 499 patients with one or more recent fractures were included eventually. Demographics and disease-related characteristics are presented in . The average age of included patients was 64.6 ± 8.6 years, and most patients were females (71.3%). In total, 13.2% (n = 66) of patients reported baseline femoral or vertebral or multiple fractures, and most patients suffered other fractures (clavicle/scapula, humerus, radius/ulna, hand/foot, rib/sternum, pelvis, tibia/fibula/patella fracture). Approximately 11% of patients received therapy with AOM prior to FLS visit, treatment was initiated or continued in 35% of patients after attending the FLS. Besides, 22% patients were diagnosed with osteoporosis and 27% with at least one VF. The average time gap between patients’ baseline fracture and the first FLS visit was 107 days.
Table 2. Baseline characteristics of patients with a recent fracture at FLS.
Descriptive EQ-5D-5L and SF-6D statistics
As shown in , the mean EQ-5D-5L HSUV using the UK value set was higher than which was estimated using the Dutch value set, both were higher than the mean SF-6D HSUV. As presented in , compared to the distribution of SF-6D HSUV, the distribution of both UK and Dutch EQ-5D-5L HSUVs were highly left-skewed. The mean difference between the SF-6D and (UK and Dutch) EQ-5D-5L HSUV were −0.080 (SD 0.109) and −0.047 (SD 0.125), respectively. The mean EQ-VAS was lower than (Dutch and UK) EQ-5D-5L HSUV, but higher than SF-6D HSUV. The ceiling effect was low for SF-6D (1.2%), but relatively high for both EQ-5D-5L value sets (21%). The EQ-VAS measured 33 (6.6%) patients having the best imaginable health. No tool yielded a floor effect.
Figure 1. The distribution of EQ-5D-5L and SF-6D HSUVs and EQ-VAS.
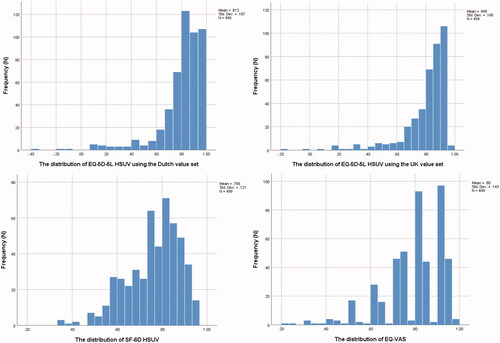
Table 3. Descriptive statistics of EQ-5D and SF-6D utility scores, n = 499.
Agreement between the EQ-5D-5L and SF-6D
As shown in , the agreement between SF-6D and (UK and Dutch) EQ-5D-5L HSUV was moderate, with ICCs of 0.625 (95% CI = 0.276–0.785) and 0.654 (95% CI = 0.546–0.733), respectively, which did not meet our hypothesis. The agreement between both EQ-5D-5L HSUV was excellent as we hypothesized, with an ICC of 0.968 (95% CI = 0.755–0.989).
The Bland–Altman plot () of the UK EQ-5D-5L value set and the SF-6D presented that 94.6% of the difference scores were between the limits of agreement (‒0.133 and 0.294). EQ-5D-5L index scores exceeded SF-6D index scores for the majority of observations in 85.4% (426 out of 499) with a mean difference of 0.080. In addition, the Bland–Altman plot () of the Dutch EQ-5D-5L value set and the SF-6D presented a mean difference of 0.047 between two instruments, but ranging over the mean average from −0.198 to 0.293, containing 94.6% of the difference scores. In total, 75.9% (379 out of 499) of the Dutch EQ-5D-5L index scores were higher than the SF-6D index scores. Both figures indicated that the agreement between EQ-5D-5L and SF-6D appeared to be relatively weak at the lower end of the scale where utility scores were outside the limits of agreement lines, the difference of HSUVs (absolute value) between two instruments was initially declining and then rising with the increase of mean HSUV. The differences between the two measurements really depended on the health status of the individual patient. EQ-5D-5L yielded a higher score for better health state (healthy patients), whereas SF-6D tended to produce higher score for poorer health state (unhealthy patients). However, for those patients with mid-range index scores, the EQ-5D-5L and SF-6D were more aligned.
Figure 2. Bland–Altman plots of difference in utility scores between (a) the SF-6D and the EQ-5D-5L using the UK value set, (b) the SF-6D and the EQ-5D-5L using the Dutch value set, and (c) the EQ-5D-5L using the UK and Dutch value sets.
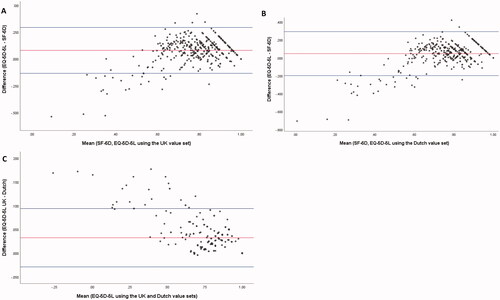
The Bland–Altman plot () of the UK and Dutch EQ-5D-5L value sets showed that 94.8% of the difference scores were between the limits of agreements (ranging from −0.029 to 0.094 over the mean average of scores). In total, 78.2% (390 out of 499) of the UK EQ-5D-5L values were higher than the Dutch EQ-5D-5L, 21.2% were equal, and 0.60% were lower. The differences between UK and Dutch EQ-5D-5L HSUV were most striking in worse health states (with lower mean utility values).
Convergent validity
The result sof convergent validity (with Spearman’s correlation coefficients) are presented in and Supplementary Table S1. For HSUVs, both UK and Dutch EQ-5D-5L HSUV were highly correlated with SF-6D HSUV (rho = 0.758, 0.763, respectively) as we hypothesized. For correlation between HSUVs and EQ-VAS, PCS/MCS, eight domains of the SF-36, 82%, 64%, and 64% hypotheses were met for SF-6D, Dutch EQ-5D-5L, and UK EQ-5D-5L, respectively. Specifically, moderate correlation was captured between (UK and Dutch) EQ-5D-5L HSUV and EQ-VAS (rho = 0.640, 0.642, respectively), and between SF-6D HSUV and EQ-VAS (rho = 0.628), which was against our hypothesis as a high correlation is expected. Both (UK and Dutch) EQ-5D-5L (rho = 0.810, 0.804, respectively) and SF-6D (rho = 0.778) HSUV were highly correlated with PCS as hypothesized, however, a low correlation was identified with MCS, especially for EQ-5D-5L utility. Moderate-to-high correlations were identified between SF-6D HSUV and all eight domains of the SF-36 as hypothesized. For UK and Dutch EQ-5D-5L HSUV, moderate-to-high correlations were captured with six domains of the SF-36 (PF, RP, BP, GH, VT, SF), low correlations were seen with emotional and mental health roles.
Known-groups validity
The mean EQ-5D-5L and SF-6D HSUVs and nonparametric statistical results across a range of different subgroups are displayed in and Supplementary Table S2. Both (UK and Dutch) EQ-5D-5L and SF-6D indicated significant difference (p < 0.05) in HSUV regarding different genders (female < male), different baseline fracture location (femoral/vertebral/multiple fractures < other fractures), falls in the last year (with < without), and previous AOM use (with < without). No statistical difference in HSUV was found in terms of different age groups, BMD, with/without previous fracture, and with/without prevalent vertebral fracture.
However, given ES is more statistically powerful and appropriate than p-value to test the known-group validity, our hypotheses were made based on ES, and the overall results showed that the same hypotheses (67%) were met by SF-6D, UK and Dutch EQ-5D-5L, suggesting both instruments are valid and with comparative validity. Specifically, our hypotheses were met for five subgroup comparisons: both (UK and Dutch) EQ-5D-5L (|ES| = 0.613, 0.607, respectively) and SF-6D (|ES| = 0.647) discriminate moderately between patients with femoral/vertebral/multiple fractures and other fractures with |ES| larger than 0.5. Besides, as we hypothesized, negligible-to-small differences were identified for patients stratified by age, gender, and BMD (with |ES| < 0.5). Finally, small differences (0.2 ≤ |ES| < 0.5) were captured between patients who initiated AOM treatment or not as we hypothesized. However, moderate differences (our hypothesis) were not identified between patients with/without previous fracture, previous falls in the last year, and prevalent VFs.
Responsiveness
The responsiveness of HSUV before and after subsequent fracture was displayed in and Supplementary Table S3. Significant decreases in both (UK and Dutch) EQ-5D-5L and SF-6D were identified with a mean change of 0.071/0.078 and 0.052, respectively. Our hypothesis was met as medium responsiveness (SRM > 0.5) was captured for patients with subsequent fracture during the 3-year follow-up.
Discussion
This study compared the psychometric properties of EQ-5D-5L and SF-6D to assess the interchangeability of these two instruments in patients with a recent fracture presenting at a FLS. We found that, although SF-6D and EQ-5D-5L utilities were highly correlated, only moderate agreement was identified between two instruments, and Bland–Altman plot revealed proportional bias as the differences in utilities between two instruments were highly dependent on the health states (mean values), moreover, EQ-5D-5L had a considerable ceiling effect in comparison to SF-6D, indicating these two instrument are not interchangeable. However, both instruments appeared to be valid utility instruments, and comparable construct and longitudinal validity were indicated (i.e. both instruments met or deviated most of our hypotheses simultaneously). Given neither instrument was found to be clearly superior, a clear recommendation cannot be made, but different instrument values in different aspects of HRQoL assessment.
One main strength of our study is the use of 3-year longitudinal data allowing us to investigate how sensitive the HSUVs are to the change in health status. To our knowledge, only one previous studyCitation30 was conducted in the field of bone fractures, and no study focused on patients presenting at an FLS. The discrepancies in HSUV were also indicated in other studies such as patients with chronic diseasesCitation31 and patients who had undergone surgery for lumbar disc herniationCitation30. Interchangeability of EQ-5D and SF-6D was also questioned in these studies. The impact of these discrepancies on the acceptability of cost-utility ratios was explored by a previous studyCitation14, indicating the incomparability of the results of CUA using different instruments reduces the credibility of the use of incremental cost–utility ratios for decision-making. Given no other studies investigated the interchangeability between EQ-5D and SF-6D in the field of bone fractures (and patients attending the FLS), we have limited evidence to confirm our findings, however, the potential reasons for identified discrepancies in the context of patients with a recent fracture presenting at a FLS are discussed below.
For utility values, both UK and Dutch EQ-5D-5L values were higher than SF-6D values in the majority of observations, which is consistent with previous studiesCitation16,Citation32,Citation33. Besides, because of the selection bias (patients with more severe fractures, older patients, or patients who were hospitalized did not attend the FLS, and approximately half of FLS attenders did not consent to participate in this study), relatively healthy patients were enrolled in our study, in line with the literature that healthier patients have significantly higher mean scores on the EQ-5D; whereas, less healthy patients have significantly higher mean scores on the SF-6DCitation30. Consequently, these might have potential implications in cost-effectiveness analysis, i.e. using EQ-5D HSUV on healthier patients would lead to higher estimated QALYs compared to using SF-6D HSUV, with a potential impact on ICUR. The relative healthy patients can also explain the considerable ceiling effect of EQ-5D-5L.
Additionally, a Bland–Altman plot revealed proportional bias as the discrepancies in utilities between instruments were highly dependent on the health status (mean values). Higher SF-6D scores at the lower end of the utility scale does not explain the relationship at the upper end of the scale, where EQ-5D-5L scores are higher. This proportional bias could already be predicted by the difference in the distribution of SF-6D and EQ-5D-5L HSUV. Moreover, as we mentioned before, different techniques are used to obtain scoring function for both instruments (SG for SF-6D and TTO for EQ-5D). Therefore the discrepancies might be attributable to the differences in the descriptive content and the variation in scoring algorithms (TTO vs. SG) as explained in some studiesCitation30,Citation32,Citation34,Citation35. Considering the ICC might be affected by scaling differences between the EQ-5D and SF-6D, ICC was recalculated after truncating the EQ-5D-5L index score at 0, results were consistent with those without truncation and conclusions remained.
Furthermore, increasingly there is attention for the discrepancies in clinimetric properties in subgroups of patients. However, the question on difference in validity of instruments by “subgroups” is complex for several reasons. Stratified analyses have been proposed, but the value is limited because other confounders might also explain the discrepancy. In other words, even when differences across subgroups are identified, it is still difficult to explain whether the differences are attributable to the error or the truth. Therefore, this issue is methodologically unresolved, and there is no agreement upon the method to uncover the source of variability in clinimetric properties. The relevant research is definitely of future interest when moving to stratified medicines. With regard to our study, the sample size was too small to perform stratified analyses, therefore we investigated the association between several variables (demographics and disease-related characteristics) and the discrepancies in HSUV, the results indicated that the discrepancies in HSUV were independent on these variables (Supplementary Table S4). As for interpretation, the results suggest the construct validity is likely similar between subgroups represented by these variables. In addition, with the availability of more data and a large sample size in the future, the discrepancies in clinimetric properties between instruments caused by demographics and disease-related characteristics might be investigated by conducting stratified analyses, however the results should be interpreted by caution.
Unsurprisingly, high agreement was identified between Dutch and UK EQ-5D-5L utilities, it can be explained that both value sets employed the EuroQoL Group’s Valuation Technology (EQ-VT) protocol and both scoring function was based on TTO and DCECitation31. However, some differences were also observed, the discrepancies in utility can be explained by the cultural differences attached to aspects of health in the UK and the Netherlands.
With regard to the convergent validity, high correlation between EQ-VAS and EQ-5D/SF-6D utility was not identified, it can be explained that respondents are required to make trade-offs within their EQ-5D/SF-6D utility function, however, this is not the case for EQ-VAS, different techniques would lead to differences in scoring. Besides, through inspection, we found that the correlation coefficient between EQ-5D and EQ-VAS is a bit higher than that between SF-6D and EQ-VAS, an explanation could be that EQ-VAS is one section of EQ-5D, and both EQ-5D and EQ-VAS use “today” as the recall period, which is 4 weeks for SF-6D, differences in scoring could therefore be causedCitation32. In addition, compared to SF-6D, EQ-5D utility was more correlated with PCS and physical health related scales of SF-36, and less correlated with MCS and mental health related scales of SF-36. This is consistent with findings from Richardson et al.Citation36 that show that the EQ-5D-5L was more sensitive to physical health than the SF-6D. It can be explained that most domains of EQ-5D (mobility, self-care, usual activities, and pain) are related to physical health, whereas SF-6D has balanced domains covering both physical and psychological health.
Some potential clinical applications were revealed, first, in a real-world clinical setting, if the researchers focus more on patients’ functional status (recovery) attending the FLS, the EQ-5D questionnaire might be more appropriate to use. The SF-36 seems more useful to evaluate the mental and emotional component of health. The EQ-5D in clinical setting might underestimate the additional effect of intervention on mental health. And the low correlation of EQ-5D HSUV with mental health scale might be relevant when evaluating non-pharmacological trials such as shared decision-making studies or lifestyle advice. Besides, researchers can select more appropriate instruments based on their targeted recall period (EQ-5D uses “today” as the recall period, which is the recent 4 weeks for SF-36).
For known-group validity, although some studies indicated that EQ-5D was more efficient than SF-6D at detecting clinically relevant differencesCitation15,Citation32, a comparable discrimination property between these two instruments was identified in our study. Unsurprisingly, both instruments can discriminate well between patients with femoral/vertebral/multiple fractures and other fractures. One explanation is that patients with relatively severe fractures (hip, vertebrae) would largely impair their physical function, incurring substantial loss in QoL at the same time. And patients with multiple clinical fractures would experience an additive effect, resulting in disability similar to a single hip or vertebral fracture as supported by a previous studyCitation37. In addition, only minor differences between patients with/without previous fracture, falls, and prevalent VFs were identified, which can be explained from two aspects: first, patients in our study attended the FLS 107 days after their index fracture on average, their previous impairments might have been recovered through natural fracture recovery and/or through treatment in the emergency department before attending the FLS, leading to already improved HRQoL; second, as we mentioned, relatively healthy patients were included in our study, difference in HSUV between subjects and their counterparts would therefore be inapparent. Negligible to small difference was hypothesized for subgroups stratified by gender, age, and BMD as these factors are not closely and directly related to physical function and patients’ HRQoL. As expected, a small difference was identified for patients with/without AOM treatment. Theoretically, largely improved QoL is expected after treatment initiation; however, the potential side-effects of AOM might affect patients’ QoL, and some rare side-effects (overstated by the press) even scare some patients away, leading to poor persistence and treatment efficacy.
For responsiveness, as our hypothesis, medium responsiveness of HSUV was observed by both instruments in the group of patients before and after subsequent fracture. However, it should be noted that only 50 patients had subsequent fracture during a 3-year follow-up. The sample size is not large, therefore the interpretation of longitudinal validity should be done with caution. In addition, as we mentioned given patients were included upon 3 months after the fracture, we only investigated whether two instruments have a different “responsiveness” to a worsening situation (i.e. following a subsequent fracture during follow-up), in the future if we could obtain patients’ HRQoL data immediately after fracture, investigating the responsiveness to recovery course would also be an option.
This study has several limitations. First, this was a single-center study from the Netherlands, so the generalizability and extrapolation of our findings should be performed with caution. Second, as we mentioned, we had selection bias (relatively healthy patients with fractures were included in our study) and lacked utility scores immediately after fracture, which limits us to accurately estimate the true HSUV for patients after fracture, to capture the difference in HSUV between subgroups, and to investigate the responsiveness in overall subjects. Third, we estimated SF-6D utility and PCS/MCS using the UK value set and physical/mental factor score coefficients given the lack of Dutch-specific norm, which might limit our estimation to reflect the true preference of the Dutch population.
Conclusion
This study compared the psychometric properties of EQ-5D-5L and SF-6D to assess the interchangeability of these two instruments. Both EQ-5D-5L and SF-6D appear to be valid utility instruments in patients with fractures attending the FLS. However, they cannot be used interchangeably given only moderate agreement was identified, and differences in utilities and ceiling effects were revealed. Comparable construct and longitudinal validity between these two instruments were indicated, and neither instrument was found to be clearly superior.
Transparency
Declaration of funding
Nannan Li is funded by the China Scholarship Council [grant number 201909110080].
Declaration of financial/other relationships
MH has received research grants through institution from Amgen, Radius Health and ViiV, consulting fees from UCB and lecture fees from Mylan Pharmaceuticals; JPB has received research funding from Amgen, and UCB; AB, SPGB, CEW, SMJK, LV, and MMO declare that they have no conflict of interest. Peer reviewers on this manuscript have no relevant financial or other relationships to disclose.
Author contributions
NL, AB, MH, and JPB made substantial contributions to the conception and design of this study. Data acquisition and correction were conducted by CEW, LV, and MMO. SMJK provided statistical support. All authors contributed to the interpretation of data, took part in reviewing the manuscript, and approve the final version of the manuscript. All authors agree to be accountable for all aspects of this work.
Supplemental Material
Download MS Word (16.8 KB)Acknowledgements
None reported.
Data availability statement
All data analyzed as part of this study are included in this published article (and its supplementary information files).
Previous presentations
The abstract for this article was presented at WCO IOF-ESCEO 2022 virtual.
References
- Kanis JA, Johnell O, De Laet C, et al. A meta-analysis of previous fracture and subsequent fracture risk. Bone. 2004;35(2):375–382.
- Johansson H, Siggeirsdóttir K, Harvey NC, et al. Imminent risk of fracture after fracture. Osteoporos Int. 2017;28(3):775–780.
- Kanis JA, Johansson H, Odén A, et al. Characteristics of recurrent fractures. Osteoporos Int. 2018;29(8):1747–1757.
- Bikbov MM, Fayzrakhmanov RR, Kazakbaeva GM, et al. Frequency and associated factors of bone fractures in Russians: the Ural Eye and Medical Study. Sci Rep. 2018;8(1):1–9.
- Adachi JD, Ioannidis G, Olszynski WP, et al. The impact of incident vertebral and non-vertebral fractures on health related quality of life in postmenopausal women. BMC Musculoskelet Disord. 2002;3(1):1–6.
- Li N, van Oostwaard M, van den Bergh JP, et al. Health-related quality of life of patients with a recent fracture attending a fracture liaison service: a 3-year follow-up study. Osteoporos Int. 2022;33(3):577–588.
- Meregaglia M, Cairns J. A systematic literature review of health state utility values in head and neck cancer. Health Qual Life Outcomes. 2017;15(1):1–13.
- Boonen A, Van Der Heijde D, Landewé R, et al. How do the EQ-5D, SF-6D and the well-being rating scale compare in patients with ankylosing spondylitis? Ann Rheum Dis. 2007;66(6):771–777.
- Svedbom A, Borgström F, Hernlund E, et al. Quality of life after hip, vertebral, and distal forearm fragility fractures measured using the EQ-5D-3L, EQ-VAS, and time-trade-off: results from the ICUROS. Qual Life Res. 2018;27(3):707–716.
- Dolan P. Ideas at issue whose preferences count? Med Decis Making. 1999;19(4):482–486.
- Dolan P, Sutton M. Mapping visual analogue scale health state valuations onto standard gamble and time trade-off values. Soc Sci Med. 1997;44(10):1519–1530.
- Ware JE. SF36 health survey: Manual and interpretation guided. Massachusetts. Nimrod Press Bost. 1993.
- Hiligsmann M, Reginster J, Tosteson ANA, et al. Recommendations for the conduct of economic evaluations in osteoporosis: outcomes of an experts’ consensus meeting organized by the european society for clinical and economic aspects of osteoporosis, osteoarthritis and musculoskeletal diseases (ESCEO). Osteoporos Int. 2019;30(1):45–57.
- Joore M, Brunenberg D, Nelemans P, et al. The impact of differences in EQ-5D and SF-6D utility scores on the acceptability of cost-utility ratios: results across five trial-based cost-utility studies. Value Health. 2010;13(2):222–229.
- Ye Z, Sun L, Wang Q. A head-to-head comparison of EQ-5D-5 L and SF-6D in Chinese patients with low back pain. Health Qual Life Outcomes. 2019;17(1):1–11.
- van Stel HF, Buskens E. Comparison of the SF-6D and the EQ-5D in patients with coronary heart disease. Health Qual Life Outcomes. 2006;4:20.
- Mulhern B, Meadows K. The construct validity and responsiveness of the EQ-5D, SF-6D and diabetes health profile-18 in type 2 diabetes. Health Qual Life Outcomes. 2014;12(1):42.
- Vranken L, Wyers CE, van Rietbergen B, et al. The association between prevalent vertebral fractures and bone quality of the distal radius and distal tibia as measured with HR-pQCT in postmenopausal women with a recent non-vertebral fracture at the fracture liaison service. Osteoporos Int. 2019;30(9):1789–1797.
- Wolowacz SE, Briggs A, Belozeroff V, et al. Estimating health-state utility for economic models in clinical studies: an ISPOR good research practices task force report. Value Health. 2016;19(6):704–719.
- Brazier J, Roberts J, Deverill M. The estimation of a preference-based measure of health from the SF-36. J Health Econ. 2002;21(2):271–292.
- Versteegh M, M. Vermeulen K, M. A. A. Evers S, et al. Dutch tariff for the five-level version of EQ-5D. Value Health. 2016;19(4):343–352.
- Devlin NJ, Shah KK, Feng Y, et al. Valuing health-related quality of life: an EQ-5D-5L value set for England. Health Econ. 2018;27(1):7–22.
- Terwee CB, Bot SDM, de Boer MR, et al. Quality criteria were proposed for measurement properties of health status questionnaires. J Clin Epidemiol. 2007;60(1):34–42.
- Koo TK, Li MY. A guideline of selecting and reporting intraclass correlation coefficients for reliability research. J Chiropr Med. 2016;15(2):155–163.
- Lakota EA, Landersdorfer CB, Nation RL, et al. Personalizing polymyxin B dosing using an adaptive feedback control algorithm. Antimicrob Agents Chemother. 2018;62(7):307–310.
- de Vet HCW, Terwee CB, Mokkink LB. Measurement in medicine: a practical guide [M]. London: Cambridge University press; 2011.
- Cohen J. A power primer. Psychological Bulletin. 1992;112(1):155–159.
- Terwee CB, Dekker FW, Wiersinga WM, et al. On assessing responsiveness of health-related quality of life instruments: guidelines for instrument evaluation. Qual Life Res. 2003;12(4):349–362.
- Norman GR, Wyrwich KW, Patrick DL. The mathematical relationship among different forms of responsiveness coefficients. Qual Life Res. 2007;16(5):815–822.
- Selva-Sevilla C, Ferrara P, Gerónimo-Pardo M. Interchangeability of the EQ-5D and the SF-6D, and comparison of their psychometric properties in a spinal postoperative Spanish population. Eur J Health Econ. 2020;21(4):649–662.
- Sakthong P, Munpan W. A head-to-Head comparison of UK SF-6D and Thai and UK EQ-5D-5L value sets in Thai patients with chronic diseases. Appl Health Econ Health Policy. 2017;15(5):669–679.
- Sayah FA, Qiu W, Xie F, et al. Comparative performance of the EQ-5D-5L and SF-6D index scores in adults with type 2 diabetes. Qual Life Res. 2017;26(8):2057–2066.
- Wu J, Han Y, Zhao FL, et al. Validation and comparison of EuroQoL-5 dimension (EQ-5D) and short form-6 dimension (SF-6D) among stable angina patients. Health Qual Life Outcomes. 2014;12(1):1–11.
- Brazier J, Deverill M, Green C, et al. A review of the use of health status measures in economic evaluation. Health Technol Assess. 1999;4(3):174–184.
- Brazier J, Roberts J, Tsuchiya A, et al. A comparison of the EQ-5D and SF-6D across seven patient groups. Health Econ. 2004;13(9):873–884.
- Richardson J, Khan MA, Iezzi A, et al. Comparing and explaining differences in the magnitude, content, and sensitivity of utilities predicted by the EQ-5D, SF-6D, HUI 3, 15D, QWB, and AQoL-8D multiattribute utility instruments. Med Decis Making. 2015;35(3):276–291.
- Adachi JD, Adami S, Gehlbach S, GLOW Investigators, et al. Impact of prevalent fractures on quality of life: baseline results from the global longitudinal study of osteoporosis in women. Mayo Clin Proc. 2010;85(9):806–813.