
Abstract
Background and aims
Acute myeloid leukemia (AML) prognosis is poor, with sustained remission occurring in <35% of young adults and <15% of older adults. This descriptive study examined the potential benefit of prolonged remission on the economic burden of AML.
Methods
Using the IBM MarketScan Commercial and Medicare Supplemental databases, we identified newly diagnosed patients with AML without hematopoietic stem cell transplantation from January 1, 2012 to December 31, 2018; AML diagnosis was the index date. Patients had 6 months of pre-index eligibility and were followed until the end of continuous eligibility, study data, or death. Active treatment and supportive care cohorts were defined; duration-of-remission subgroups (0 to <3, 3 to <6, 6 to <12, and ≥12 months) were established among active treatment patients with remission. Healthcare service utilization and costs were reported over follow-up and mutually exclusive treatment, remission, and post-relapse periods.
Results
This study included 1,558 active treatment and 1,127 supportive care patients who were followed for a median of 232 and 62 days, respectively. Over follow-up, active treatment and supportive care patients incurred mean ± standard deviation all-cause healthcare costs of $55,723 ± $61,994 and $68,596 ± $100,375 per-patient-per-month (PPPM), respectively. Decreasing PPPM costs were observed with increased remission duration (0 to <3 months: $71,823 ± $62,635; 3 to <6 months: $54,262 ± $44,734; 6 to <12 months: $35,287 ± $23,699; and ≥12 months: $15,615 ± $10,560). Although median follow-up varied by up to 5-fold, total costs were largely similar across duration-of-remission subgroups (0 to <3 months: $438,569 ± $332,675; 3 to <6 months: $590,411 ± $598,245; 6 to <12 months: $482,902 ± $369,115; and ≥12 months: $448,867 ± $316,133).
Conclusions
The economic burden of AML is substantial, even among untreated patients. Further, among patients with remission, longer durations in remission are associated with reduced PPPM healthcare costs, suggesting that remission-prolonging treatments could help mitigate healthcare costs.
Introduction
Acute myeloid leukemia (AML) is the most common acute leukemia in adults with an incidence of three-to-five cases per 100,000 persons; mean age at diagnosis is 68 yearsCitation1,Citation2. AML is characterized by expansion of undifferentiated myeloid cells in the bone marrow, typically the result of de novo mutations, which can lead to altered hematopoiesis and bone marrow failureCitation1,Citation3. Treatment is based on malignancy- and patient-specific factors, and aims to achieve morphological complete remission (CR), defined as <5% blast cells in the bone marrow, with resolution of peripheral blood cytopenias and transfusion dependenceCitation1,Citation3–5. High-dose chemotherapy is a common initial approach to treatment; however, low-intensity regimens, sometimes in conjunction with novel targeted therapies like BCL-2 or hedgehog inhibitors, or supportive care without active treatment, are used in cases where high-intensity chemotherapy is contraindicated. Targeted therapies may also be used depending on malignancy mutational profilesCitation1,Citation5. For patients who enter CR, consolidation therapy – with subsequent hematopoietic stem cell transplant (HSCT) when indicated – is recommended to deepen and prolong the remission. However, HSCT is contraindicated for many patients with AML because of comorbidities or reduced fitness level, making relapse inevitable for most older patientsCitation1,Citation5. As a result, long-term prognosis is poor, and relapse is common. Up to 80% of young adults and 60% of older adults enter remission; however, sustained remission is only seen in 35% and 15%, respectively. The 5-year survival rate is <30%Citation6–8. As persistence of leukemic stem cells (LSCs) has been implicated in relapse, incorporation of maintenance therapies following initial treatment may be one way to limit LSC outgrowth and extend remissionCitation4,Citation7.
At the time of this study, there were no approved AML maintenance therapies; thus, the potential benefits of maintenance therapies, both from a clinical and economic perspective, have not been established in a real-world setting. Prior studies have demonstrated a high economic burden of AML, with estimated costs for treated patients surpassing $300,000 annually, and relapse-related costs estimated at over $400,000 per patientCitation8–11. However, the economic burden associated with different AML remission trajectories remains unclear, especially in the emerging era of maintenance therapies which can carry notable costs. The goal of this descriptive, retrospective analysis was to examine the potential economic benefit of prolonged remission in AML in order to quantify the potential economic impact of maintenance therapy. Toward this, four cohorts of patients diagnosed with AML receiving frontline treatment and with evidence of remission for 0 to <3, 3 to <6, 6 to <12, and ≥12 months were identified in the MarketScan Commercial and Medicare Supplemental databases and all-cause and AML-related healthcare costs were calculated. Patients with HSCT were excluded from the analyses as these patients would likely not be candidates for maintenance therapy post-transplant. Finally, a cohort of patients who only received supportive care was also defined to serve as a benchmark for the economic burden of AML without treatment, as many patients with AML eventually receive supportive care only.
Methods
Data source
This study utilized data from the IBM MarketScan Commercial and Medicare Supplemental databases from 1 July 2011 to 31 December 2018. These databases contain de-identified administrative claims data for inpatient, outpatient, and outpatient prescription drug utilization of employees and their dependents or individuals with medical supplemental insurance; both Medicare and supplemental insurance paid portions of claims are represented for individuals with Medicare supplemental insurance. Study data were obtained using International Classification of Diseases, 9th and 10th Revision, Clinical Modification (ICD-9-CM and ICD-10-CM) codes, Current Procedural Terminology (CPT) 4th edition codes, Healthcare Common Procedure Coding System codes (HCPCS), and National Drug Codes (NDCs). This study was exempt from Institutional Review Board approval (anonymous administrative database study not requiring review).
Patient selection and cohorts
Adults with ≥1 primary inpatient or ≥2 non-diagnostic outpatient claims (on different days) within 90 days, with a diagnosis of AML (ICD-9-CM: C205.00; ICD-10-CM: C92.00, C92.60, C92.A0) on or after 1 January 2012 were selected; the first AML claim was the index date. Patients had ≥6 months’ continuous eligibility prior to index (pre-index period). To ensure patients were newly diagnosed, individuals with evidence of non-diagnostic cancer claims or AML therapies in the pre-index period were excluded. Patients were followed from index until the first of either: the end of continuous eligibility, study data, or death via proxyCitation12. Patients with HSCT or acute promyelocytic leukemia (APL) defined as an APL diagnosis (ICD-10-CM: C92.4x) or treatment with all-trans retinoic acid or arsenic trioxide were excluded.
Patients with ≥1 inpatient claim with a diagnosis-related group (DRG) code for chemotherapy (DRG: 837–839 and 846–848) or of ≥1 outpatient claim for an AML therapy (daunorubicin, doxorubicin, idarubicin, cytarabine, fludarabine, midostaurin, mitoxantrone, venetoclax, azacitidine, decitabine, glasdegib, gemtuzumab ozogamicin, ivosidenib, CPX-351, enasidenib, sorafenib, or giltertinib) on or after index were classified as active treatment patients. Individuals with no AML treatments but ≥1 claim for a red blood cell (RBC) transfusion or hydroxyurea were classified as supportive care patients. Within the active treatment cohort, patients with evidence of remission, defined as ≥1 claim for AML in remission following treatment (see Supplemental materials), were grouped based on the remission duration: 0 to <3 months, 3 to <6 months, 6 to <12 months, and ≥12 months.
Treatment, remission, and relapse periods
Mutually exclusive treatment, remission, and relapse periods were defined for the duration-of-remission subgroups. The treatment period included the first AML therapy to the first diagnosis code for AML in remission or the end of continuous treatment. The remission period was the first diagnosis code for AML in remission until the end of follow-up or the first relapse event. The post-relapse period was the first relapse event (diagnosis code for AML in relapse or treatment-based proxy) until the end of follow-up for patients with relapse. See Supplementary materials for further information.
Study outcomes and analyses
Demographics were measured at index; clinical characteristics were measured over the 6-month pre-index period. Rates of relapse were calculated among the duration-of-remission subgroups over the post-relapse period. All-cause and AML-related healthcare service utilization and costs were reported for the active treatment and supportive care cohorts over the full follow-up and for the treatment, remission, and post-relapse periods for the duration-of-remission subgroups.
Healthcare service categories included inpatient admissions, outpatient care (emergency room [ER] visits, outpatient office visits, outpatient hospital services, and other outpatient services), and outpatient pharmacy services. AML-related services and costs were defined as inpatient admissions with a diagnosis of AML in the primary position on the claim line, outpatient encounters with a diagnosis of AML on the claim, and claims for AML medications. Healthcare costs were calculated using paid amounts on adjudicated claims. Cost for services provided under capitated arrangements were estimated using payment proxy. All costs were inflated to 2018 US dollars using the medical component of the Consumer Price Index. To account for variable follow-up, per-patient-per-month (PPPM) service utilization and costs were calculated. For patients with <30 days of follow-up, total costs or counts during that period contributed to the mean. All data analyses were conducted using WPS version 4.1 (World Programming, Romsey, UK).
Results
Study population
Active treatment and supportive care cohorts
A total of 2,685 patients met study eligibility criteria; 42.0% were classified as receiving supportive care, with the remaining 58.0% receiving active treatment (). Supportive care patients were older than active treatment patients, with 64.5% and 40.6% of the cohorts aged ≥65 years at index, respectively (). Baseline mean ± standard deviation National Cancer Institute Comorbidity Index (NCI-CI) scores were higher in supportive care compared to active treatment patients (1.0 ± 1.4 vs. 0.8 ± 1.2, respectively), as were rates of myelodysplastic syndrome (MDS) diagnosis (18.8% vs. 13.8%, respectively). A smaller proportion of active treatment patients than supportive care patients died during follow-up ().
Figure 1. Sample attrition. Eligibility criteria along with stepwise sample attrition for the study is shown. Abbreviations. AML, acute myeloid leukemia; APL, acute promyelocytic leukemia; ATO, arsenic trioxide; ATRA, all-trans retinoic acid; HSCT, hematopoietic stem cell transplantation.
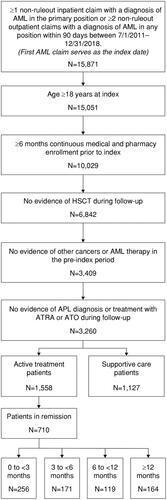
Table 1. Patient demographics.
Duration-of-remission subgroups
A total of 710 (45.6%) active treatment patients had evidence of a code for AML in remission and qualified for the duration-of-remission subgroups. The 0 to <3-, 3 to <6-, 6 to <12-, and ≥12-month remission subgroups were composed of 256 (36.1%), 171 (24.1%), 119 (16.8%), and 164 (23.1%) patients, respectively (). Patients in the ≥12-month subgroup were younger than those in the other three subgroups () and had a lower mean ± standard deviation baseline NCI-CI score (0.4 ± 0.6) compared with the 0 to <3- (0.7 ± 1.1), 3 to <6- (0.6 ± 0.9), and 6 to <12 (0.6 ± 1.0)-month subgroups. The rate of baseline MDS diagnosis was 9.8% in the 0 to <3-month, 6.4% in the 3 to <6-month, 10.9% in the 6 to <12-month, and 5.5% in the ≥12-month subgroups. The ≥12-month subgroup also had the lowest proportion of patients who died during follow-up ().
Treatment, relapse, and remission periods
Among active treatment patients, median time from index to start of AML therapy was 30 days; median duration of treatment was 34 days. The time to first AML treatment and the duration of AML treatment were similar across the duration-of-remission subgroups and ranged from a median of 39–43 and 28–30 days, respectively. Over follow-up, a total of 267 patients in the duration-of-remission-based subgroups had evidence of relapse; the rate of relapse per 100 patient-years was 130.8 in the 0 to <3-month, 97.7 in the 3 to <6-month, 43.2 in the 6 to <12-month, and 4.4 in the ≥12-month subgroups.
Healthcare service utilization and costs
Active treatment and supportive care cohorts
Utilization of inpatient services was high during follow-up, with 95.4% of active treatment and 90.9% of supportive care patients with ≥1 admission (). Utilization of emergency services was also common with 55.6% of active treatment and 42.9% of supportive care patients with ≥1 ER visit. The majority of patients in both cohorts utilized outpatient hospital services, office visits, other outpatient services, and outpatient pharmacy services during follow-up ().
Table 2. All-cause PPPM healthcare service utilization and costs over the follow-up period.
All-cause PPPM total healthcare costs over follow-up were higher for supportive care ($68,596 ± $100,375) compared with active treatment patients ($55,723 ± $61,944; ). However, active treatment patients had a longer follow-up, resulting in lower total all-cause costs in the supportive care cohort ($196,811 ± $312,345 for supportive care vs. $375,577 ± $372,919 for active treatment). Inpatient services accounted for close to 70% of total all-cause healthcare costs in both cohorts. Trends for AML-related healthcare service utilization and costs and all-cause healthcare service use and costs were similar (Supplementary Table S1).
Duration-of-remission subgroups
Healthcare service utilization and costs were reported over follow-up and each of the mutually exclusive treatment, remission, and post-relapse periods for the duration-of-remission subgroups to provide insight into the economic impact of various stages of AML.
Full follow-up
Over follow-up, nearly all patients had ≥1 inpatient admission, office visit, outpatient hospital, other outpatient service, and outpatient pharmacy fill; >55% of each subgroup had evidence of ≥1 ER visit (). In general, with increasing duration of remission, there was a trend toward fewer monthly services across all sites of care ().
There was also an inverse relationship between duration of remission and all-cause PPPM healthcare costs over follow-up (). Total all-cause costs in the four duration-of-remission subgroups were largely similar over the study period, even though the median follow-up for the ≥12-month subgroup was 5-times that of the 0 to <3-month subgroup (). Inpatient costs accounted for the majority (66.4–75.4%) of total all-cause healthcare costs. AML-related costs followed trends in all-cause costs (Supplementary Figure S1 and Table S2).
Figure 2. All-cause PPPM healthcare costs by duration of remission. All-cause PPPM healthcare costs are reported for the duration-of-remission subgroups over the full follow-up period and the mutually exclusive treatment, remission, and post-relapse periods. Costs are derived from paid amounts on administrative claims and adjusted to 2018 US dollars using the medical component of the Consumer Price Index. Sample size for the full follow-up, treatment, and remission periods: 0–<3 months, n = 256; 3–<6 months, n = 171; 6–<12 months, n = 119; and ≥12 months, n = 164. Sample size for the post-relapse period: 0–<3 months, n = 110; 3–<6 months, n = 90; 6–<12 months, n = 48; and ≥12 months, n = 19. Abbreviation. PPPM, per-patient-per-month.
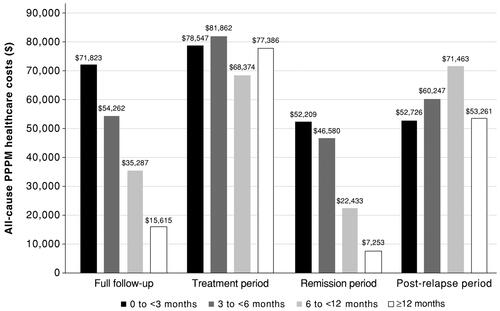
Table 3. Total all-cause healthcare costs for duration-of-remission subgroups by period.
Treatment period
During the treatment period (frontline therapy), service utilization was largely similar across the four duration-of-remission subgroups. Approximately 80% of patients in all subgroups had ≥1 hospitalization; ER and office visits were observed for <15% and 40–50% of patients, respectively. Utilization of outpatient hospital, other outpatient, and outpatient pharmacy services was high, with over 65% of patients in each subgroup with ≥1 service during the treatment period.
All-cause PPPM healthcare costs ranged from $81,862 ± $78,485 in the 3 to <6-month subgroup to $68,374 ± $65,444 in the 6 to <12-month subgroup (). Due to the similar duration of frontline therapy, total all-cause healthcare costs over the treatment period were comparable between subgroups (). Again, AML-related costs followed the trends observed for all-cause costs (Supplementary Figure S1 and Table S2).
Remission period
There was a positive association between increased duration of remission and the proportion of patients with ≥1 service across all sites of care. In contrast, the number of PPPM services decreased from the 0 to <3-month subgroup to the ≥12-month subgroup.
All-cause healthcare cost trends over the remission period were similar to those observed over the full follow-up period, with an inverse relationship between PPPM costs and duration of remission (). Furthermore, the 3 to <6-month subgroup incurred the greatest total expenses, despite the median remission duration for the ≥12-month subgroup being 6-times longer (). The inverse relationship between duration of remission and all-cause PPPM healthcare costs was also observed for AML-related healthcare costs (Supplementary Figure S1 and Table S2).
Post-relapse period
Post-relapse healthcare service utilization and costs were assessed among the 267 patients who relapsed. The proportions of patients with ≥1 encounter and the number of PPPM services were similar across subgroups for all sites of care.
Post-relapse costs were high, with all subgroups evidencing all-cause PPPM healthcare costs >$50,000; there were no clear trends in PPPM costs across subgroups (). Total all-cause costs over the post-relapse period reflected the median duration of post-relapse follow-up (). AML-related costs in the post-relapse period were high and variable across subgroups (Supplementary Figure S1 and Table S2).
Discussion
This descriptive, retrospective analysis identified a substantial economic burden of AML in newly diagnosed patients not receiving HSCT, both for patients receiving active treatment and supportive care. Mean PPPM costs for supportive care patients were estimated at $68,596 versus mean PPPM costs of $55,723 for active treatment patients, highlighting the sizeable economic burden of managing AML even in the absence of active therapy. An inverse relationship between duration of remission and PPPM costs was observed among active treatment patients with evidence of remission. Patients in remission for ≥12 months had PPPM costs that were 4.6-fold lower than costs for patients in remission for <3 months; further, total costs over follow-up were similar between remission subgroups despite the considerably longer duration of follow-up for the ≥12-month subgroup. These findings highlight the limited incremental costs incurred during periods of remission and suggest a potential economic benefit of remission-prolonging therapies in AML.
Of the 2,685 patients who met study eligibility criteria, 42.0% received supportive care and 58.0% received active treatment. This rate of treatment is in line with prior publications reporting treatment in 30–68% of patients with AML in the USCitation10,Citation11,Citation13–15. Our analysis trends toward the higher end of this range, as many other analyses focused on older populations who have historically been less likely to receive treatmentCitation11. Despite the lack of AML therapy, this study found that PPPM costs in the supportive care cohort were on par with those incurred by the active treatment cohort. Inpatient admissions were a major cost driver, and the increased contribution of inpatient services in the supportive care cohort was likely responsible for the higher PPPM costs.
Supportive care costs in this study ($68,596 PPPM) are higher than previously reported costs for untreated AML patients. Zeidan et al.Citation9 estimated supportive care costs of $14,014 in the 6 months following AML diagnosis, while Hagiwara et al.Citation14 calculated costs for untreated AML patients at $4,854 per month. Differences between analyses likely derive from differing methodologies and data sources. In our analysis, supportive care was defined as the lack of AML therapy, but with evidence of hydroxyurea or RBC transfusions. The requirement for these services would be expected to increase costs compared to a complete lack of treatment. Additionally, use of a claims-based death proxy in our analysis revealed that half of the supportive care patients died during follow-up. Thus, costs for a large proportion of this population likely include end-of-life costs, which have been shown to be notable and driven by inpatient servicesCitation16–18.
Our definition of the duration-of-remission subgroups provides some context for varying trajectories of disease within AML, with follow-up ranging from an average of 292 days in the 0–<3-month subgroup to ∼2.8 years in the ≥12-month subgroup. It is of note that the majority of patients (60.1%) were in remission for <6 months, highlighting a notable unmet need within this population. Within the duration-of-remission subgroups, longer durations of remission were associated with reduced PPPM healthcare costs over follow-up. All-cause PPPM costs decreased approximately 25% from one subgroup to the next, with patients in the ≥12-month subgroup exhibiting PPPM costs that were 4.6-fold lower than the 0–<3-month subgroup. Analysis of total costs over the study period provided a different perspective, allowing the varying durations of follow-up to be reflected in the costs. Despite the ≥12-month subgroup having a median follow-up that was 5-times that of the 0–<3-month subgroup, the differential in total costs between the two subgroups over follow-up was <$10,300, indicating that the incremental costs incurred over prolonged periods of follow-up can be nominal if patients can achieve and maintain remission.
The remission period was the primary driver of the cost savings across the duration-of-remission subgroups, as it was the only period that showed similar cost trends as the full follow-up. The greatest decrease in PPPM costs was observed once patients had been in remission for ≥6 months. This drop probably reflects costs associated with consolidation therapy, as patients who were in remission for <6 months would likely have been receiving treatment for a greater portion of their remission period compared to patients who had ≥6 months of remission. Conversely, all-cause PPPM healthcare costs were largely similar across subgroups in the treatment and post-relapse periods, consistent with previously reported high costs of AML therapyCitation8,Citation14,Citation19,Citation20.
Variability in study design, which has historically led to challenges in comparing the cost of AML treatment across publications, persists here. Hagiwara et al.Citation14 reported mean PPPM costs of $21,055 in AML patients receiving treatment. Although this is lower than our estimate ($55,723 PPPM), Hagiwara excluded Medicare patients; as a result, their population was younger and had a longer follow-up than our sample, factors that could both be associated with a healthier population and a lower PPPM cost. Similarly, Preussler et al.Citation21 identified 1-year costs of $296,529 among AML patients aged 50–64 years. Irish et al.Citation20 and Stein et al.Citation22 reported initial treatment costs of $208,857 and $145,189, respectively. The treatment periods in these studies would be most similar to the treatment period in our study, where patients incurred costs of $116,407. Finally, Pandya et al.Citation19 examined treatment episode costs and highlighted the staggering variability of costs based on regimen, which ranged from $53,081 per low-intensity episode to $439,104 per relapsed/refractory disease episode. Differences in costs across studies are likely also due to differences in disease trajectory and patient follow-up across populations. The importance of these patient-related factors is highlighted in our analysis with our observations in active treatment versus supportive care patients, as well as the duration-of-remission subgroups.
Limitations
First, analyses were limited to patients with commercial or Medicare supplemental policies and may not be generalizable to patients with other forms of insurance or the uninsured. Second, as administrative claims are collected for billing and not research purposes, there is the possibility of misclassification from coding limitations or entry error as well as limitations to clinical detail (e.g. lack of cytogenetic data). Specifically, this study used fifth-digit specifiers to identify remission and relapse. As a result, remission rates reported here are likely an underestimate, as not all clinicians switch to the use of the codes for AML in remission. Similarly, the first code for AML in remission may not reflect the first day of remission. Relapse rates may also be an underestimate, although a treatment-based proxy was used to help identify uncoded relapses; a similar proxy could not be defined for remission due to the lack of clinical data in administrative claims. Third, data on specific treatments administered in the inpatient setting was not available; thus, lines of therapy were not able to be assessed as specific AML regimens could not be followed across sites of care. Finally, AML treatment options have changed since 2017, with the approval of several novel targeted therapies, some of which are now being used in frontline treatment settings. The availability of new treatments may change costs markedly, so future analyses should examine the impact of drug costs with novel AML regimens as treatment patterns shift with time.
Conclusions
This analysis provides a current assessment of the economic burden of AML in newly diagnosed patients not receiving HSCT, and confirms the high costs associated with AML, even among those receiving supportive care. Further, this study provides new insights into the impact of disease trajectory, specifically the duration of remission, on the overall economic burden of disease. Findings here demonstrate a potential for cost saving with increased durations of remission in AML. Patients in remission for prolonged periods (e.g. ≥6 months) exhibited PPPM costs that were lower than patients with shorter durations of remission, or even patients receiving supportive care. Additionally, patients in the ≥12-month remission subgroup who had an average of 33 months of follow-up exhibited total costs that were similar to patients in the 0–<3-month remission subgroup who only had an average of 10 months of follow-up; this suggests that there could be a substantial cost offset associated with remission-prolonging treatments even when the longer duration of overall patient care is considered.
Transparency
Declaration of funding
This study was sponsored by Bristol Myers Squibb, Princeton, NJ.
Declaration of financial or other relationships
AT, DH, and KH are employees of Bristol Myers Squibb (BMS). BLB and KJ-P are employees of IBM Watson Health, which received funding from BMS for this study. RC reports employment and equity from BMS. TWL reports consultancy fees from AbbVie, Agios, Amgen, Astellas Pharma, AstraZeneca, BlueNote, BMS/Celgene, CareVive, Daiichi-Sankyo, FlatIron, GSK, Helsinn, Heron, Otsuka, Pfizer, Seattle Genetics, and Welvie; payment or honoraria for lectures and speakers’ bureaus from AbbVie, Agios, and BMS/Celgene; and grant/research funding from the American Cancer Society, BMS, CareVive, Duke University, Jazz Pharmaceuticals, the National Institute of Nursing Research/National Institutes of Health, and Seattle Genetics.
Peer reviewers on this manuscript have received an honorarium from JME for their review work. A reviewer on this manuscript has disclosed that they are employed by Johnson & Johnson. Peer reviewers on this manuscript have no other relevant financial relationships or otherwise to disclose.
Author contributions
All authors contributed to the study design, interpretation of results, and manuscript preparation. All authors approved the final version for submission and are fully responsible for all content and editorial decisions for this manuscript.
Ethical approval statement
This study was exempt from Institutional Review Board approval (anonymous administrative database study not requiring review).
Supplemental Material
Download MS Word (182.3 KB)Acknowledgements
The authors received editorial assistance in the preparation of this manuscript from Niamh Burke, PhD, of Excerpta Medica, funded by Bristol Myers Squibb.
Data availability statement
Bristol Myers Squibb policy on data sharing may be found at https://www.bms.com/researchers-and-partners/independent-research/data-sharing-request-process.html.
References
- De Kouchkovsky I, Abdul-Hay M. Acute myeloid leukemia: a comprehensive review and 2016 update. Blood Cancer J. 2016;6(7):e441.
- National Cancer Institute Surveillance, Epidemiology, and End Results Program. Cancer stat facts: leukemia – acute myeloid leukemia (AML); [cited 2021 Dec]. Available from: https://seer.cancer.gov/statfacts/html/amyl.html.
- O’Donnell MR, Tallman MS, Abboud CN, et al. Acute myeloid leukemia, version 3.2017, NCCN clinical practice guidelines in oncology. J Natl Compr Canc Netw. 2017;15(7):926–957.
- Ossenkoppele G, Schuurhuis GJ. MRD in AML: does it already guide therapy decision-making? Hematol Am Soc Hematol Educ Program. 2016;2016(1):356–365.
- Döhner H, Estey E, Grimwade D, et al. Diagnosis and management of AML in adults: 2017 ELN recommendations from an international expert panel. Blood. 2017;129(4):424–447.
- Morita K, Kantarjian HM, Wang F, et al. Clearance of somatic mutations at remission and the risk of relapse in acute myeloid leukemia. J Clin Oncol. 2018;36(18):1788–1797.
- MacPherson L, Dawson MA. Survival of the fittest: Darwinian selection underpins chemotherapy resistance in AML. Cell Stem Cell. 2017;21(3):291–292.
- Pandya BJ, Chen C-C, Medeiros BC, et al. Economic and clinical burden of relapsed and/or refractory active treatment episodes in patients with acute myeloid (AML) in the USA: a retrospective analysis of a commercial payer database. Adv Ther. 2019;36(8):1922–1935.
- Zeidan AM, Mahmoud D, Kucmin-Bemelmans IT, et al. Economic burden associated with acute myeloid leukemia treatment. Expert Rev Hematol. 2016;9(1):79–89.
- Bell JA, Galaznik A, Farrelly E, et al. Economic burden of elderly patients with acute myeloid leukemia treated in routine clinical care in the United States. Leuk Res. 2018;71:27–33.
- Meyers J, Yu Y, Kaye JA, et al. Medicare fee-for-service enrollees with primary acute myeloid leukemia: an analysis of treatment patterns survival, and healthcare resource utilization and costs. Appl Health Econ Health Policy. 2013;11(3):275–286.
- Paramore LC, Thomas SK, Knopf KB, et al. Estimating costs of care for patients with newly diagnosed metastatic colorectal cancer. Clin Colorectal Cancer. 2006;6(1):52–58.
- Medeiros BC, Satram-Hoang S, Hurst D, et al. Big data analysis of treatment patterns and outcomes among elderly acute myeloid leukemia patients in the United States. Ann Hematol. 2015;94(7):1127–1138.
- Hagiwara M, Sharma A, Chung KC, et al. Healthcare resource utilization and costs in patients with newly diagnosed acute myeloid leukemia. J Med Econ. 2018;21(11):1119–1130.
- Sacks NC, Cyr PL, Louie AC, et al. Burden of acute myeloid leukemia among older, newly diagnosed patients: retrospective analysis of data from the 2010 to 2012 medicare limited data set. Clin Ther. 2018;40(5):692–703.e2.
- Chastek B, Harley C, Kallich J, et al. Health care costs for patients with cancer at the end of life. J Oncol Pract. 2012;8(6):75s–80s.
- Menzin J, Lang K, Earle CC, et al. The outcomes and costs of acute myeloid leukemia among the elderly. Arch Intern Med. 2002;162(14):1597–1603.
- LeBlanc TW, Egan PC, Olszewski AJ. Transfusion dependence, use of hospice services, and quality of end-of-life care in leukemia. Blood. 2018;132(7):717–726.
- Pandya BJ, Chen C-C, Medeiros BC, et al. Economic and clinical burden of acute myeloid leukemia episodes of care in the United States: a retrospective analysis of a commercial payer database. J Manag Care Spec Pharm. 2020;26(7):849–859.
- Irish W, Ryan M, Gache L, et al. Acute myeloid leukemia: a retrospective claims analysis of resource utilization and expenditures for newly diagnosed patients from first-line induction to remission and relapse. Curr Med Res Opin. 2017;33(3):519–527.
- Preussler JM, Meyer CL, Mau L, et al. Healthcare costs and utilization for patients age 50 to 64 years with acute myeloid leukemia treated with chemotherapy or with chemotherapy and allogenic hematopoietic cell transplantation. Biol Blood Marrow Transplant. 2017;23(6):1021–1028.
- Stein EM, Bonifacio G, Latremouille-Viau D, et al. Treatment patterns, healthcare resource utilization, and costs in patients with acute myeloid leukemia in commercially insured and medicare populations. J Med Econ. 2018;21(6):556–555.