
Abstract
Aims
To compare relative costs associated with the diagnostic pathways for hepatocellular carcinoma (HCC) in the US and China according to the initial imaging modality used. Gadoxetate disodium (ethoxylbenzyl-diethylenetriaminepentaacetic acid)-enhanced magnetic resonance imaging (EOB-MRI) was compared to contrast-enhanced multidetector computed tomography (MDCT), extracellular contrast media enhanced-MRI (ECCM-MRI) and contrast-enhanced ultrasound (CEUS).
Materials and methods
Decision tree models were developed to simulate the clinical pathway, based on local clinical guidelines, and validated by experts. Input data were derived from the literature (up to 31 December 2020) as well as from interviews with local experts.
Results
The models showed that compared to alternative initial imaging modalities, EOB-MRI was associated with higher diagnostic accuracy (fewer false-positive and fewer false-negative results). Increasing proportionate use of EOB-MRI resulted in a cost offset per patient (excluding false-negative patients) in both the US (USD 337) and China (CNY 1,443), driven by reductions in scan costs and unnecessary treatment costs. The use of EOB-MRI was also associated with a shorter average waiting time for a final diagnosis and treatment decision for patients compared to MDCT, ECCM-MRI, and CEUS.
Conclusion
The findings of these models demonstrate that EOB-MRI is the most accurate and rapid imaging modality for the diagnosis of HCC in the US and China, resulting in cost offsets that may benefit the healthcare system.
Introduction
GLOBOCAN 2020 lists liver cancer as the sixth most common cancer worldwide, being responsible for 905,677 cases (4.7%) in 2020. Primary liver cancer was the third-leading cause of cancer deaths in 2020, being responsible for 830,180 deaths (8.3%)Citation1. Hepatocellular carcinoma (HCC) accounts for 90% of primary liver cancersCitation2, and the five-year survival rate is 20% in the USCitation3, and 14.8% in ChinaCitation4.
Survival is greatly dependent on the stage of disease at which a patient is diagnosed. While median survival for early-stage HCC (stages 0 or A) is >60 months, for intermediate stage (stage B) it is 20 months and for advanced stage (stage C or D) it is 11 months, or <3 months, respectivelyCitation5. To optimize treatment initiation and patient survival, it is important to identify HCC accurately and as early as possible in the course of the disease.
Diagnostic guidelines in the US and China recommend several imaging modalities for the diagnosis of HCC, including contrast-enhanced multi-detector computed tomography (MDCT), contrast-enhanced magnetic resonance imaging (MRI), and contrast-enhanced ultrasound (CEUS)Citation6,Citation7. While the data are variable, recent meta-analyses have shown that contrast-enhanced MRI has improved diagnostic accuracy compared with other modalities in the diagnosis of HCC, with Chou et al. reporting a sensitivity of 83 and 86% for CT and MRI, respectivelyCitation8, and Roberts et al. reporting a sensitivity and specificity of 66 and 92% for CT compared with 82 and 91% for MRICitation9. The use of gadoxetate disodium [ethoxylbenzyl-diethylenetriaminepentaacetic acid (EOB)] further enhances the diagnostic accuracy of contrast-enhanced MRI using extracellular contrast media (ECCM). EOB-MRI was reported to have a sensitivity of 87% and a specificity of 94% compared with ECCM-MRI, which had a sensitivity of 75% and a specificity of 86%Citation9.
Several studies have investigated the economic benefits of using EOB-MRI in the diagnosis of HCC: a 2018 study by He et al. in ChinaCitation10, a 2017 study by Nishie et al. in JapanCitation11, and a 2016 study by Lee et al. in Thailand and South KoreaCitation12. The He et al. study found that EOB-MRI was associated with higher diagnostic accuracy, had similar total diagnostic and treatment costs compared with MDCT, and had lower total costs than ECCM-MRI. The study also concluded that patients were less likely to require follow-on confirmatory imaging procedures if imaged with EOB-MRI compared with MDCT and ECCM-MRI. The Nishie et al. study showed that EOB-MRI was associated with lower direct costs and generated more quality-adjusted life years (QALYs) than either ECCM-MRI or contrast-enhanced-MDCT (CE-MDCT). Lee et al. found that EOB-MRI is associated with the highest diagnostic certainty and minimizes the need for additional confirmatory diagnostic procedures compared with ECCM-MRI and MDCT in the diagnosis of HCC. Studies to date have not investigated the cost offsets associated with EOB-MRI use, and EOB-MRI has not been compared to CEUS in previous studies.
In the current study, the relative costs associated with HCC diagnostic pathways according to initial imaging modality in the US and China were evaluated. The cost of the HCC diagnostic pathway was simulated from the initial imaging procedure to treatment selection in a decision-tree model. We hypothesized that EOB-MRI would be associated with a cost offset per patient compared with other imaging modalities since previous studies have shown economic benefits of using EOB-MRICitation10–12. Lifetime treatment costs, as well as QALYs and the incremental cost-effectiveness ratio (ICER), were calculated using an extension Markov model. EOB-MRI was compared with MDCT, ECCM-MRI, and CEUS. The US and China were chosen to demonstrate the consistency of our hypothesis and the results of the model across two very different health systems.
Methods
Model structure
A decision-tree model was built to simulate the HCC clinical pathway for different initial imaging modalities (from initial imaging procedures to treatment selection). Upon entering the model and at each decision node, patients were distributed to subsequent steps following calculations (outlined in Supplementary Table 1) that considered the model inputs described below.
Patient population
Patients entering the model are defined as those who have been screened and have suspected HCC. The data from the literature used to inform the inputs into this model were validated as being representative of this patient population and current practice through expert interviews. The number of patients entering the model is set to be 1,000 as a default.
Model input data
Data inputs for the model were collected from the literature or, where literature data was unavailable or insufficient, based on expert interviews in line with previous publications in this areaCitation10–12 and ISPOR guidelines regarding HEOR researchCitation13. Data inputs retrieved from published literature were identified in targeted searches conducted in MEDLINE PubMed using MeSH terms. Initially, the search was focused on papers published between 2015 and the end of 2020; however, this was expanded to include 2004 (when the use of gadoxetate disodium as an MRI contrast agent was first approved) to 31 December 2020 due to limited data. The literature search objectives, inclusion and exclusion criteria, and search strings can be found in Supplementary Tables 2–4.
Expert interviews were carried out with radiology stakeholders in the US and China to validate the diagnosis and treatment pathway outlined in clinical guidelines and fill data gaps related to the implementation of diagnostic modalities.
For the US model inputs, 11 interviews were carried out with four radiologists (all board-certified from academic settings), three oncologists (two from the community setting and one from the academic setting), two hospital pharmacists (one from the community setting and one from the academic setting), and two radiology administrators (both from the academic setting). For the China model inputs, four interviews were conducted, two with radiologists, one with a hepatologist, and one with a pharmacy director, all based at university hospitals. Where model data were taken from expert interviews, an average (mean) of the values reported by experts was taken to be the input value in the model. In the US, to reduce bias from extreme values, the lowest and highest reported values were excluded from the calculation.
For more information on model input data sources and the reasons for their use in the model, please see Supplementary Table 5.
Sensitivity and specificity
Sensitivity and specificity data for each diagnostic modality were derived from peer-reviewed literature only. Where possible, data from local studies or (where unavailable) meta-analyses comprising multiple studies were used to identify sensitivity and specificity inputs (). Biopsy was assumed to have a specificity and sensitivity of 100%, as used in a previous health economic studyCitation10.
Table 1. Sensitivity and specificity of each diagnostic modality.
Prevalence
For the US model input, HCC prevalence in suspected HCC patients was taken from expert interviews and was estimated to be 44%, while in China, the prevalence was taken from a previous study done in China which estimated the prevalence of HCC to be 47%Citation10.
Follow-on confirmatory diagnostic procedures
For the US model inputs, the percentage of follow-on confirmatory diagnostic procedures required after each imaging modality were taken from expert interviews due to a lack of published evidence; while for the China model inputs, the quantity of follow-on confirmatory diagnostic procedures was taken from a previous study for MDCT, ECCM-MRI, and EOB-MRI (). Low CEUS usage in China meant that the published literature and Chinese expert interviews did not provide estimates for follow-on procedures; therefore, a conservative estimate that was lower than the value reported for CEUS in the US was chosen as an input.
Table 2. Percentage of follow-on confirmatory diagnostic procedures required, by imaging modality.
Within the model, MDCT could be followed by ECCM-MRI, EOB-MRI, and biopsy, CEUS could be followed by ECCM-MRI, EOB-MRI and biopsy, ECCM-MRI by EOB-MRI and biopsy, and EOB-MRI by biopsy only. These follow-on procedures were validated in expert interviews.
Waiting times for/between diagnostic procedures
Each step of the decision tree was assigned a time duration (), allowing the time of a diagnostic pathway to be modeled and compared with that of another. The length of time to final diagnosis and treatment decision consisted of the time to initial diagnostic procedure and the time between diagnostic procedures, which was determined by how many rounds of diagnostic procedures patients got before a final diagnostic decision was made. The time between imaging procedures differed depending on the outcome of the preceding modality (dependent on whether a positive or negative diagnosis was received). These time lengths are listed in .
Table 3. Waiting times for/between diagnostic procedures.
Cost inputs
Each step of the decision tree was also assigned a cost (based on costs listed in and ), allowing the cost of a chosen diagnostic procedure to be modeled and compared with that of another.
Table 4. Diagnosis costs.
Table 5. Treatment costs.
For the US model inputs, costs were based on the CMS claims databaseCitation15 as well as the RED BOOK from Micromedex list of drug pricesCitation16 (accessed November 2020), while for the China model inputs, costs were derived from a previous health economic study by He et al. and adjusted for inflation to 2021, as well as interview dataCitation10.
Decision tree
Decision-tree models for each country were based on local clinical guidelines for the diagnosis and treatment of HCCCitation6,Citation7. The decision trees simulated the clinical pathway of patients with suspected HCC from initial imaging procedures to treatment selection. They were validated in expert interviews with radiology stakeholders in the US and China.
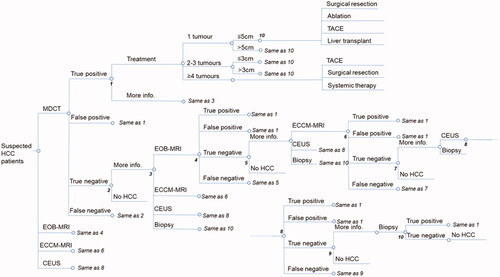
The decision tree structures comprised 10 steps for both the US () and China (). Patients were initially imaged with MDCT, ECCM-MRI, EOB-MRI, or CEUS, and biopsy was considered from the second round of diagnosis. After initial imaging, patients were either given a positive (including true positive and false positive), negative (including true negative and false negative), or indeterminate diagnosis. Patients with a positive HCC diagnosis underwent treatment according to Barcelona Clinic Liver Cancer (BCLC) stage in the US, and according to tumor number and size in China. For the US model inputs, the distribution of patients between stages and the distribution of treatment options for a specific disease stage was derived from expert interviews. For China model inputs, these distributions were derived from a previous studyCitation10. Patients classified as indeterminate continued for further imaging or biopsy, and patients with a negative HCC diagnosis did not receive treatment and were not associated with any further steps.
Figure 1. US decision tree. Based on local clinical guidelines and validated in expert interviews. Staging is based on the BCLC staging system. Abbreviations. HCC, hepatocellular carcinoma; MDCT, multidetector computed tomography; EOB-MRI, gadoxetic acid-magnetic resonance imaging; ECCM-MRI, extracellular contrast media-magnetic resonance imaging; CEUS, contrast-enhanced ultrasound; TACE, transarterial chemoembolization; TARE, transarterial radioembolization; SBRT, stereotactic body radiotherapy.
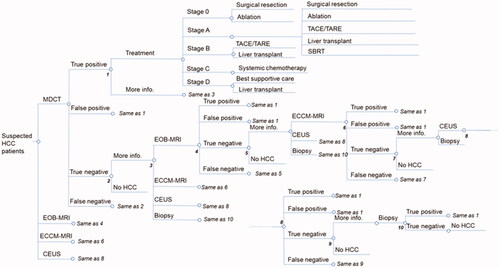
Figure 2. China decision tree. Based on local clinical guidelines and validated in expert interviews. Abbreviations. HCC, hepatocellular carcinoma; MDCT, multidetector computed tomography; EOB-MRI, gadoxetic acid-magnetic resonance imaging; ECCM-MRI, extracellular contrast media-magnetic resonance imaging; CEUS, contrast-enhanced ultrasound; TACE, transarterial chemoembolization.
Sensitivity analyses
Several sensitivity analyses were undertaken. Firstly, a one-way sensitivity analysis was conducted to evaluate the relative importance of different inputs on the cost offset. To test that the model results held true within the range of values presented in the literature for key data inputs, upper and lower values for key inputs were tested to understand the impact on cost offset. Tornado plots were generated to show the top 12 model inputs in terms of their impact on cost offset. Upper and lower limits were chosen to be at the extremes or outside of the range of values identified across the literature, and if this information was unavailable, parameters were varied by ±25%.
A two-way sensitivity analysis was undertaken for EOB-MRI sensitivity and specificity to assess the cost-offset results when EOB-MRI sensitivity and specificity are varied simultaneously.
The final evaluation done was a scenario analysis to understand the cost offset when the distribution of patients among the initial imaging modalities was varied. In the scenario analysis, the distribution of EOB-MRI was varied from 10 to 70% (10, 40, 55, and 70%) compared with 10% in the US and 18% in the China models.
Markov model extension
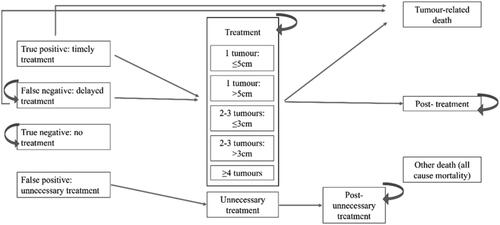
A Markov model extension evaluated the number of false-negative patients and associated costs, over the long term in both the US and China. The model began after the decision-tree model and ran over a lifetime horizon. For each country, the model had 14 health states to which patients could be assigned. The Markov diagrams are shown in and . Inputs for the model were derived from the literatureCitation18–20; where there were gaps in the literature, expert elicitation interviews were used to fill these. Costs assigned to each stage of treatment were the same as for the decision-tree model ( and ).
Figure 3. US Markov model diagram. Abbreviation. BCLC, Barcelona Clinic Liver Cancer.

Figure 4. China Markov model diagram.
Results
EOB-MRI had a lower false-positive and false-negative rate compared with other modalities
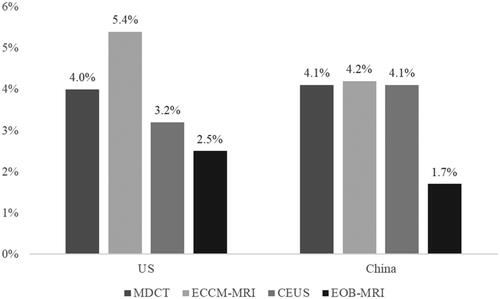
Both the US and China models show that in patients initially imaged with EOB-MRI the false-positive and false-negative rates were the lowest compared with other modalities. In the US, 2.5% of patients initially imaged with EOB-MRI were false positives compared with 4.0% for MDCT, 5.4% for ECCM-MRI, and 3.2% for CEUS. In China, 1.7% of patients initially imaged with EOB-MRI were false positives compared with 4.1% for MDCT, 4.2% for ECCM-MRI, and 4.1% for CEUS ().
Figure 5. False-positive rates for each modality in each country. Abbreviations. US, United States; MDCT, multidetector computed tomography; EOB-MRI, gadoxetic acid-magnetic resonance imaging; ECCM-MRI, extracellular contrast media-magnetic resonance imaging; CEUS, contrast-enhanced ultrasound.
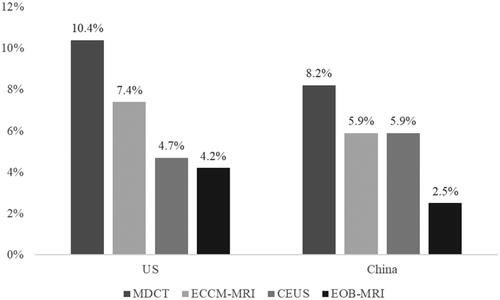
Patients initially imaged with EOB-MRI also had the lowest false-negative rate compared with other modalities (). In the US, the false-negative rate was 4.2% (in comparison to 10.4% for MDCT, 7.4% for ECCM-MRI, and 4.7% for CEUS), while in China the false-negative rate was 2.5% (in comparison to 8.2% for MDCT, 5.9% for ECCM-MRI, and 5.9% for CEUS).
Figure 6. False-negative rates for each modality in each country. Abbreviations. US, United States; MDCT, multidetector computed tomography; EOB-MRI, gadoxetic acid-magnetic resonance imaging; ECCM-MRI, extracellular contrast media-magnetic resonance imaging; CEUS, contrast-enhanced ultrasound.
To put the model results into the context of clinical practice, we tested model results using proportionate use of each initial modality. The original and alternative proportions are shown in . For the distributions of modalities in subsequent rounds of diagnoses, see Supplementary Tables 6–10. For each comparison, the EOB-MRI proportion was increased by 35% points from baseline (10% for the US, 18% for China) to enable comparison between lower and higher levels of EOB-MRI use. The comparatively lower false-positive and false-negative rates seen when using EOB-MRI resulted in fewer patients receiving unnecessary treatment (false-positive diagnoses) or missing an opportunity to treat their disease (false-negative diagnoses) when the proportion of patients initially imaged with EOB-MRI was increased by 35% points ( and ). In the US, increasing EOB-MRI usage resulted in a decrease of seven patients (from 43 to 36) receiving unnecessary treatment and a decrease of 15 patients (from 80 to 65) missed diagnoses out of a total of 1,000 patients. In China, increasing EOB-MRI usage resulted in a decrease of eight patients (from 37 to 29) receiving unnecessary treatment and a decrease of 16 patients (from 62 to 46) missing diagnoses, out of a total of 1,000 patients.
Figure 7. Number of patients out of 1,000 receiving unnecessary treatment in current practice compared to an increase of 35% in the use of EOB-MRI. Abbreviations. US, United States; EOB-MRI, gadoxetic acid-magnetic resonance imaging.
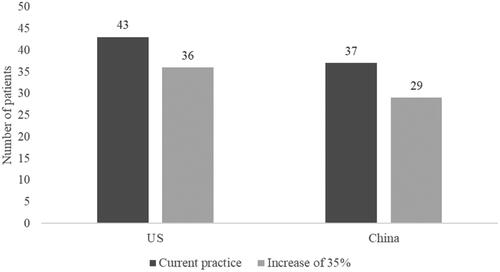
Figure 8. Number of patients out of 1,000 receiving a false-negative diagnosis in current practice compared to an increase of 35% in the use of EOB-MRI. Abbreviations. US, United States; EOB-MRI, gadoxetic acid-magnetic resonance imaging.
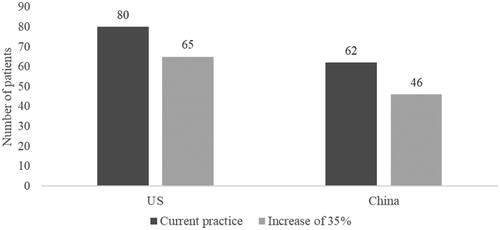
Table 6. Current and alternative distributions of each modality.
Patients initially imaged with EOB-MRI required fewer confirmatory diagnostic procedures
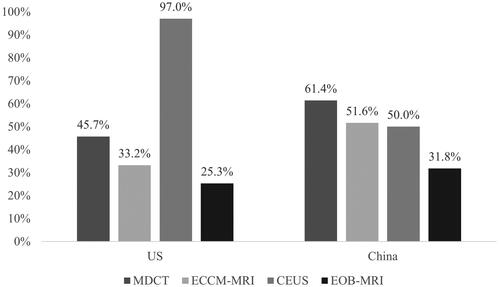
The requirements for follow-on procedures were taken from expert interviews for the US; for China, data from a local study were used for all modalitiesCitation10, except CEUS - where a conservative estimate based on US responses was applied due to a lack of China-specific information (). In the US, patients initially imaged with EOB-MRI had the lowest rate of further diagnostic procedure requirements compared with other imaging modalities. 25.3% of patients required a further diagnostic procedure (biopsy only) in comparison to 45.7% for MDCT, 33.2% for ECCM-MRI, and 97.0% for CEUS (including other imaging procedures). This was also the case in China, where the rates were 31.8% for EOB-MRI (biopsy only), 61.4% for MDCT, 51.6% for ECCM-MRI, and 50.0% for CEUS.
Figure 9. Percentage of follow-on confirmatory diagnostic procedures required, by imaging modality. Abbreviations. US, United States; MDCT, multidetector computed tomography; EOB-MRI, gadoxetic acid-magnetic resonance imaging; ECCM-MRI, extracellular contrast media-magnetic resonance imaging; CEUS, contrast-enhanced ultrasound.
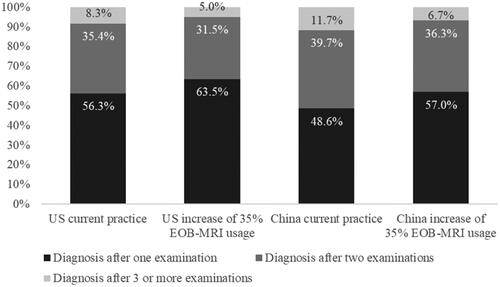
The lower confirmatory diagnostic requirements for patients initially imaged with EOB-MRI resulted in more patients receiving a final diagnosis after one examination when the percentage of patients initially receiving EOB-MRI was increased by 35% points from current levels (). In the US, the proportion of patients receiving a final diagnosis after one examination increased by 7.2% (from 56.3 to 63.5%) and reduced by 3.9% (from 35.4 to 31.5%) and 3.3% (from 8.3 to 5.0%) in patients receiving a final diagnosis after two examinations and three or more examinations, respectively. In China, the proportion of patients receiving a final diagnosis after one examination increased by 8.4% (from 48.6 to 57.0%) and decreased by 3.4% (from 39.7 to 36.6%) and 5.0% (from 11.7 to 6.7%) in patients receiving a final diagnosis after two examinations and three or more examinations, respectively.
Figure 10. Distribution of patients according to the number of examinations to achieve a final diagnosis. Abbreviation. US, United States.
Patients initially imaged with EOB-MRI incurred lower unnecessary treatment costs
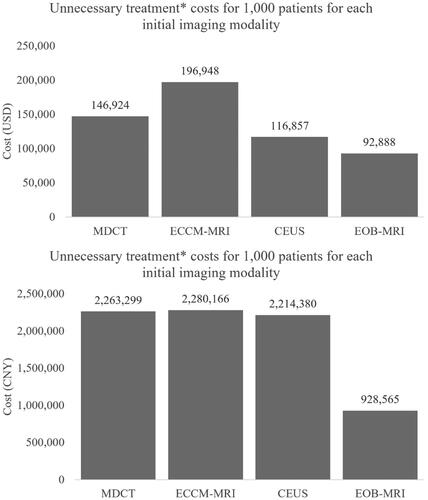
The cost of unnecessary treatment associated with each initial diagnostic modality was lowest for EOB-MRI (). In the US, the cost was USD 92,888 for 1,000 patients compared with USD 146,924 for MDCT, USD 196,948 for ECCM-MRI, and USD 116,857 for CEUS. In China, the cost for 1,000 patients was CNY 928,565 for EOB-MRI compared with CNY 2,263,299 for MDCT, CNY 2,280,166 for ECCM-MRI, and CNY 2,214,380 for CEUS.
Figure 11. Unnecessary treatment costs are associated with each initial imaging modality for 1,000 patients. *Unnecessary treatment refers to patients who receive treatment after a false-positive HCC diagnosis. Abbreviations. US, United States; USD, MDCT, multidetector computed tomography; EOB-MRI, gadoxetic acid-magnetic resonance imaging; ECCM-MRI, extracellular contrast media-magnetic resonance imaging; CEUS, contrast-enhanced ultrasound.
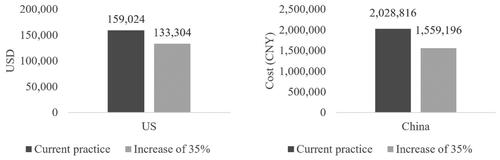
These lower costs for 1,000 patients translated into a lower overall cost of unnecessary treatment of the modality mix in clinical practice when increasing the percentage of patients initially imaged with EOB-MRI by 35% from current practice levels (). In the US, unnecessary treatment costs decreased by USD 25,720 from USD 159,024 to USD 133,304 while in China, unnecessary treatment costs decreased by CNY 469,620 from CNY 2,028,816 to CNY 1,559,196.
Figure 12. Unnecessary treatment costs for 1,000 patients for current practice compared to an increase of 35% in initial EOB-MRI usage. *Unnecessary treatment refers to patients who receive treatment after a false-positive HCC diagnosis. Abbreviations. US, United States; EOB-MRI, gadoxetic acid-magnetic resonance imaging.
Patients initially imaged with EOB-MRI had shorter times from initial consultation to final diagnosis and treatment decision
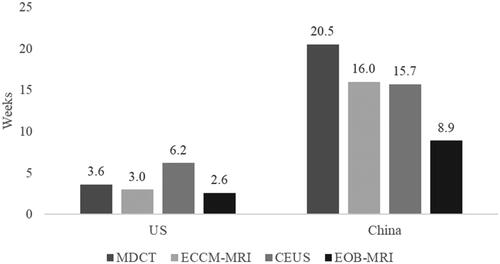
The average time from initial consultation to final diagnosis and treatment decision for each modality () was calculated using the time to initial imaging procedure, the proportion of patients requiring subsequent procedures, and the duration between imaging procedures. In the US, the average time from initial consultation to final diagnosis and treatment decision was 2.6 weeks for EOB-MRI compared with 3.6 weeks for MDCT, 3.0 weeks for ECCM-MRI, and 6.2 weeks for CEUS. In China, the average time from initial consultation to final diagnosis and treatment decision was 8.9 weeks for EOB-MRI compared with 20.5 weeks for MDCT, 16.0 weeks for ECCM-MRI, and 15.7 weeks for CEUS.
Figure 13. Waiting time to diagnosis and treatment decision for each first-line diagnostic modality. Abbreviations. US, United States; MDCT, multidetector computed tomography; EOB-MRI, gadoxetic acid-magnetic resonance imaging; ECCM-MRI, extracellular contrast media-magnetic resonance imaging; CEUS, contrast-enhanced ultrasound.
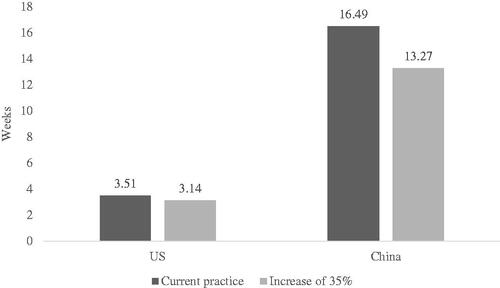
Due to the shorter time from initial consultation to a final diagnosis and treatment decision for EOB-MRI, when the percentage of patients initially imaged with EOB-MRI increased by 35% (see for distributions), the average time to final diagnosis and treatment decision decreases accordingly (). In the US, there was a decrease of 0.37 weeks (from 3.51 to 3.14) in the average time to diagnosis and treatment decision, while in China, there was a decrease of 3.22 weeks (from 16.49 to 13.27).
Figure 14. Average time to final diagnosis and treatment decision for current practice compared to an increase of 35% in EOB-MRI usage. Abbreviations. US, United States; EOB-MRI, gadoxetic acid-magnetic resonance imaging.
Increasing the proportionate use of EOB-MRI predicted an overall cost-offset per patient
When EOB-MRI usage was increased from current percentage levels by 35%, there was an overall cost offset per patient (excluding false-negative patients) for diagnosis and treatment of HCC. In the US, the total per-patient cost offset was USD 337 and in China, the total cost offset was CNY 1,492. In the US, the cost offset was mostly driven by a reduction of USD 211 in scan costs and USD 83 in unnecessary treatment. In China, the cost offset was mostly driven by a reduction of CNY 1,261 in unnecessary treatment.
Contrast agent cost is a very small proportion of total costs of care for HCC. In the US, the model shows that when the proportion of patients initially imaged with EOB-MRI was increased by 35% the total per-patient costs increased by 3.0% (from USD 12,144 to USD 12,513), with contrast agent costs of USD 173 going down to USD 169. This represented 1.4% of total costs in both cases. In China, when the proportion of patients imaged with EOB-MRI was increased by 35% the total per-patient costs increased by 1.6% (from CNY 27,358 to CNY 27,282), with contrast agent costs of CNY 827 going up to CNY 986. This represented 3.0 and 3.5% of total costs, respectively.
Using EOB-MRI as a first-line imaging modality may result in increased survival
A retrospective cohort study in the US showed that patients with delayed treatment (time to treatment >3 months) had lower survival rates compared to those without delayed treatmentCitation21. The study showed that patients with delayed treatment had one- and two-year survival rates of 63.7 and 50.1%, respectively, compared with 89.8 and 64.5% for patients without delayed treatment. To reflect the impact of delayed treatment, average two-year survival rates were calculated for each initial imaging modality. Log-logistic distributions were fitted to the Kaplan-Meier curves for delayed and non-delayed treatment from Singal et al.Citation21 and extrapolated to two years (Supplementary Figure 1). Based on the proportion of patients who had delayed treatment after initial imaging with each modality, the extrapolations suggested that patients initially imaged with EOB-MRI may have the best overall survival of the four modalities (Supplementary Figures 2 and 3). In the US, patients initially imaged with EOB-MRI had an overall two-year survival rate of 63.7% compared with 60.7% for MDCT, 62.2% for ECCM-MRI, and 63.5% for CEUS. Increasing the percentage of patients initially imaged with EOB-MRI by 35% resulted in a decrease in the percentage of patients with a waiting time of more than three months (and therefore delayed initiation of treatment) of 3.3%, from 18.3 to 15.0%. This difference translated into a gain in 12.6 life years per 1,000 patients over two years (which corresponds to ∼0.15 months per patient on average). In China, patients initially imaged with EOB-MRI had an overall two-year survival rate of 57.9% compared with 50.6% for MDCT, 52.7% for ECCM-MRI, and 53.6% for CEUS. Increasing the percentage of patients initially imaged with EOB-MRI by 35% resulted in a decrease in the percentage of patients with a waiting time of more than three months (and therefore delayed initiation of treatment) of 10.3%, from 61.1 to 50.8%. This difference translated into a gain in 38.4 life years per 1,000 patients over two years (which corresponds to ∼0.46 months per patient on average).
Sensitivity and scenario analyses
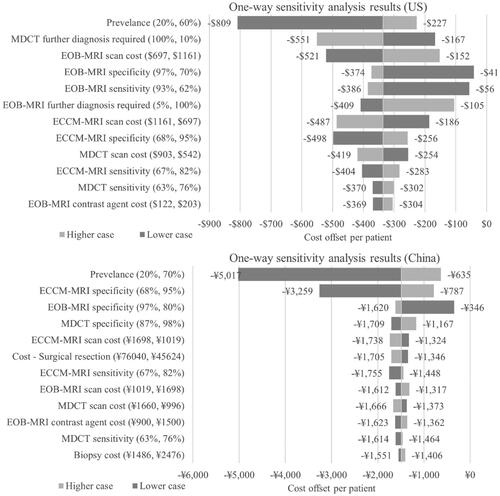
A one-way sensitivity analysis () showed that in the US model the inputs that had the most impact on the total per patient cost-offset result were the prevalence of HCC, and the percentage of patients requiring further imaging after an initial MDCT scan, and EOB-MRI scan cost. For HCC prevalence, the lower case of 20% resulted in a cost offset of USD 809 and the upper case of 60% resulted in a cost offset of USD 227. For further imaging requirements for MDCT, the lower case of 10% resulted in a cost offset of USD 167 and the upper case of 100% resulted in a cost offset of USD 551; while for EOB-MRI scan cost, the lower case of USD 697 resulted in a cost offset of USD 521 and the upper case of USD 1,161 resulted in a cost offset of USD 152. In the China model, the inputs that had the most impact on the per patient cost-offset result were the prevalence of HCC, ECCM-MRI specificity, and EOB-MRI specificity. For HCC prevalence, the lower case of 20% resulted in a cost offset of CNY 5,017 and the upper case of 70% resulted in a cost offset of CNY 635. For ECCM-MRI specificity, the lower case of 68% resulted in a cost offset of CNY 3,259 and the upper case of 95% resulted in a cost offset of CNY 787; while for EOB-MRI specificity, the lower case of 80% resulted in a cost offset of CNY 346 and the upper case of 97% resulted in a cost offset of CNY 1,620.
Figure 15. One-way sensitivity analysis results. The numbers in the brackets after the variables show the upper and lower limits tested in the one-way sensitivity analysis. Abbreviations. US, United States; MDCT, multidetector computed tomography; EOB-MRI, gadoxetic acid-magnetic resonance imaging; ECCM-MRI, extracellular contrast media-magnetic resonance imaging; CEUS, contrast-enhanced ultrasound.
A two-way sensitivity analysis for EOB-MRI sensitivity and EOB-MRI specificity on the US model showed that there is only a cost increase when (a) both EOB-MRI sensitivity and specificity are lower than 79%, (b) sensitivity is lower than 82% and specificity is lower than 71%, or (c) sensitivity is <69% and specificity is <82%. In China, the two-way sensitivity analysis results show that there is only a cost increase when (a) both EOB-MRI sensitivity and specificity are lower than 80%, (b) sensitivity is lower than 93% and specificity is lower than 77%, or (c) sensitivity is <69% and specificity is <83%.
Scenario analyses were undertaken to understand the cost-offset results with different proportions of initial imaging modalities. The distributions for each modality are shown in , and cost-offset results are in . The results demonstrate that there is always a cost offset when EOB-MRI usage is increased from baseline values, and if EOB-MRI usage is lower than current practice, there is a cost increase.
Figure 16. Per patient cost-offset results for different EOB-MRI usage levels compared to baseline values (10% in US; 18% in China) for the decision tree model timeframe (from initial imaging to treatment selection). Abbreviations. US, United States; EOB-MRI, gadoxetic acid-magnetic resonance imaging.
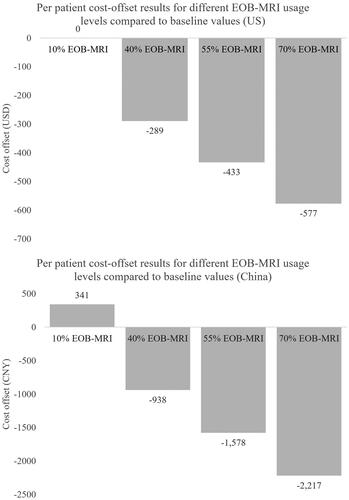
Table 7. Current practice and alternative scenario modality distributions for scenario analyses.
Using EOB-MRI as a first-line imaging modality decreased false-negative patient numbers over a lifetime horizon
An extension Markov model sought to quantify the lifetime costs and the number of false-negative patients. The model was run with a 6-month cycle length over a lifetime horizon, aligning with clinical guidelines that recommend surveillance every 6 months for patients at risk of HCCCitation6,Citation7. When the number of patients initially imaged with EOB-MRI is increased by 35%, the number of false-negative patients decreased from 210 to 177 out of 1,000 in the US, and from 208 to 182 out of 1,000 in China. The average treatment cost per patient slightly increased from 23,459 USD to 24,202 USD and 29,265 CNY to 29,736 CNY due to increased accuracy of diagnosis and, therefore, more patients receiving treatment in their lifetime. In the US, the alternative practice produced an additional gain of 0.04 QALY at an incremental cost of 721 USD, yielding an ICER of 18,228 USD. With a willingness-to-pay of 100,000 USD, the probability of alternative practice being cost-effective compared to the current practice was 99.3%. In China, the alternative practice produced an additional gain of 0.04 QALY at an incremental cost of 294 CNY, yielding an ICER of 8,218 CNY/QALY. With a willingness-to-pay of 242,928 CNY/QALY (three times GDP per capita), the probability of alternative practice being cost-effective compared to the current practice was 100%.
A one-way sensitivity analysis was undertaken which showed that the value that affected the ICER the most was the true negative utility in the US, and the utility value for the post-treatment stage in China. In the US, the lower case of 0.72 resulted in an ICER of 35,151 USD/QALY while the upper case of 1.00 resulted in an ICER of 14,382 USD/QALY. In China, the lower case of 0.57 resulted in an ICER of 10,122 CNY/QALY while the upper case of 0.85 resulted in an ICER of 6,917 CNY/QALY.
Discussion
In this study, we hypothesized that EOB-MRI would be associated with a cost offset per patient compared with other imaging modalities. Our analysis demonstrates consistent total cost offsets per patient when increasing the use of EOB-MRI as a first-line imaging modality for the diagnosis of HCC in the US and China. As well as cost offsets, the models also suggest that the increased initial use of EOB-MRI results in fewer follow-on confirmatory imaging procedures, lower unnecessary treatment costs, and shorter times from initial consultation to a diagnosis and treatment decision. These results are consistent with previous health economic studies conducted for the diagnosis of HCC. It should be noted that false-negative patients were excluded from the cost-offset calculations due to their future diagnosis and treatment costs falling outside of the model time horizon (from initial consultation to a final diagnosis and treatment decision) as well as uncertainty around the future costs they would incur. Our models show that using EOB-MRI in the diagnosis of HCC led to the fewest patients receiving a false-negative diagnosis compared with other modalities and, therefore, suggesting that EOB-MRI leads to the least uncertainty with regards to future diagnostic and treatment costs. The Markov model shows that this is also true over a lifetime horizon, with fewer false-negative diagnoses when there is an increase in EOB-MRI use. There was a slight increase in total average patient costs over a lifetime horizon due to increased accuracy of diagnosis and, therefore, more patients undergoing treatment in their lifetime. However, in both the US and China, the ICER was far below typical willingness-to-pay thresholds. The results of the sensitivity analyses were also within the willingness-to-pay thresholds, suggesting that increasing the use of EOB-MRI as an initial imaging modality for HCC diagnosis is robustly cost-effective.
The 2019 Guidelines for diagnosis and treatment of HCC in China recommend the use of MDCT, ECCM-MRI, EOB-MRI, and CEUS for the diagnosis of HCCCitation7. The guidelines state that the capability of CT to detect and diagnose small liver tumors is inferior to that of MRI and that the detection, diagnostic accuracy, and differential diagnoses of liver cancers are improved when MRI is used with a hepatocyte-specific contrast agent (e.g. EOB-MRI). Our results show that patients initially imaged with EOB-MRI have lower false-positive and lower false-negative rates compared with other modalities, suggesting that better adherence to the clinical guidelines will have both cost and clinical benefits. In the US, the 2018 AASLD Guidelines for the Diagnosis, Staging, and Management of Hepatocellular Carcinoma recommend MDCT or MRI for the diagnosis of HCC as well as CEUSCitation6. Unlike in the Chinese guidelines, there is no recommendation of one modality over another; however, a study showing superior sensitivity of MRI (with an extracellular or hepatobiliary agent) over CT is referencedCitation9.
In addition to economic benefits, our study has shown that EOB-MRI is associated with shorter waiting times from initial consultation to final diagnosis and treatment decision, which may result in survival benefits for patients initially imaged with EOB-MRI. An increase in survival due to EOB-MRI imaging has been shown in other studies. A 2015 study by Kim et al. showed that additional imaging with EOB-MRI (on top of CT imaging) was associated with the detection of additional HCC nodules, decreased risk of HCC recurrence, and improved overall survival in patients who were initially assessed to have a single-nodular HCC by dynamic CTCitation22. Kang et al. showed that in HCC patients, additional use of contrast-enhanced MRI (on top of CT) was associated with lower mortality, and CT plus EOB-MRI was associated with better survival than CT plus non-EOB-MRI in patients with localized diseaseCitation23.
Several previous economic studies have investigated the economic benefits of using EOB-MRI in the diagnosis of HCC. A 2016 study by Lee et al. in South Korea and Thailand found that EOB-MRI yielded the highest diagnostic certainty, minimized the need for additional confirmatory imaging, and was the least costly imaging modality for the diagnosis of HCC. From the hospital payer perspective, the total cost to reach a treatment decision in South Korea was USD 3,087, USD 3,205, and USD 3,403 per patient for EOB-MRI, MDCT, and ECCM-MRI, respectively; while in Thailand it was USD 702, USD 931, and USD 873, respectivelyCitation12. A cost-effectiveness study by Nishie et al. in Japan found that over a patient’s lifetime, EOB-MRI was associated with lower direct costs (JPY 2,174,869) and generated more QALYs (9.502) compared with ECCM-MRI (JPY 2,365,421, 9.303 QALYs) and contrast-enhanced CT (CECT) (JPY 2,482,608, 9.215 QALYs)Citation11. In 2018, He et al. published a study in China where the total diagnosis and treatment cost per patient after initial EOB-MRI imaging was similar to MDCT (CNY 30,360 vs. CNY 30,803) and lower than ECCM-MRI (CNY 30,360 vs. CNY 31,465)Citation10. This was driven by reduced confirmatory imaging procedures and unnecessary treatments when patients were initially imaged with EOB-MRI. The consistency of our results with previous studies, as well as across markets within this study suggests that the trends observed reflect the benefits of using EOB-MRI as a first-line imaging modality in the diagnosis of HCC. As well as economic benefits, we show that EOB-MRI can reduce healthcare resource usage, by decreasing follow-on confirmatory imaging procedures, streamlining the diagnostic pathway, and allowing patients to access optimal treatment more quickly.
Our study had some limitations. The decision trees represent a simplification of the clinical pathway and, therefore, cannot capture all the real-life complexities of a clinical decision-making pathway. For example, our model does not allow stratification of costs by HCC stage; however, future models may elaborate on the cost-benefit of EOB-MRI and other modalities based on disease stage. The model assumes that all patients would have the same access to imaging and can undergo all imaging modalities. An assumption of 100% accuracy of biopsy was made, which may be untrue in clinical practice; however, this assumption has been made in previous diagnostic modelsCitation10. Secondly, due to a lack of published evidence in the countries being considered, input data were taken from interviews with expert radiology stakeholders. This methodology may lead to some bias in input data due to the small sample size and differences in clinical practices at different centers; however, this is in line with the approach taken in previous studies in this areaCitation10–12. Thirdly, only direct treatment costs were included in the model analyses, with associated productivity loss costs and quality of life effects not included; although, studies have shown that patients with advanced HCC have a lower quality of life scores than those who are diagnosed at earlier stages of the diseaseCitation24. Fourthly, the long-term patient outcomes and associated costs that were investigated in the Markov model are associated with several assumptions, including that treatment is curative and patients do not relapse. Moreover, beyond initial treatment selection, there are several factors outside of diagnostic modality selection that can influence patient outcomes, such as patient characteristics, treatment success rate, and potential relapse. Due to these limitations, further studies should be considered to evaluate the real-world impact of different diagnostic strategies on long-term patient outcomes and system costs.
Conclusion
The models developed in this study demonstrate that EOB-MRI use represents the most rapid modality for HCC diagnosis, resulting in cost offsets.
Transparency
Declaration of funding
Bayer AG has initiated, organized, and funded this project including payment of agencies involved in the development and execution of this project.
Declaration of financial/other relationships
MB, GK, DZ, and ME are employed by Bayer AG. AC, GJ, and JH are employed by Wickenstones Ltd., the agency involved in the development and execution of this study.
Author contributions
All authors were involved with all aspects of this work (including conception and design; analysis and interpretation of the data and drafting and review of the paper) and agree to be accountable for all aspects of the work.
Reviewer disclosures
Peer reviewers on this manuscript have received an honorarium from JME for their review work but have no other relevant financial relationships to disclose.
Supplemental Material
Download MS Word (61.6 KB)Acknowledgements
We would like to acknowledge Gemma Zhu who provided vital input to the development of the model in its early stages. We would also like to thank Marie DiFiore and Antonio Remiro-Azócar for their review and input on the project.
References
- Globocan 2020. Liver cancer fact sheet; 2020. Available from: https://gco.iarc.fr/today/data/factsheets/cancers/11-Liver-fact-sheet.pdf
- Villanueva A. Hepatocellular carcinoma. N Engl J Med. 2019;380(15):1450–1462.
- Society AC. 2021 [cited 2021 Jun 11]. Available from: https://www.cancer.org/cancer/liver-cancer/detection-diagnosis-staging/survival-rates.html
- Hassanipour S, Vali M, Gaffari-Fam S, et al. The survival rate of hepatocellular carcinoma in Asian countries: a systematic review and Meta-analysis. Excli J. 2020;19:108–130.
- Weledji EP, Enow Orock G, Ngowe MN, et al. How grim is hepatocellular carcinoma? Ann Med Surg. 2014;3(3):71–76.
- Marrero JA, Kulik LM, Sirlin CB, et al. Diagnosis, staging, and management of hepatocellular carcinoma: 2018 practice guidance by the American Association for the Study of Liver Diseases. Hepatology. 2018;68(2):723–750.
- Zhou J, Sun H, Wang Z, et al. Guidelines for the diagnosis and treatment of hepatocellular carcinoma (2019 edition). Liver Cancer. 2020;9(6):682–720.
- Chou R, Cuevas C, Fu R, et al. Imaging techniques for the diagnosis of hepatocellular carcinoma. Ann Intern Med. 2015;162(10):697–711.
- Roberts LR, Sirlin CB, Zaiem F, et al. Imaging for the diagnosis of hepatocellular carcinoma: a systematic review and meta-analysis. Hepatology. 2018;67(1):401–421.
- He X, Wu J, Holtorf AP, et al. Health economic assessment of Gd-EOB-DTPA MRI versus ECCM-MRI and multi-detector CT for diagnosis of hepatocellular carcinoma in China. PLOS One. 2018;13(1):e0191095.
- Nishie A, Goshima S, Haradome H, et al. Cost-effectiveness of EOB-MRI for hepatocellular carcinoma in Japan. Clin Ther. 2017;39(4):738–750.e4.
- Lee JM, Kim MJ, Phongkitkarun S, et al. Health economic evaluation of Gd-EOB-DTPA MRI vs ECCM-MRI and multi-detector computed tomography in patients with suspected hepatocellular carcinoma in Thailand and South Korea. J Med Econ. 2016;19(8):759–768.
- Briggs AH, Weinstein MC, Fenwick EA, et al. Model parameter estimation and uncertainty analysis: a report of the ISPOR-SMDM modeling good research practices task force working group-6. Med Decis Making. 2012;32(5):722–732.
- Zhang J, Yu Y, Li Y, et al. Diagnostic value of contrast-enhanced ultrasound in hepatocellular carcinoma: a meta-analysis with evidence from 1998 to 2016. Oncotarget. 2017;8(43):75418–75426.
- Medicare provider utilization and payment data: physician and other supplier PUF CY2017; 2017. Available from: https://data.cms.gov/Medicare-Physician-Supplier/Medicare-Provider-Utilization-and-Payment-Data-Phy/fs4p-t5eq/data
- RED BOOK online from micromedex. Available from: http://www.micromedexsolutions.com/
- Goossens N, Singal AG, King LY, et al. Cost-effectiveness of risk score-stratified hepatocellular carcinoma screening in patients with cirrhosis. Clin Transl Gastroenterol. 2017;8(6):e101.
- Chen H, Chen L. Estimating cost-effectiveness associated with all-oral regimen for chronic hepatitis C in China. PLOS One. 2017;12(4):e0175189.
- Lima PH, Fan B, Bérubé J, et al. Cost-utility analysis of imaging for surveillance and diagnosis of hepatocellular carcinoma. Am J Roentgenol. 2019;213(1):17–25.
- Lin Y-J, Lin C-N, Sedghi T, et al. Treatment patterns and survival in hepatocellular carcinoma in the United States and Taiwan. PLOS One. 2020;15(10):e0240542.
- Singal AG, Waljee AK, Patel N, et al. Therapeutic delays lead to worse survival among patients with hepatocellular carcinoma. J Natl Compr Canc Netw. 2013;11(9):1101–1108.
- Kim HD, Lim YS, Han S, et al. Evaluation of early-stage hepatocellular carcinoma by magnetic resonance imaging with gadoxetic acid detects additional lesions and increases overall survival. Gastroenterology. 2015;148(7):1371–1382.
- Kang TW, Kong SY, Kang D, et al. Use of gadoxetic acid-enhanced liver MRI and mortality in more than 30 000 patients with hepatocellular carcinoma: a nationwide analysis. Radiology. 2020;295(1):114–124.
- Kohn CG, Singh P, Korytowsky B, et al. Humanistic and economic burden of hepatocellular carcinoma: systematic literature review. Am J Manag Care. 2019;25(2 Spec No):sp61–sp73.