
Abstract
Aims
We evaluated the availability of transcatheter aortic valve replacement (TAVR) to determine its value across all severe symptomatic aortic stenosis (SSAS) patients, especially those untreated because of concerns regarding invasive surgical AVR (SAVR) and its impact on active aging.
Methods
We performed payer perspective cost-utility analysis (CUA) and societal perspective cost-benefit analysis (CBA). The CBA’s benefit measure is active time: salaried labor, unpaid work, and active leisure. The study population is a cohort of US elderly SSAS patients. We compared a “TAVR available” scenario in which SSAS patients distribute themselves across TAVR, SAVR, and medical management (MM); and a “TAVR not available” scenario with only SAVR and MM. We structured each scenario with a decision-tree model of SSAS patient treatment allocation. We measured the association between health and active time in the US Health and Retirement Study and used this association to impute active time to SSAS patients given their health.
Results
The incremental cost-effectiveness ratio (ICER) and rate of return (RoR) of TAVR availability were $8,533 and 395%, respectively. CUA net monetary benefits (NMB) were $212,199 per patient and $43.4 billion population-wide. CBA NMB were $50,530 per patient and $10.3 billion population-wide.
Limitations
Among study limitations were scarcity of evidence regarding key parameters and the lack of long-term survival, health utility, and treatment cost data. Our analysis did not account for TAVR durability, retreatments, and valve-in-valve treatments.
Conclusion
Across risk-, age-, and treatment-eligibility groups, TAVR is the economically optimal treatment choice. It represents strong value-for-money per patient and population-wide. The vast majority of TAVR value involves raising treatment uptake among the untreated.
PLAIN LANGUAGE SUMMARY
Aortic stenosis (AS) is a common and lethal heart disease. Surgical treatment has long been available, but its invasiveness limits uptake. More recently, transcatheter aortic valve replacement (TAVR) has emerged as a treatment alternative. Its minimal invasiveness has significantly increased treatment rates, but economic evaluations omit this benefit, risking undervaluation. We evaluated TAVR in elderly US severe symptomatic AS patients, using payer perspective cost-utility analysis (CUA) and societal perspective cost-benefit analysis (CBA). Both CUA and CBA incorporated TAVR’s impact on treatment rates. Given patient preferences for treatment options promoting active aging, our CBA used the value of active time as a benefit measure. We found that CUA/CBA net monetary benefits are $212,199/$50,530 per patient. Across risk-, age-, and treatment-eligibility groups, TAVR is the economically optimal treatment choice over surgery and medical management. It represents strong value-for-money per patient and population-wide. Increased treatment uptake accounts for the vast share of TAVR's value.
Introduction
Aortic stenosis (AS) is a common, lethal cardiovascular disease. It affects 2–7% of the global elderly population, and its prevalence will grow with global agingCitation1,Citation2. If untreated, prognosis is poor: about half of severe symptomatic AS (SSAS) patients die within 2 years of symptom onsetCitation3,Citation4. Aortic valve replacement (AVR) is the only effective treatment option for SSAS. For five decades, surgical AVR (SAVR) was the gold standard for treatmentCitation5. SAVR requires a chest incision, a heart–lung machine, and stopping the heart. Given its invasiveness, many patients were considered too high risk for SAVR, were not referred, or refused treatmentCitation6,Citation7.
Transcatheter AVR (TAVR), a less invasive treatment, involves a puncture in blood vessels in the leg and does not require a heart–lung machine or stopping the heart. Based on clinical studies, the US Food and Drug Administration (FDA) approved TAVR for patients with prohibitive (previously called “inoperable”) risk in 2011, high risk in 2012, intermediate risk in 2016, and low risk in 2019Citation5. There has been a corresponding shift in treatment guidelinesCitation8. In 2020, the American College of Cardiology/American Heart Association (ACC/AHA) Joint Committee on Clinical Practice Guidelines issued new guidelines reflecting the reduced role of surgical risk in treatment choice and the increased role of treatment eligibility and ageCitation9. TAVR’s availability has had a profound impact on SSAS treatment, raising overall treatment rates and shifting treatment toward less invasivenessCitation10–12. Before TAVR, about 70,000 patients underwent SAVR in 2010; in 2020, about 150,000 patients underwent AVR (SAVR or TAVR) in the USCitation12.
TAVR has been extensively economically evaluated, often in connection with clinical trialsCitation13–15. The Placement of Aortic Transcatheter Valves (PARTNER) trials found that TAVR improves health relative to medical management (MM) among prohibitive-risk patients (“prohibitive risks”)Citation16 and relative to SAVR among high-Citation17, intermediate-Citation18, and low-risk patientsCitation3,Citation19 (collectively, “non-prohibitive risks”). Cost-utility analyses (CUAs) found TAVR cost-effective for prohibitive risksCitation14 and economically dominant for intermediate risksCitation15. US CUAs for low risks remain unpublished.
These evaluations are risk-group-specific. Within each group, TAVR is compared to a fixed alternative: MM among prohibitive risksCitation14,Citation16,Citation20,Citation21 and SAVR among non-prohibitive risksCitation3,Citation13,Citation15,Citation17–20,Citation22. However, such evaluations shed incomplete light on TAVR’s SSAS population-wide value, which is realized across three patient groups:
Prohibitive risks who otherwise have no treatment options,
Non-prohibitive risks who otherwise receive SAVR, and
Non-prohibitive risks who otherwise remain untreated, in part because of invasiveness concerns.
Existing TAVR evaluations for prohibitive risks compare TAVR to MM, while those for non-prohibitive risks compare TAVR to SAVR, thus addressing (1) and (2), respectively. However, few evaluations address (3), which is problematic. Significant increases in US TAVR volumes over the past decade suggest this may be the most important beneficiary group.
Capturing (3) requires comparing (i) a scenario where TAVR is not available and non-prohibitive risks remain untreated at empirically plausible rates with (ii) a scenario where TAVR is available and otherwise untreated non-prohibitive risks take up TAVR at empirically plausible rates. Capturing (1)–(3) requires a scenario comparison spanning the entire SSAS population regardless of risk level.
Existing evaluations use quality-adjusted life years (QALYs) as the benefit metric. But other metrics may be useful, especially those reflecting active aging (AA). Patients and physicians may forego treatment, believing it merely extends sedentary morbidity-stricken lives, adding years to life but not life to years. Preference studies show that AS patients want active lives that let them be independent, contribute productively to society and family by working or volunteering, reconnect with friends, fulfill obligations to friends and family, perform daily activities, avoid being burdens to relatives, and share active entertainments with loved onesCitation23,Citation24. AA is increasingly considered an important health care goalCitation25 and contributes to morbidity compressionCitation26. In an aging world, AA benefits not just patients but also broader society by reducing the time, effort, and public and private resource costs of elderly support.
Our TAVR evaluation has three distinctive features. First, it reflects TAVR’s aggregate value across all three patient groups above, especially the third. Second, it supplements traditional CUA with a cost-benefit analysis (CBA) that uses active time – i.e. hours doing salaried labor, unpaid work, or active leisure, monetized at a wage reflecting the economic value of such time – as a benefit measure to track TAVR’s impact on AA. A CUA values every QALY equally, while a CBA values every dollar of monetized benefit equally. These constitute distinct analyses because QALYs map imperfectly onto active time, as active time is a function of health and age rather than health alone. Third, it explicitly models how TAVR availability affects SSAS population-wide treatment patterns and guidelines and, subsequently, health and economic outcomes.
Methods
Overall design
We evaluated TAVR using both a health payer perspective CUA and a societal perspective CBA. To capture impact across all patient groups, our study population was a cohort of elderly (aged ≥65 years) SSAS patients in the US. To capture TAVR’s impact on raising and shifting treatment patterns, we evaluated TAVR availability (which allows decisions to respond to such availability) rather than TAVR treatment (which holds such decisions fixed). We compared health and economic outcomes across a “TAVR available” scenario in which SSAS patients distribute themselves across TAVR, SAVR, and MM; and a “TAVR not available” scenario with only SAVR and MM.
We standardized possible patient ages within risk groups based on clinical trial populations and a treatment-guideline-based decision tree structure. In the base year 2020, low-risk SSAS patients could be 70, 73, or 85 years of age; intermediate-risk patients could be 70, 80, or 85 years; and high- and prohibitive-risk patients were 80 years. We assumed a maximum lifespan of 100 years, so our modeling horizon was 100 − 70 = 30 years.
Decision trees
Structure
We structured each scenario with a decision tree model of SSAS patient allocation across treatments. Decision trees are ideal for modeling such allocation because their various elements map well to the real-world patterns needing representation: terminal nodes represent the treatments themselves (TAVR, SAVR, MM), upstream nodes represent the determinants of those treatments (e.g. risk group, age, treatment eligibility, futility, treatment choice), branches represent the alternative values of those determinants (e.g. low, intermediate, high, and prohibitive risks), and branch probabilities represent real-world prevalence of those alternatives (e.g. risk group prevalence).
shows our base case decision tree, called the “state-of-the-art” or “SOTA” tree. We structured the “TAVR available” branch of the SOTA tree according to 2020 ACC/AHA treatment guidelinesCitation9, given their importance and likely reflection of the current treatment pathways for SSAS patients. These guidelines first distinguish between SSAS patients with high or prohibitive risk and those with intermediate or low risk. Among high or prohibitive risks, those for whom treatment is medically futile because of low life expectancy should receive MM, while those for whom treatment is not futile should be recommended for TAVR if eligible. Among low or intermediate risks, SAVR should be recommended for TAVR ineligible patients. Among TAVR eligible patients, both TAVR and SAVR are class 1 recommendations for those aged <80 years, while TAVR and SAVR are class 1 and 2a recommendations, respectively, for those aged ≥80 years.
Figure 1. State-of-the-art decision tree. All lines indicate branches of the decision tree. The rectangular nodes name each branch, and the values in each associated circle indicate the percentage of the previous branch that moves into subsequent nodes. Abbreviations: MM, medical management; SAVR, surgical aortic valve replacement; TAVR, transcatheter aortic valve replacement.
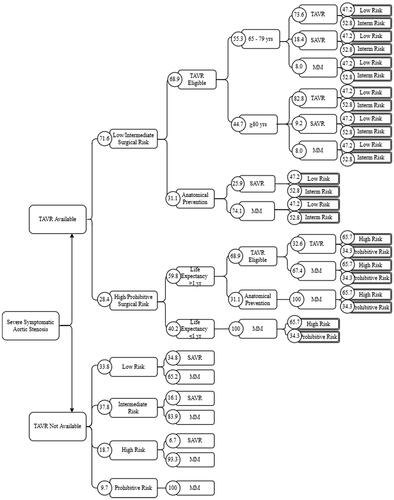
We modeled the “TAVR not available” scenario on empirical patterns observed prior to TAVR introduction. In this scenario, SSAS patients were first sorted into risk groups, then into SAVR or MM.
Across both scenarios, we allowed MM as an option for AVR-eligible patients, reflecting the reality that such patients may remain untreated, whether by choice or because treatment is not offered. We did not model any other departures from the guidelines given the scarcity of evidence that would allow quantifying such departures with confidence.
Parametrization
Except for scenario branches emerging from the first node of a decision tree, each branch is associated with a probability conditional on its parent node being reached, equal to the real-world prevalence of the patient characteristic or treatment option represented by the branch. We derived these probabilities from published literature and represent them for the SOTA tree in . See Supplementary Appendix Section 1.2 for derivation and sources.
Terminal node state utilities
Each terminal node in the tree corresponds to a particular patient group (with characteristics like risk group, age group, treatment eligibility, and futility) receiving a particular treatment (TAVR, SAVR, or MM). We associated each such node with lifetime trajectories in survival probabilities, health utilities, treatment costs, and active time. (“State utilities” are values associated with a terminal node and are distinct from “health utilities” that enter QALY calculations.)
We constructed lifetime survival curves for treatment- and risk group-specific SSAS patient cohorts from studies of mortality in such cohorts (Supplementary Appendix Table A6). We extrapolated beyond the time horizon of these studies using general population mortality risks from US 2017 life tablesCitation27. Following precedents in the literature (see Supplementary Appendix Section 2.1.1 for details), in all but low-risk patients, we scaled these general population risks upwards to allow for excess SSAS-related mortality.
We obtained EQ-5D health utilities from the literature (Supplementary Appendix Table A7). We age-adjusted these utilities and extrapolated them beyond the study time horizons assuming a 0.3% per year declineCitation28. All sourcesCitation14,Citation17,Citation19 provided health utilities at baseline, 1, 6, and 12 months, except for intermediate-risk SAVR and TAVR, which lack 6-month valuesCitation18,Citation22 and which we set equal to their 12-month values. Health utilities for patients receiving MM were only available for the prohibitive-risk population. We therefore estimated the health utility of non-prohibitive-risk MM patients by assuming the ratio of their health utility relative to TAVR patients from the same risk group equals the ratio of the health utility of prohibitive-risk MM patients to the health utility of prohibitive-risk TAVR patients. We linearly interpolated monthly health utilities between 0 and 12 months using reported 1 and 6 month values.
We constructed lifetime cost curves based on observed treatment costs (Supplementary Appendix Table A8). Where treatment costs were available from these references for 12 months, we took monthly costs beyond 12 months to equal average monthly costs from months 7 to 12. Where treatment costs were available for 5 years, we took monthly costs beyond 5 years to equal average monthly costs from years 2 to 5.
We took active time to be hours spent on salaried labor, unpaid work, and active leisure. To estimate active time of SSAS patients, we estimated a relationship between health utility and active time from Health and Retirement Study (HRS)Citation29 data, then used this relationship to impute SSAS patients’ active time based on their lifetime health utility trajectories. We valued active time using a median age-specific hourly wage we computed from the HRS.
We used the above lifetime trajectories to compute a terminal-node-specific vector of state utilities consisting of the expected present discounted value (EPDV) of lifetime treatment costs, QALYs, and active time.
See the Supplementary Appendix for complete details on the above.
Value-for-money indicators
We computed the expected value of the above state utilities across the terminal nodes within each scenario, where the expectation is taken with respect to the probabilities of those terminal nodes within the scenario. This computation gave the expected value of lifetime QALYs, treatment costs, and active time for the average SSAS patient when TAVR is available or when TAVR is not available. For our CUA, we computed the incremental cost-effectiveness ratio (ICER) associated with TAVR availability as the ratio of the difference in expected lifetime treatment costs across scenarios to the difference in expected lifetime QALYs. For our CBA, we computed a rate-of-return (RoR) given by 100*(BCR-1), where the benefit-cost ratio (BCR) equals the ratio of the difference in the expected value of lifetime active time across scenarios to the difference in expected lifetime treatment costs.
We discounted health and economic outcomes at 3%Citation30 and reported monetary quantities in 2018 USD (this choice of year avoids non-representative COVID-induced price dynamics). We computed aggregate benefit measures by multiplying per person measures by the SSAS population size.
Scenario and sensitivity analyses
We assessed sensitivity to our lifetime mortality, health utility, cost, and active time estimates by raising and lowering these values by 10%. We assessed sensitivity to discounting using rates of 0% and 6%. We performed a scenario analysis replacing the SOTA decision tree with one consistent with historical patterns of SSAS treatment decisions, driven less by age and treatment eligibility and more by risk group. We investigated alternative SOTA tree node probabilities for risk group proportions, TAVR eligibility, and medical futility. We derived such alternatives from the literature where available and from assumptions where not. We tested an alternate wage for valuing active time and the removal of the 0.3% annual health utility decline. These scenarios are detailed in and Supplementary Appendix Section 4.
Results
Terminal node state utilities
Our constructed lifetime trends in risk- and treatment-specific survival, treatment costs, health utilities, and time use are shown in Supplementary Appendix Figures A4–A7. The corresponding state utilities and the EPDVs of their lifetime values are reported in . These state utilities attach to the terminal nodes to the right of our decision tree in . For example, the top-right terminal node corresponds to low-risk TAVR recipients aged 65–79. The EPDV of lifetime costs, QALYs, and hours of paid work, unpaid work, and active leisure corresponding to these patients were $165,769; 10.54 QALYs; 1,315; 15,341; and 10,856 h, respectively. For a treatment/risk group combination overall, the state utility values are shown in the first row of each state utility’s section. For example, among low-risk TAVR recipients, regardless of age and life expectancy, the EPDV of lifetime costs, QALYs, and hours of paid work, unpaid work, and active leisure corresponding to these patients were $155,634; 9.39 QALYs; 803; 13,500; and 9,678 h respectively. also reports patient proportions of the SSAS population.
Table 1. Terminal state utilities.
Our survival curves (Supplementary Appendix Figure A4) showed that across all risk groups, survival with AVR treatment was much higher than survival without treatment. Survival with TAVR was at least as high as survival with SAVR, though they were very similar for low and intermediate risks, while for high risks, survival with TAVR was markedly higher.
Our health utilities (Supplementary Appendix Figure A5) showed that, across all relevant risk groups, AVR raised health utilities above their baseline values, peaking within about a year of treatment, then declining to a long-term level that is still above baseline. In the long run, health utility with TAVR was about the same as or slightly higher than with SAVR. Health utility with MM was uniformly lower than with AVR. As with TAVR and SAVR, MM’s beneficial impact on health utility peaked within a year of treatment. Beyond the first year, health utility with MM was strictly lower than baseline for low and intermediate risks, about the same as baseline for high risks, and above baseline for prohibitive risks. Health utilities also declined as risk levels increase.
Monthly costs (Supplementary Appendix Figure A6) showed that, across all risk groups, monthly costs after initial treatment were highest for MM and were often at least $1,000 higher than those of AVRs. Among non-prohibitive risks, monthly costs were similar between TAVR and SAVR, though SAVR costs were slightly higher.
Active time use categories (Supplementary Appendix Figure A7) showed that active time declined with age and risk level across all categories and was highest with TAVR, slightly lower with SAVR, and lowest with MM.
The patterns above helped explain patterns in . Lifetime costs were highest among prohibitive-risk TAVR recipients ($217,066) because TAVR recipients had higher survival than SAVR and MM recipients and because monthly treatment costs among prohibitive risks were higher than those among non-prohibitive risks. Both these rationales more than counteracted the lower survival prospects of prohibitive risks. Low-risk MM recipients had the second-highest lifetime costs ($189,945) due to higher survival prospects of low risks (relative to other risk level patients) and the high monthly costs of MM. Otherwise, lifetime costs within a risk group were lowest with MM because of their low survival prospects and lack of index hospitalization for AVR. EPDV of lifetime QALYs was highest among low-risk TAVR and SAVR recipients because low risks had higher survival prospects and health utilities, and lowest among non-low-risk MM recipients because of their low health survival prospects and health utilities. Active time also tended to be higher among those at lower risk levels and among TAVR recipients, second-highest among SAVR recipients, and lowest among MM recipients. State utilities tended to be higher among the younger elderly (those aged 65–79 years) and among those with longer life expectancy (greater than 1 year) because of longevity’s effect on these state utilities.
Optimality of TAVR as treatment choice
Across all risk groups, regardless of age or life expectancy, the EPDV of lifetime costs was higher with SAVR than with TAVR. Given greater TAVR longevity, this pattern resulted from SAVR’s higher monthly costs. Except for low-risk patients aged 65–79 years, the EPDV of lifetime costs was lowest with MM. Across all risk groups and age categories, the EPDV of lifetime QALYs was highest with TAVR, second-highest with SAVR, and lowest with MM. These imply that within every risk- and age-group, and across the CUA and CBA, TAVR dominated SAVR with lower costs, higher QALYs, and higher active time.
Among low-risk 65–79-year-olds, TAVR also dominated MM. For other low- and intermediate-risk patients, TAVR was more expensive than MM but produced sufficiently large QALY gains that it was strongly cost-effective relative to MM. For low risks aged ≥80 years, the ICER was (117,482–46,231)/(5.19–1.01) = $17,046. For intermediate-risks aged 65–79 years, the ICER was (200,805–159,659)/(8.92–3.59) = $7,720. For intermediate-risks aged ≥80 years, the ICER was (127,133–43,136)/(3.94–0.88) = $2,7450. Thus, across all treatment choices faced by low- and intermediate-risk patients, TAVR was either the dominating or cost-effective choice.
Among high- and prohibitive-risk patients, TAVR did not dominate MM but was highly cost-effective, with ICERs of (176,043–110,820)/(5.2–2.25) = $22,109 and (217,066–154,805)/2.97 − 1.99) = $20,961, respectively.
Thus, across all risk-, age-, and treatment-eligibility-defined patient groups, TAVR was the optimal treatment choice. Our CBA results yielded the same conclusions regarding dominance, high value-for-money (VfM), and optimality of TAVR across all risk and age groups.
Value-for-money of TAVR availability
The first two columns of show the expected values of lifetime outcomes across the terminal nodes of the “TAVR available” and “TAVR not available” scenarios, respectively. We found that the EPDV of lifetime costs, QALYs, and active time for the average SSAS patient were $138,010, 4.86, and $179,108 when TAVR was available and $125,202, 3.36, and $115,769 when TAVR was not available. Thus, TAVR availability raised costs by $12,808 but improved 1.5 QALYs and generated more value of active time ($63,338) per SSAS patient. At a standard value of $150,000 per QALYCitation2,Citation31, the monetary value of the QALY gain per patient was $225,000. Therefore, our CUA yielded a net monetary benefit (NMB) per patient of $225,000 – $12,808 = $212,192. In our CBA, with benefits measured solely in terms of active time, the NMB per patient was $63,338 – $12,808 = $50,530.
Table 2. Cost-utility and cost-benefit analyses results.
The ICER and RoR of TAVR availability (relative to non-availability) were $8,533 and 395%, respectively, constituting high VfM within CUA and CBA. Given an estimated 204,559 individuals newly-diagnosed with SSAS in the US in 2019 (Supplementary Appendix Section 6.6), the population-wide health gain was 1.50*204,559 = 306,839 QALYs, and NMB was $212,192*204,559 = $43.4 billion. The population-wide value of active time gained was $63,338*204,559 = $13.0B, and corresponding NMB was $50,530*204,559 = $10.3 billion (see ).
Figure 2. Incremental cost, incremental benefit, and net benefit of TAVR availability, both per-patient and aggregate. Abbreviations. B, billion; QALY, quality-adjusted life year; SSAS, severe symptomatic aortic stenosis; TAVR, transcatheter aortic valve replacement.
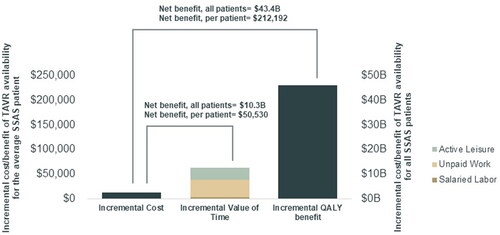
Our CUA yielded larger monetized benefits than our CBA because our CUA monetized QALYs at $150,000, which represented the total value of health to an individual and encompasses health’s interaction with not just active time, but also passive leisure, consumption, and consumer surplus from consumption and non-market time. In contrast, our CBA reflected only the active time aspect of health’s total value and was, thus, conservative.
Scenario and sensitivity analyses
Scenario and sensitivity analyses are summarized in . When we assumed treatment decisions are largely driven by risk group – the “historical practice” case – the ICER rose by over $11,500 but was still only $20,174. Raising prohibitive risks to 30% of the SSAS population raised the ICER by only about $1,000 to $9,519. Changing low risks to 50% of non-prohibitive risks made the ICER fall by about $4,500 to under $4,000. Using SAVR proportions considered independently plausible by the surgeon among the coauthors reduced the ICER by $611 to $7,922. Using clinical trial attrition rates to estimate treatment uptake among treatment eligible patients raised the ICER by $2,519 to $11,052. Adopting estimates of medical futility among high- and prohibitive-risk patients of 12Citation32, 20, and 60% yielded ICERs of $12,534, $11,490, and $5,152. Projecting future TAVR risk distributionsCitation12, assuming 45% of SSAS patients are untreated, eliminating a 0.3% per year background decline in health utility with age, and using estimates of TAVR eligibility from literatureCitation32 and coauthor consultation, all left the ICER virtually unchanged.
Table 3. Scenario and sensitivity analyses results.
Our sensitivity analyses showed that our base case results were not very sensitive to 10% variations in mortality, health utility, treatment costs, active time, and discount rates. The most impactful of these sensitivity analyses were variations in mortality risk. Raising mortality risks by 10% raised the ICER by $1,600 to $10,133. Lowering such risks by 10% lowered the ICER by $1,822 to $6,711. All other sensitivity analyses caused ICER and RoR variations within that range.
Group analysis
Recall that TAVR recipients could be divided into (1) prohibitive risks who would otherwise have remained untreated, (2) non-prohibitive risks who would otherwise have received SAVR, and (3) non-prohibitive risks who would otherwise have remained untreated. We found that these groups respectively constitute 1.31%, 6.29%, and 34.54% of the SSAS population, and receive per-patient CUA NMB of $85,298, $92,125, and $615,466, respectively (). Group (3) was over four times larger than groups (1) and (2) combined.
Table 4. Breakdowns by SSAS patient group: Percentage of the SSAS population and net monetary benefits.
At the SSAS population level, normalized by group size, the CUA NMB of each group was 1.3%*$85,298 = $1,114, 6.3%*$92,125 = $5,792, and 34.5%*$615,466 = $212,594, respectively (Supplementary Appendix Section 6.5). Aggregate benefits accruing to group (3) were, therefore, over 30-times the sum of those in the latter two groups. Recall that existing economic evaluations of TAVR focus on groups (1) and (2) and ignore (3). These calculations suggest the literature has ignored by far the most important group for which TAVR yields value and so vastly understates TAVR’s population-wide value.
Discussion
SSAS is a large and growing problem in the US and globally. Surgical treatment has been long available and highly effective, but its invasiveness has limited its application. Since 2011, TAVR has become available as a less invasive treatment option. Such availability has had a profound impact on SSAS population-wide treatment uptake and guidelines, by our estimate tripling overall treatment rate in the SSAS population from 19% to 55%.
Findings
Raising treatment rates among non-prohibitive risks accounts for the vast majority of TAVR’s benefits. At every treatment decision point – across all risk groups and age groups, absent concerns about TAVR durability – TAVR is the economically optimal treatment choice for all TAVR eligible patients over 65 years old. According to both the CUA and CBA, TAVR represents a very strong VfM treatment option for the average SSAS patient and produces large NMBs across the whole SSAS population.
Limitations
Among study limitations are scarcity of evidence regarding key parameters like the size of the SSAS population (accounting for both treated and untreated patients); the percentages of SSAS patients eligible for AVR treatments; and the relative size and age structure of low-, intermediate-, high-, and prohibitive-risk patients or of patients with medical futility. Another shortcoming is the lack of long-term survival, health utility, and treatment cost data. Our analysis also fails to consider TAVR durability issues, retreatments, and valve-in-valve treatments.
Although TAVR has nearly tripled treatment rates, almost half of SSAS patients remain untreated, many of whom are treatable. The risk of undertreatment of SSAS, while decreasing, remains significant. One possible reason for persistent undertreatment is that patients and physicians may simply be unaware that undertreatment is a large risk and that TAVR represents such a dominating or strong value-for-money non-invasive treatment choice relative to MM. Patient preference studies show that a central goal of AS patients is to be able to live active lives. Such patients may simply be unaware of the extent to which TAVR helps facilitate such “active aging.” We hope that our analysis can show these patients and their physicians the strong value proposition TAVR represents over MM, including through its effects on active aging. We hope our analysis also shows that patients for whom this is a live issue are a significant share of the SSAS population. Educational outreach towards AS patient support groups and heart teams regarding these issues is vital to reducing under-treatment.
Transparency
Declaration of funding
This study was supported by Edwards Lifesciences.
Declaration of financial/other interests
JS and JK are employees of Data for Decisions, LLC (DfD), which received funding from Edwards Lifesciences (ELS) for this work. YS and DB are consultants to DfD. CT, XJ, and SC are employees and shareholders at ELS. MR has received research grant support and consulting fees from ELS and consulting fees from Abbott and JenaValve.
Author contributions
JS: conceptualization, methodology, validation, formal analysis, writing – original draft, writing – review and editing, supervision. JK: methodology, software, validation, formal analysis, investigation, data curation, writing – original draft, writing – review and editing, visualization, project administration. YS: methodology, software, validation, formal analysis, data curation, writing – review and editing, visualization. MR: methodology, validation, resources, writing – review and editing, supervision. CT: conceptualization, methodology, validation, data curation, writing – review and editing, visualization, supervision, project administration. XJ: methodology, validation, data curation, writing – review and editing, visualization, project administration. SC: conceptualization, methodology, validation, resources, writing – review and editing, visualization, supervision, project administration, funding acquisition. DB: conceptualization, writing – review and editing, supervision, funding acquisition.
14._Manuscript_Appendix_Revision_1.docx
Download MS Word (1.2 MB)Guide_to_analysis_files_3.docx
Download MS Word (15.6 KB)Supplementary_Data_2.xlsx
Download MS Excel (207.9 KB)Code_supplement.zip
Download Zip (266.1 MB)Acknowledgements
Janina Broker contributed to the conception and design of this article as well as to acquisition and analysis of data. David Kantor contributed to conception and design of this article as well as to the acquisition of data. Daria Burnes supported critical revision.
Data availability statement
The authors confirm that the data supporting the findings of this study are available within the article and its supplementary materials.
Reviewer disclosure
Peer reviewers on this manuscript have received an honorarium from JME for their review work but have no other relevant financial relationships to disclose.
Correction Statement
This article has been corrected with minor changes. These changes do not impact the academic content of the article.
Related Research Data
References
- Tang L, Gössl M, Ahmed A, et al. Contemporary reasons and clinical outcomes for patients with severe, symptomatic aortic stenosis not undergoing aortic valve replacement. Circ Cardiovasc Interv. 2018;11(12):e007220.
- Sussell J, van Eijndhoven E, Schwartz TT, et al. Economic value of transcatheter valve replacement for inoperable aortic stenosis. Am J Manag Care. 2020;26(2):e50–6–e56.
- Leon MB, Mack MJ, Hahn RT, PARTNER 3 Investigators, et al. Outcomes 2 years after transcatheter aortic valve replacement in patients at low surgical risk. J Am Coll Cardiol. 2021;77(9):1149–1161.
- Brennan MJ, Leon MB, Sheridan P, et al. Racial differences in the use of aortic valve replacement for treatment of symptomatic severe aortic valve stenosis in the transcatheter aortic valve replacement era. JAHA. 2020;9:e015879.
- Kang G, Kim JB. Expanding transcatheter aortic valve replacement into uncharted indications. Korean J Intern Med. 2018;33(3):474–482.
- Charlson E, Legedza ATR, Hamel MB. Decision-making and outcomes in severe symptomatic aortic stenosis. J Heart Valve Dis. 2006;15(3):10.
- Malaisrie SC, Tuday E, Lapin B, et al. Transcatheter aortic valve implantation decreases the rate of unoperated aortic stenosis. Eur J Cardio-Thorac Surg. 2011;40(1):43–48.
- Baumgartner H, Falk V, Bax JJ, et al. 2017 ESC/EACTS guidelines for the management of valvular heart disease. Eur Heart J. 2017;38(36):2739–2791.
- Otto CM, Nishimura RA, Bonow RO, et al. 2020 ACC/AHA guideline for the management of patients with valvular heart disease: a report of the American College of Cardiology/American Heart Association Joint Committee on clinical practice guidelines. J Am Coll Cardiol. 2021;77(4):450–500.
- Mori M, Gupta A, Wang Y, et al. Trends in transcatheter and surgical aortic valve replacement among older adults in the United States. J Am Coll Cardiol. 2021;78(22):2161–2172.
- Clark KA, Chouairi F, Kay B, et al. Trends in transcatheter and surgical aortic valve replacement in the United States, 2008–2018. Am Heart J. 2022;243:87–91.
- Carroll JD, Mack MJ, Vemulapalli S, et al. STS-ACC TVT registry of transcatheter aortic valve replacement. J Am Coll Cardiol. 2020;76(21):2492–2516.
- Reynolds MR, Magnuson EA, Lei Y, et al. Cost-effectiveness of transcatheter aortic valve replacement compared with surgical aortic valve replacement in high-risk patients with severe aortic stenosis. J Am Coll Cardiol. 2012;60(25):2683–2692.
- Reynolds MR, Magnuson EA, Wang K, PARTNER Investigators, et al. Cost-effectiveness of transcatheter aortic valve replacement compared with standard care among inoperable patients with severe aortic stenosis: results from the placement of aortic transcatheter valves (PARTNER) trial (cohort B). Circulation. 2012;125(9):1102–1109.
- Baron SJ, Wang K, House JA, On behalf of the PARTNER 2 Investigators, et al. Cost-effectiveness of transcatheter versus surgical aortic valve replacement in patients with severe aortic stenosis at intermediate risk. Results from the PARTNER 2 trial. Circulation. 2019;139(7):877–888.
- Leon MB, Smith CR, Mack M, et al. Transcatheter aortic-valve implantation for aortic stenosis in patients who cannot undergo surgery. N Engl J Med. 2010;363(17):1597–1607.
- Reynolds MR, Magnuson EA, Wang K, et al. Health-related quality of life after transcatheter or surgical aortic valve replacement in high-risk patients with severe aortic stenosis. J Am Coll Cardiol. 2012;60(6):548–558.
- Baron SJ, Thourani VH, Kodali S, et al. Effect of SAPIEN-3 transcatheter valve implantation on health status in patients with severe aortic stenosis at intermediate surgical risk: results from the PARTNER S3i trial. JACC Cardiovasc Interv. 2018;11(12):1188–1198.
- Baron SJ, Magnuson EA, Lu M, et al. Health status after transcatheter versus surgical aortic valve replacement in low-risk patients with aortic stenosis. J Am Coll Cardiol. 2019;74(23):2833–2842.
- Herrmann HC, Thourani VH, Kodali SK, et al. One-year clinical outcomes with SAPIEN 3 transcatheter aortic valve replacement in high-risk and inoperable patients with severe aortic stenosis. Circulation. 2016;134(2):130–140.
- Kapadia SR, Leon MB, Makkar RR, et al. 5-year outcomes of transcatheter aortic valve replacement compared with standard treatment for patients with inoperable aortic stenosis (PARTNER 1): a randomised controlled trial. Lancet. 2015;385(9986):2485–2491.
- Baron SJ, Arnold SV, Wang K, PARTNER 2 Investigators, et al. Health status benefits of transcatheter vs surgical aortic valve replacement in patients with severe aortic stenosis at intermediate surgical risk. JAMA Cardiol. 2017;2(8):837–845.
- Heen AF, Lytvyn L, Shapiro M, et al. Patient values and preferences on valve replacement for aortic stenosis: a systematic review. Heart. 2021;107(16):1289–1295.
- Coylewright M, Palmer R, O'Neill ES, et al. Patient‐defined goals for the treatment of severe aortic stenosis: a qualitative analysis. Health Expect. 2016;19(5):1036–1043.
- World Health Organization. Active ageing: a policy framework [Internet]. World Health Organization; 2002 [cited 2022 Jan 19]. Report No.: WHO/NMH/NPH/02.8. Available from: https://apps.who.int/iris/handle/10665/67215.
- Fries JF. The theory and practice of active aging. Curr Gerontol Geriatr Res. 2012;2012:420637.
- Kochanek KD, Murphy SL, Xu J, et al. Deaths: final data for 2017. Natl Vital Stat Rep. 2019;68(9):1–77.
- Gada H, Agarwal S, Marwick TH. Perspective on the cost-effectiveness of transapical aortic valve implantation in high-risk patients: outcomes of a decision-analytic model. Ann Cardiothorac Surg. 2012;1(2):145–155.
- University of Michigan. Health and retirement study, consumption and activities mail survey public use dataset [Internet]; 2021 [cited 2021 Oct 1]. Available from: https://hrs.isr.umich.edu/about.
- Neumann PJ, Ganiats TG, Russell LB, et al., editors. Cost-effectiveness in health and medicine. 2nd ed. New York: Oxford University Press; 2016.
- Anderson JL, Heidenreich PA, Barnett PG, et al. ACC/AHA statement on cost/value methodology in clinical practice guidelines and performance measures: a report of the American College of Cardiology/American Heart Association Task Force on performance measures and task force on practice guidelines. J Am Coll Cardiol. 2014;63(21):2304–2322.
- Dharmarajan K, Foster J, Coylewright M, editors, et al. The medically managed patient with severe symptomatic aortic stenosis in the TAVR era: Patient characteristics, reasons for medical management, and quality of shared decision making at heart valve treatment centers. PLoS One. 2017;12(4):e0175926.