
Abstract
Aims
To evaluate the cost-effectiveness of vibegron compared with other oral pharmacologic therapies as treatment for overactive bladder (OAB).
Methods
A semi-Markov model with monthly cycles was developed to support a lifetime horizon of vibegron 75 mg from a US commercial payor or Medicare perspective. The model incorporated efficacy (reductions in daily micturitions and urinary incontinence episodes), adverse events, OAB-related comorbidities, drug–drug interactions, anticholinergic burden, and treatment persistence. Direct costs and quality-adjusted life years (QALY) were accumulated over time. The primary outcome was the cost per QALY incremental cost-effectiveness ratio (ICER). One-way (OWSA) and probabilistic sensitivity analyses (PSA) were performed.
Results
For commercial payors, vibegron was cost-effective at a willingness-to-pay (WTP) threshold of $50,000/QALY versus mirabegron 50 mg (ICER, $9,311) and at a WTP threshold of $150,000/QALY versus mirabegron 25 mg (ICER, $141,957) and versus an anticholinergic basket based on market share (ICER, $118,121). For Medicare, vibegron was cost-effective at a WTP threshold of $50,000/QALY versus mirabegron 50 mg (ICER, $12,154) and at a WTP threshold of $100,000/QALY versus mirabegron 25 mg (ICER, $99,150) and versus an anticholinergic market basket (ICER, $60,756). For commercial payors and Medicare, OWSAs for vibegron versus mirabegron indicated cost-effectiveness was most sensitive to vibegron persistence at 1 and 12 months. PSAs indicated that vibegron was cost-effective versus mirabegron 50 mg 98.6% and 100% of the time at $50,000/QALY for commercial payors and Medicare payors, respectively.
Limitations
Due to lack of real-world data available on persistence, vibegron was assumed to have the same persistence as mirabegron 50 mg. Long-term efficacy was assumed to be sustained beyond 52 weeks in the absence of clinical trials longer than 52 weeks.
Conclusions
Vibegron is cost-effective from a commercial payor (WTP threshold $150,000/QALY) and Medicare (WTP threshold $100,000/QALY) perspective when compared with other oral pharmacologic treatments for OAB.
PLAIN LANGUAGE SUMMARY
Overactive bladder (OAB) affects more than 30 million adults in the United States. OAB is a condition associated with frequent and sudden urges to urinate. Drugs for treating OAB may improve symptoms for patients. Anticholinergic drugs are one type of drug available for treating OAB. Anticholinergic drugs may cause side effects such as dry mouth and constipation. Newer types of drugs called β3-adrenergic receptor agonists are available for treating OAB symptoms. Vibegron is a member of the β3-adrenergic receptor agonist class of drugs. Vibegron does not cause the same side effects related to anticholinergic drugs such as dry mouth and constipation. β3-adrenergic receptor agonists work well for OAB symptoms but may be more expensive than anticholinergic drugs. It is important to choose drugs that work well and that are a reasonable price. This study assessed if vibegron is cost-effective for people enrolled in US private insurance and Medicare plans. Compared with other common drugs such as anticholinergic drugs for OAB, vibegron is cost-effective for people enrolled in private insurance and Medicare plans. This was in part because vibegron works better for longer and causes fewer adverse effects than other drugs. Vibegron may be considered “good value for money” for patients with OAB.
Introduction
Overactive bladder (OAB), defined as urinary urgency with or without urinary incontinence, affects more than 30 million adults in the United States.Citation1,Citation2 Symptoms of OAB are associated with significant impairment in health-related quality of life (HRQoL) and can contribute to elevated levels of anxiety and depression.Citation3–6 The economic burden of OAB is considerable, with the total cost of OAB in the United States estimated to be $83 billion in 2020.Citation7 Anticholinergic drugs used for the treatment of OAB are associated with increased outpatient physician office visits, emergency department visits, prescriptions, diagnostic tests, hospital admissions, and falls/fractures.Citation8–10
According to the American Urological Association (AUA) and the Society of Urodynamics, Female Pelvic Medicine & Urogenital Reconstruction (SUFU) guidelines, first-line treatment for OAB includes behavioral therapy with or without pharmacologic treatment; oral anticholinergic medications and β3-adrenergic receptor agonists are recommended as second-line therapy.Citation2 Treatment with β3-adrenergic receptor agonists significantly improves symptoms of micturition frequency, urinary incontinence, and urgency compared with placebo while minimizing the risk of bothersome adverse events (AEs) associated with anticholinergic medications.Citation11–14 Vibegron is a selective β3-adrenergic receptor agonist that was recently approved by the US Food and Drug Administration for the treatment of adults with OAB with a recommended once-daily 75-mg dose.Citation15 In the international phase 3 randomized, placebo- and active-controlled EMPOWUR trial, vibegron significantly improved OAB symptoms and HRQoL compared with placebo.Citation14,Citation16 Vibegron may have advantages over oral anticholinergic drugs in terms of reduced anticholinergic burden (ACB) and decreased risk of anticholinergic-associated side effects.Citation14 The current analysis evaluated the cost-effectiveness of vibegron compared with other oral pharmacologic therapies as treatment for OAB from both the US commercial payor and Medicare perspectives.
Methods
Model overview
The cost-effectiveness model was structured as a semi-Markov model capable of supporting a lifetime horizon of vibegron 75 mg from a US commercial payor or Medicare perspective. The baseline population included all adult patients (≥25 years old) with OAB seeking prescription medications. For each OAB treatment used as the first pharmacologic intervention, the model traced a cohort of patients with OAB starting on that treatment through a set of treatment states over time, accumulating costs and quality-adjusted life years (QALYs). The model incorporated efficacy, AEs, OAB-related comorbidities, CYP2D6 drug–drug interactions, ACB, and treatment persistence. Base case assumptions are provided in Supplementary Table S1. The primary cost-effectiveness outcome was the cost per QALY incremental cost-effectiveness ratio (ICER). The cost-effectiveness model also included one-way sensitivity analyses (OWSA) and probabilistic sensitivity analyses (PSA) to allow the examination of the impact of changes in key variables on the cost-effectiveness results.
Model structure
The cost-effectiveness model used a 1-month cycle length and a lifetime horizon (100 years). The modeled population consisted of patients with OAB seeking oral pharmacologic treatments for OAB and involved three lines of treatments: first- and second-line oral pharmacologic treatments and third-line treatments including onabotulinumtoxinA, percutaneous tibial nerve stimulation, and sacral neuromodulation (). As patients progressed through the model they persisted, discontinued, or switched to different treatments and were subject to age- and gender-specific mortality.
Figure 1. Treatment flow diagram for the base case. Abbreviations: OAB, overactive bladder; PTNS, percutaneous tibial nerve stimulation; SNM, sacral neuromodulation.
Treatments
The model iterated through each of the 15 oral pharmacologic treatments, each time starting with a hypothetical cohort specified by the initial demographics and patient characteristics including age, gender, daily micturition frequency, and daily incontinence frequency. Cost-effectiveness of vibegron 75 mg was modeled relative to pharmacologic treatment comparators, which included mirabegron 25 and 50 mg and a basket of anticholinergic medications weighted by their market share (Supplementary Table S2) and consisting of darifenacin 7.5 and 15 mg, fesoterodine 4 and 8 mg, oxybutynin 5 and 10 mg extended release (ER) and 5 mg immediate release (IR), solifenacin 5 and 10 mg, tolterodine 2 and 4 mg, and trospium 60 mg. With the exception of oxybutynin IR, only ER formulations were included in the model owing to tolerability issues associated with IR formulations. Combination regimens (i.e. mirabegron and solifenacin) were also excluded. The hypothetical cohort of OAB patients initiated the treatment and traversed a set of treatment states the patient received over the model horizon.
Base case model inputs
Population
Baseline age and gender distribution of the modeled population – sourced from the March 2019 Current Population Survey’s Annual Social and Economic Supplement by the US Census BureauCitation17 – was derived by multiplying the age and gender distribution of enrollees by the age- and gender-specific OAB prevalence. OAB prevalence was derived from Coyne et al. (2011)Citation1 and Coyne et al. (2013)Citation18 and background mortality was based on the US Life Table.Citation19
Efficacy
Treatment efficacy was defined by two efficacy endpoints that were modeled independently: daily number of micturition episodes and daily number of urinary incontinence episodes, which were modeled based on data at 12 and 52 weeks and as an annual change after 52 weeks (Supplementary Table S3). In the base case, after 52 weeks on treatment, patients were assumed to maintain their treatment efficacy until discontinuation. Data for 12- and 52-week efficacy were sourced from two separate systematic literature reviews and network meta-analyses of randomized controlled trials for OAB undertaken for these analyses in conjunction with model development and represent treatment difference versus placebo (Supplementary Methods, Supplementary Table S4).
Treatment persistence
Treatment discontinuation was modeled based on persistence at 1 month and 12 months using a claims analysis of OAB medication persistence over 12 months in treatment-naive patients who received an OAB prescription medication in 2016, sourced from the IQVIA Longitudinal Patient Prescription database and performed in conjunction with model development (Supplementary Methods; Supplementary Table S3). An analysis of US claims data was used instead of published literature to enable inclusion of market-specific and dose-specific data (i.e. mirabegron 25 and 50 mg) on all comparators collected using consistent methodology. Between 1 month and 12 months, the model derived the monthly discontinuation probability from the 1- and 12-month persistence inputs with the assumption that discontinuation followed a constant hazard rate following the approach used in Wielage et al.Citation20 to realistically represent the high treatment turnover in patients with OAB. Patients who persisted after 12 months were assumed to follow this monthly discontinuation probability, and those who discontinued an initial oral treatment (vibegron, mirabegron, or anticholinergic) either switched to a different oral treatment (mirabegron or anticholinergic), switched to a third-line treatment (onabotulinumtoxinA, percutaneous tibial nerve stimulation, and sacral neuromodulation), or discontinued entirely. Of the patients who did not persist with first- or second-line treatment, the proportions who switch to another treatment or discontinued entirely was based on published claims analyses of OAB medication prescribing patterns (Supplementary Methods; Supplementary Table S3).Citation21,Citation22 Patients who discontinued treatment entirely were assumed to revert to their baseline disease severity level.
Adverse events, comorbidities, and drug–drug interactions
Patients experienced AEs associated with the treatment being simulated, OAB-related comorbidities, potential consequences of ACB, and CYP2D6-related drug–drug interactions. Four AEs were modeled: blurred vision, dry mouth, constipation, and tachycardia (Supplementary Methods; Supplementary Table S3). Hypertension is excluded in the cost-effectiveness model, as the effect of OAB medications on blood pressure appears to be modest and has not translated into an increased risk of cardiovascular morbidity and mortality. Incontinence pad utilization and OAB-related comorbidities were modeled as a function of disease severity; OAB-related comorbidities included depression, urinary tract infection, and skin infections (Supplementary Table S5). ACB-related comorbidities were modeled via increased use of healthcare resources (outpatient and emergency department visits), as well as increased risk of mortality. Because mirabegron is a moderate inhibitor of CYP2D6,Citation23 a proportion of patients taking mirabegron who also use CYP2D6 substrates can incur healthcare resource use (e.g. physician visits, hospitalization) associated with CYP2D6-related drug–drug interactions (Supplementary Methods; Supplementary Table S6). A subset of CYP2D6 substrates also possess anticholinergic properties (e.g. tramadol, paroxetine); therefore, mirabegron can contribute to ACB by increasing systemic exposure to these substrates.Citation23
Costs
Costs were allocated throughout the model based on current treatment (Supplementary Table S7), AEs, OAB-related comorbidities, and ACB (Supplementary Table S8). QALYs were accrued according to age, gender, symptom severity, and mortality experienced throughout the modeling horizon. Utilities were based on a published post hoc analysis, which used data from three randomized controlled trials of mirabegron (Supplementary Table S9).Citation24 The base case excluded indirect costs. Cost-effectiveness results were expected to reflect the present value of the stream of costs and benefits accruing over the time horizon of the analysis. By default, costs and outcomes that occur beyond 1 year were discounted to present values at the US customary rate of 3% per year.Citation25,Citation26 All costs were converted to 2020 US dollars using the medical component of the Consumer Price Index.Citation27
Sensitivity and scenario analyses
OWSAs and PSAs were performed to evaluate the impact of changes in key variables. OWSAs were run with an input variable set to either its low (20% reduction) or high (20% increase) value relative to the base case value, while the remaining variables remain unchanged (Supplementary Table S10). Results of the OWSAs are summarized in tornado diagrams, which are presented in terms of the ICER. PSAs treated input parameters as random variables with a given probability distribution (Supplementary Table S11). Each PSA iteration was sampled from each input distribution simultaneously, and results were based on 1,000 iterations. These randomly generated values were then used as inputs for the model. The average ICER was calculated as the mean of the incremental costs over all PSA iterations divided by the mean incremental QALYs over all PSA iterations. This calculation was used to avoid the scenario in which both incremental costs and incremental QALYs were negative and the scenario in which the incremental QALYs equaled zero. Scenario analyses were performed to assess changes in key input variables; six input variables were explored in 10 scenarios, analyzed from both the commercial payor and Medicare perspectives (Supplementary Table S12).
Results
Base case cost-effectiveness
Cost-effectiveness results for the base case for commercial payors and Medicare are shown in . For commercial payors, vibegron was cost-effective at a willingness-to-pay (WTP) threshold of $50,000/QALY compared with mirabegron 50 mg, with $51 higher incremental costs and 0.005 higher QALYs, leading to an ICER of $9,311. Vibegron was cost-effective at the highest commonly accepted WTP threshold of $150,000/QALY when compared with mirabegron 25 mg (ICER, $141,957), with a higher incremental cost of $723 and higher incremental QALYs of 0.005. Compared with an anticholinergic market basket, vibegron was also cost-effective at a WTP threshold of $150,000/QALY, with an ICER of $118,121. The higher ICERs were primarily driven by small incremental QALYs.
Table 1. Cost-effectiveness results for base case using a lifetime horizon.
For Medicare, vibegron was cost-effective at a WTP threshold of $50,000/QALY compared with mirabegron 50 mg ($111 higher incremental costs and 0.009 higher incremental QALYs; ICER, $12,154) and at a WTP threshold of $100,000/QALY compared with mirabegron 25 mg ($758 higher incremental cost and 0.008 higher incremental QALYs; ICER, $99,150). Vibegron was also cost-effective at the WTP threshold of $100,000/QALY when compared with an anticholinergic market basket (ICER, $60,756). Lower ICERs in the Medicare perspective versus the commercial payor perspective were due to higher incremental QALYs for vibegron in the Medicare population.
One-way sensitivity analyses
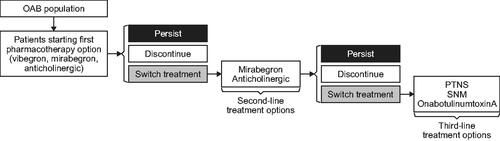
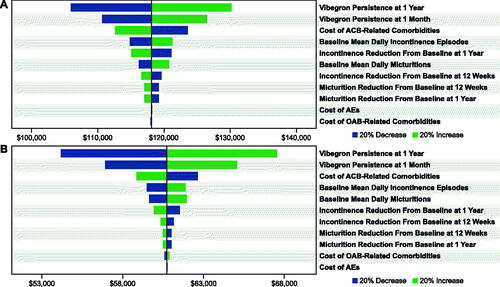
For commercial () and Medicare () payors, OWSAs for vibegron versus mirabegron 25 or 50 mg indicated that cost-effectiveness was most sensitive to vibegron persistence at 1 month and at 12 months. The OWSA results for vibegron versus mirabegron 25 mg additionally showed that, to a lesser extent, cost-effectiveness results for commercial and Medicare payors were sensitive to the baseline mean number of daily urinary incontinence episodes and the change from baseline to 1 year in incontinence episodes with vibegron. When vibegron was compared against a basket of anticholinergic medications, cost-effectiveness results for both commercial and Medicare payors were most sensitive to the persistence of vibegron at 1 month and 12 months, as well as to the cost of ACB-related comorbidities ().
Figure 2. OWSAs for vibegron 75 mg vs (a) mirabegron 25 mg* and (b) mirabegron 50 mg† from the commercial payor perspective. Abbreviations: ACB, anticholinergic burden; AE, adverse event; OAB, overactive bladder; OWSA, one-way sensitivity analysis. * Base case = $141,957. † Base case = $9,311.
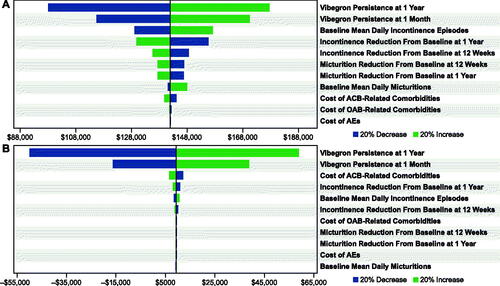
Figure 3. OWSAs for vibegron 75 mg vs (a) mirabegron 25 mg* and (b) mirabegron 50 mg† from the Medicare perspective. Abbreviations: ACB, anticholinergic burden; AE, adverse event; OAB, overactive bladder; OWSA, one-way sensitivity analysis. * Base case = $99,150. † Base case = $12,153.
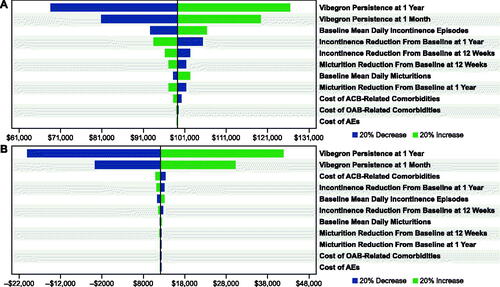
Figure 4. OWSAs for vibegron 75 mg vs an anticholinergic basket from a (a) commercial payor* and (b) Medicare† perspective. Abbreviations: ACB, anticholinergic burden; AE, adverse event; OAB, overactive bladder; OWSA, one-way sensitivity analysis. * Base case = $118,121. † Base case = $60,756.
Probabilistic sensitivity analyses
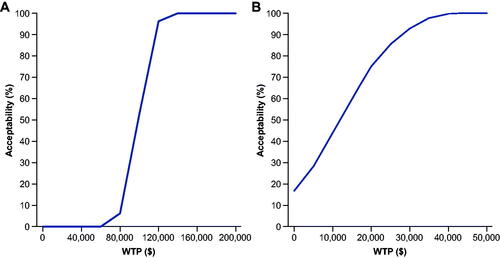
For commercial payors, vibegron was cost-effective versus mirabegron 25 mg >60% of the time at a WTP of $150,000/QALY and versus mirabegron 50 mg 100% of the time at $100,000/QALY and >98% of the time at $50,000/QALY (). Vibegron was cost-effective versus all anticholinergic comparators >99.6% of the time at $150,000/QALY. From a Medicare perspective, vibegron was cost-effective versus mirabegron 25 mg 100% of the time at $150,000/QALY and versus mirabegron 50 mg 100% at $50,000/QALY (). Vibegron was cost-effective against a basket of anticholinergic medications 100% of the time at $100,000/QALY.
Figure 5. Cost-effectiveness acceptability for vibegron vs (a) mirabegron 25 mg and (b) mirabegron 50 mg for commercial payors. Abbreviation: WTP, willingness-to-pay.
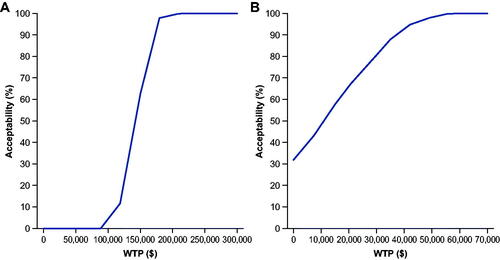
Figure 6. Cost-effectiveness acceptability for vibegron vs (a) mirabegron 25 mg and (b) mirabegron 50 mg for Medicare. Abbreviation: WTP, willingness-to-pay.
Scenario analyses
Scenario analyses indicate that, from commercial payor and Medicare perspectives, most scenarios analyzed led to the same cost-effectiveness conclusions for vibegron using the WTP threshold of $100,000/QALY, with a few exceptions (Supplementary Table S13): the ICER for vibegron versus mirabegron 25 mg and versus an anticholinergic basket moves above and below $100,000/QALY in different scenarios. Cost-effectiveness of vibegron was dependent on the model horizon with shorter time horizons limiting vibegron by not capturing all the long-term benefits.
Discussion
Our analysis showed that vibegron is cost-effective from commercial payor (WTP threshold, $150,000/QALY) and Medicare (WTP threshold, $100,000/QALY) perspectives when compared with other oral pharmacologic treatments for OAB. Vibegron was cost-effective versus both doses of mirabegron but had better cost-effectiveness versus mirabegron 50 mg than with mirabegron 25 mg. Increased cost-effectiveness of vibegron versus mirabegron 50 mg was due to the lower persistence of mirabegron 25 mg, resulting in lower pharmacy costs and, therefore, a higher ICER of vibegron versus mirabegron 25 mg.
Results of this analysis suggest that vibegron has a robust efficacy profile out to 52 weeks, with the model showing the lowest incidence of urinary incontinence episodes and micturitions per day with vibegron, resulting in lower healthcare resource utilization use and costs associated with OAB-related comorbidities over the model horizon. The analysis modeled treatment persistence, discontinuation, and switches and included two lines of oral OAB pharmacologic treatments and third-line treatment options, reflecting real-world treatment pathways. The model also considered ACB and potential CYP2D6-related drug–drug interactions and its indirect impact on ACB.
For both commercial payor and Medicare models, vibegron had the greatest total QALYs but also the highest pharmacy costs and total costs; however, vibegron was associated with the lowest costs of ACB-related comorbidities and AEs, with anticholinergic medications having the highest costs in relation to these factors. Total QALYs were higher in the commercial payor model (22.0) than in the Medicare model (13.4); this was driven primarily by demographic differences, particularly the older age of the Medicare population. Vibegron had the lowest combined ACB and drug–drug interaction burden (due to patients switching to other treatments or subject to lower baseline ACB when on vibegron), resulting in the lowest ACB-related mortality rates and comorbidity costs. As expected, vibegron and mirabegron had lower AE rates compared with anticholinergic medications.
Sensitivity analyses (OWSA) indicated that cost-effectiveness of vibegron was most sensitive to vibegron persistence at 1 month and 12 months. Based on PSA results, vibegron was cost-effective versus mirabegron 50 mg 100% of the time and was cost-effective versus mirabegron 25 mg 62.2% and 100% of the time for commercial payors and Medicare, respectively, at a WTP threshold of $150,000/QALY.
Scenario analyses were conducted using a lifetime horizon for both payor perspectives, except in scenarios in which the model horizon was varied. With a few exceptions, the analyzed scenarios did not change cost-effectiveness results. In alignment with OWSA results suggesting that vibegron persistence most affected cost-effectiveness, increasing vibegron persistence by 10% at both 1 month and 12 months increased ICERs of vibegron versus comparators. Shorter model horizons increased the ICER of vibegron versus comparators due to smaller incremental QALYs accrued. The lifetime horizon used in our base case model more fully captures the QALY impacts associated with differences in mortalities due to ACB that occur while patients are on different treatments. Shorter model horizons also undervalue OAB treatments with less ACB that lead to fewer mortalities. For the purposes of this analysis, the scenarios included represent those with the largest impact on the ICER relative to the base case.
A WTP threshold of $50,000 has traditionally been used for more than two decades; however, more recent publications suggest that a WTP threshold of $100,000 to $150,000 is appropriate.Citation28–30 This threshold reflects the Institute for Clinical and Economic Review’s judgment that the most recent research confirms that WTP paradigms produce estimates of an operational cost-effectiveness threshold at approximately $100,000 per QALY. Because the suggested health-benefit price benchmarks are most often used as ceiling prices, $150,000 is used as a more liberal upper bound; this range is meant to accommodate the needs of decision-makers and to allow interpretation of cost-effectiveness thresholds while considering uncertainty, other benefits or disadvantages, and contextual considerations.Citation31
We presented results for a lifetime model time horizon, consistent with modeling standards explicitly recommended by both the Institute for Clinical and Economic Review and the International Society for Pharmacoeconomics and Outcomes Research for health technology assessment economic evaluations.Citation26,Citation32 A lifetime horizon more fully captures the QALY impacts associated with differences in mortalities due to ACB that occur while patients are on different treatments.
There is also evidence to suggest that the cost-effectiveness results for vibegron in our analysis are conservative. Difference versus placebo (i.e. treatment effect) rather than absolute change from baseline (i.e. absolute effect) was used to model treatment efficacy. This is a conservative assumption that is commonly used in health technology assessment economic evaluations; however, using an absolute change from baseline (i.e. ignoring all trial and placebo effects) would lead to better cost-effectiveness of vibegron versus comparators. The base case assumed that patients who switched treatments would go through two lines of oral pharmacologic treatments before moving to a third-line option. In our model, vibegron is only included as a first-line treatment option; this is another conservative assumption that slightly reduces the costs of second-line treatments for mirabegron 50 mg and decreases the cost-effectiveness of vibegron versus mirabegron 50 mg.
Most recent studies assessing the cost-effectiveness of various OAB treatments have involved assessment of neuromodulation and/or onabotulinumtoxinA over shorter timeframes than our analysis. In general, these analyses reported that onabotulinumtoxinA was more cost-effective versus anticholinergic drugs as first-line therapy (2-year timeframe),Citation33 versus other treatments (neuromodulation, anticholinergic drugs, and mirabegron) for refractory OAB (10-year timeframe),Citation34 and versus sacral neuromodulation (2- and 5-year timeframes).Citation35 A similar cost-effectiveness model to that used in this analysis evaluated the cost-effectiveness of mirabegron versus other treatments (not including vibegron) from US commercial health plan and Medicare perspectives.Citation20 The analysis estimated an ICER for mirabegron of $59,690/QALY and $66,347/QALY from commercial payor and Medicare Advantage perspectives, respectively, compared with tolterodine IR; other anticholinergic medications were dominated. In the analysis of mirabegron, OWSAs were highly sensitive to the cost of mirabegron and the network meta-analysis used to develop probabilities for treatment switching.Citation20 While our model was based on the previous mirabegron analysis, the two models included different inputs and analyses, and therefore a comparison of the results of the two models may not adequately account for these differences.
Our results are limited by cost-effectiveness results, which were impacted by treatment persistence and ACB mortality, with lower persistence and higher mortality enhancing the cost-effectiveness relative to comparators by leading to lower pharmacy costs and lower total costs. As vibegron was recently introduced to the market, there are no real-world data available on market share or on persistence; vibegron was assumed to have the same persistence as mirabegron 50 mg. Long-term efficacy was assumed to be sustained beyond 52 weeks in the absence of clinical trials longer than 52 weeks. There was also a lack of clinical studies directly examining the association between CYP2D6 drug–drug interactions and ACB, resulting in uncertainty in the related model inputs. While the assumption that patients on a third-line treatment do not discontinue their treatment may not be realistic, the model input related to second-line treatment discontinuation was calibrated to assume that a small proportion of patients would initiate a third-line treatment (2.2% per year) to be consistent with the estimate reported in a recent analysis of claims data from a national administrative database.Citation22
Conclusions
Our analysis estimated vibegron to be a cost-effective alternative to mirabegron and other oral pharmacologic treatments for OAB from commercial payor and Medicare perspectives. This was in large part due to decreased healthcare resource utilization and costs associated with lower incidences of incontinence episodes and micturitions per day with vibegron treatment, as well as a lower anticholinergic and drug–drug interaction burden.
Transparency
Declaration of funding
Funding for this study and for medical writing and editorial support was provided by Urovant Sciences (Irvine, CA).
Declaration of financial/other interests
JVC was an employee of Medical Decision Modeling Inc., a contract research company that performed the outcomes research described, at the time the work was conducted. TMK is an employee of Medical Decision Modeling. JN is an employee of Urovant Sciences. PNM was an employee of Urovant Sciences at the time the work was conducted.
Author contributions
All authors contributed to the study design, data analysis, and interpretation; revision of the manuscript for critically important content; and are responsible for the final approval of the manuscript for submission.
Reviewer disclosures
A reviewer on this manuscript has disclosed that they have received a speaker fee from Urovant Sciences. The other peer reviewers on this manuscript have no other relevant financial relationships or otherwise to disclose.
Previous presentations
Presented in part at the Virtual International Society for Pharmacoeconomics and Outcomes Research meeting (ISPOR 2021), 17–21 May 2021.
Supplemental Material
Download MS Word (199.4 KB)Acknowledgements
Medical writing and editorial assistance was provided by Rick Davis, MS, RPh, for and Krystina Neuman, PhD, CMPP, of The Curry Rockefeller Group, LLC (Tarrytown, NY), and was funded by Urovant Sciences.
References
- Coyne KS, Sexton CC, Vats V, et al. National community prevalence of overactive bladder in the United States stratified by sex and age. Urology. 2011;77(5):1081–1087.
- Gormley EA, Lightner DJ, Burgio KL, et al. Diagnosis and treatment of overactive bladder (non-neurogenic) in adults: AUA/SUFU guideline. Linthicum (MD): American Urological Association; 2019.
- Coyne KS, Payne C, Bhattacharyya SK, et al. The impact of urinary urgency and frequency on health-related quality of life in overactive bladder: results from a national community survey. Value Health. 2004;7(4):455–463.
- Coyne KS, Sexton CC, Kopp ZS, et al. The impact of overactive bladder on mental health, work productivity and health-related quality of life in the UK and Sweden: results from EpiLUTS. BJU Int. 2011;108(9):1459–1471.
- Johnston KM, Walker DR, Lakzadeh P. Characterizing the health-related quality of life burden of overactive bladder using disease-specific patient-reported outcome measures: a systematic literature review. Adv Ther. 2019;36(3):548–562.
- Milsom I, Kaplan SA, Coyne KS, et al. Effect of bothersome overactive bladder symptoms on health-related quality of life, anxiety, depression, and treatment seeking in the United States: results from EpiLUTS. Urology. 2012;80(1):90–96.
- Coyne KS, Wein A, Nicholson S, et al. Economic burden of urgency urinary incontinence in the United States: a systematic review. J Manag Care Pharm. 2014;20(2):130–140.
- Yehoshua A, Chancellor M, Vasavada S, et al. Health resource utilization and cost for patients with incontinent overactive bladder treated with anticholinergics. J Manag Care Spec Pharm. 2016;22(4):406–413.
- Szabo SM, Gooch K, Schermer C, et al. Association between cumulative anticholinergic burden and falls and fractures in patients with overactive bladder: US-based retrospective cohort study. BMJ Open. 2019;9(5):e026391.
- Stefanacci RG, Yeaw J, Shah D, et al. Overactive bladder health care burden in the US long-term care setting: a retrospective cohort study. J Clin Pathways. 2021;7(4):34–42.
- Kelleher C, Hakimi Z, Zur R, et al. Efficacy and tolerability of mirabegron compared with antimuscarinic monotherapy or combination therapies for overactive bladder: a systematic review and network meta-analysis. Eur Urol. 2018;74(3):324–333.
- Mitcheson HD, Samanta S, Muldowney K, et al. Vibegron (RVT-901/MK-4618/KRP-114V) administered once daily as monotherapy or concomitantly with tolterodine in patients with an overactive bladder: a multicenter, phase IIb, randomized, double-blind, controlled trial. Eur Urol. 2019;75(2):274–282.
- Nitti VW, Auerbach S, Martin N, et al. Results of a randomized phase III trial of mirabegron in patients with overactive bladder. J Urol. 2013;189(4):1388–1395.
- Staskin D, Frankel J, Varano S, et al. International phase III, randomized, double-blind, placebo and active controlled study to evaluate the safety and efficacy of vibegron in patients with symptoms of overactive bladder: EMPOWUR. J Urol. 2020;204(2):316–324.
- Urovant Sciences. GEMTESA® (vibegron). Irvine (CA); 2020.
- Frankel J, Varano S, Staskin D, et al. Vibegron improves quality-of-life measures in patients with overactive bladder: patient-reported outcomes from the EMPOWUR study. Int J Clin Pract. 2021;75(5):e13937.
- US Census Bureau Population Division. Current population survey, annual social and economic supplement. [updated 2019 March; cited 2020 Apr 6]. Available from: https://data.census.gov/mdat/#/.
- Coyne KS, Sexton CC, Bell JA, et al. The prevalence of lower urinary tract symptoms (LUTS) and overactive bladder (OAB) by racial/ethnic group and age: results from OAB-POLL. Neurourol Urodyn. 2013;32(3):230–237.
- Arias E, Xu J. National vital statistics report: United States life tables, 2017. Hyattsville (MD): National Center for Health Statistics; 2019.
- Wielage RC, Perk S, Campbell NL, et al. Mirabegron for the treatment of overactive bladder: cost-effectiveness from US commercial health-plan and Medicare Advantage perspectives. J Med Econ. 2016;19(12):1135–1143.
- Anger JT, Goldman HB, Luo X, et al. Patterns of medical management of overactive bladder (OAB) and benign prostatic hyperplasia (BPH) in the United States. Neurourol Urodyn. 2018;37(1):213–222.
- Linder BJ, Gebhart JB, Elliott DS, et al. National patterns of filled prescriptions and third-line treatment utilization for privately insured women with overactive bladder. Female Pelvic Med Reconstr Surg. 2021;27(2):e261–e266.
- Astellas Pharma US Inc. MYRBETRIQ® (mirabegron extended-release tablets). Northbrook (IL); 2018.
- Desroziers K, Aballéa S, Maman K, et al. Estimating EQ-5D and OAB-5D health state utilities for patients with overactive bladder. Health Qual Life Outcomes. 2013;11(1):200.
- Sanders GD, Neumann PJ, Basu A, et al. Recommendations for conduct, methodological practices, and reporting of cost-effectiveness analyses: second panel on cost-effectiveness in health and medicine. JAMA. 2016;316(10):1093–1103.
- Institute for Clinical and Economic Review. ICER’s reference case for economic evaluations: principles and rationale. [updated 2020 Jan 31].
- US Department of Labor. CPI Inflation Calculator—Medical Care Component: medical care in U.S. city average, all urban consumers, seasonally adjusted. 2020 [cited 2020 June 22]. Available from: https://beta.bls.gov/dataViewer/view/timeseries/CUSR0000SAM
- Bridges JF, Onukwugha E, Mullins CD. Healthcare rationing by proxy: cost-effectiveness analysis and the misuse of the $50,000 threshold in the US. Pharmacoeconomics. 2010;28(3):175–184.
- Grosse SD. Assessing cost-effectiveness in healthcare: history of the $50,000 per QALY threshold. Expert Rev Pharmacoecon Outcomes Res. 2008;8(2):165–178.
- Neumann PJ, Cohen JT, Weinstein MC. Updating cost-effectiveness–the curious resilience of the $50,000-per-QALY threshold. N Engl J Med. 2014;371(9):796–797.
- Institute for Clinical and Economic Review. 2020–2023 Value assessment framework. 2020. [cited 2021 April 21]. Available from: https://icer.org/our-approach/methods-process/value-assessment-framework/.
- Roberts M, Russell LB, Paltiel AD, et al. Conceptualizing a model: a report of the ISPOR-SMDM Modeling Good Research Practices Task Force-2. Value Health. 2012;15(6):804–811.
- Shepherd JP, Carter-Brooks CM, Chermanksy C. A cost-effectiveness analysis of onabotulinumtoxin A as first-line treatment for overactive bladder. Int Urogynecol J. 2018;29(8):1213–1219.
- Murray B, Hessami SH, Gultyaev D, et al. Cost-effectiveness of overactive bladder treatments: from the US payer perspective. J Comp Eff Res. 2019;8(1):61–71.
- Harvie HS, Amundsen CL, Neuwahl SJ, et al. Cost-effectiveness of sacral neuromodulation versus onabotulinumtoxinA for refractory urgency urinary incontinence: Results of the ROSETTA randomized trial. J Urol. 2020;203(5):969–977.