
 ?Mathematical formulae have been encoded as MathML and are displayed in this HTML version using MathJax in order to improve their display. Uncheck the box to turn MathJax off. This feature requires Javascript. Click on a formula to zoom.
Abstract
Background
Galcanezumab (GMB) improved quality-of-life and reduced disability of patients with episodic (EM) and chronic migraine (CM) in Phase 3 trials.
Aim
To estimate indirect cost savings associated with GMB treatment in patients with migraine in the United States (US).
Methods
We analyzed data of patients from the US from three randomized, Phase 3, double-blind, placebo (PBO)-controlled GMB studies: EVOLVE-1 and EVOLVE-2 (EM patients), REGAIN (CM patients). Annual indirect costs were calculated using items of the Migraine Disability Assessment (MIDAS) questionnaire: lost time/productivity at work/school, household work, and leisure time. All costs were annualized and expressed in 2019 US dollars. While the main analysis considered lost time/productivity at work/school and household work as a full day, a sensitivity analysis was performed by discounting them by half. For EM, annual indirect costs savings were estimated using mixed model repeated measures analysis. For CM, ANCOVA models were used to estimate annual indirect costs savings as change from baseline.
Results
The analysis included 805 patients with EM (mean age = 41.4 years; PBO = 534; GMB = 271) and 423 patients with CM (mean age = 38.9 years; PBO = 279; GMB = 144). Compared to PBO, GMB significantly reduced annual indirect costs among patients with EM at 3 months (least square mean [95% confidence interval] work/school = $1,883.6 [603.64–3,163.65], p = .0040, household work = $628.9 [352.95–904.88], p <.0001, and leisure activity = $499.17 [42.36–955.98], p = .0323) and 6 months (work/school = $2,382.29 [1,065.48–3,699.10], p = .0004, household work = $559.45 [268.99–849.90], p = .0002, and leisure activity = $753.81 [334.35–1,173.27], p = .0004), whereas a significant difference was not observed among patients with CM. Sensitivity analysis results were similar to primary analysis results.
Conclusions
GMB treatment versus PBO resulted in significantly greater indirect cost savings in patients with EM through improved productivity at work/school, household work, and leisure days. Patients with CM receiving GMB versus PBO attained greater cost savings, although not statistically significant, through reduced lost productivity at work/school.
Plain language summary
Migraine causes missed time or reduced productivity at home and work, which further imposes an economic burden on patients, referred to as indirect costs. In this study, we evaluated the indirect cost savings in patients with episodic or chronic migraine taking either galcanezumab or placebo for treatment. We collected data using a questionnaire called the Migraine Disability Assessment (MIDAS) that was completed by patients enrolled in three clinical studies in the United States (US), namely EVOLVE-1, EVOVLE-2 (episodic migraine patients), and REGAIN (chronic migraine patients). The MIDAS questionnaire evaluated time lost/reduced productivity at work/school, household work, and leisure activity in patients with episodic or chronic migraine. Using scores of the MIDAS questionnaire and standard annual wages for the US population, we calculated indirect costs in patients. A total of 805 patients with episodic migraine and 423 patients with chronic migraine were included in this study. In galcanezumab-treated patients with episodic migraine, a significant indirect cost saving was observed through decrease in time lost/reduced productivity at work/school, household work, and leisure activity compared with patients who received placebo. In galcanezumab-treated patients with chronic migraine, indirect cost saving observed through decrease in time lost/reduced productivity at work/school were not statistically different from placebo-treated patients. The relatively lower cost savings observed in patients with chronic migraine may be due to greater disease burden compared to patients with episodic migraine. Results of this study suggest that patients with migraine receiving galcanezumab may obtain indirect cost savings.
Introduction
Migraine is associated with functional impairment and reduced health-related quality-of-life (HRQoL), which in turn negatively affects productivity at the workplaceCitation1,Citation2. Patients with frequent migraine attacks (≥15 migraine headache days/month) experience more work productivity loss than patients with less frequent migraine attacksCitation3. In a real-world study in the United States (US), patients with migraine with ≥4 monthly migraine headache days had over 40% of mean overall work impairment due to migraineCitation4. Overall work impairment associated with migraine at the workplace is because of either missed work days (absenteeism) or decreased work efficiency (presenteeism)Citation4.
The migraine impact model projected that 60,000–686,000 annual workdays were lost in the US because of migraine; with annual indirect costs being 6.2–8.5-times greater than the annual direct costsCitation5. Annual total cost (healthcare resource plus lost productivity costs) associated with migraine in the US was $36 billion in 2016Citation6. In another study, annual indirect per person costs (2014 US dollar [USD]) in patients with migraine were $2,350 higher than in patients without migraineCitation6. In addition to the impact on productivity at the workplace, patients with migraine also have reduced productivity in household work and decreased leisure time, which further contributes to indirect costsCitation6–9.
Effective treatments with favorable efficacy-safety profiles may reduce healthcare costs for patients with migraineCitation10. Galcanezumab (GMB), a calcitonin gene-related peptide monoclonal antibody (CGRP mAb), was approved in the US in 2018 for the preventive treatment of episodic (EM) and chronic migraine (CM) in adultsCitation11. GMB demonstrated greater efficacy and safety compared with placebo (PBO) in clinical studies including patients with EM, CM, or in patients with previous failure of two-to-four migraine preventive medication categoriesCitation12–15. Other clinical studies have also demonstrated efficacy of GMB in significantly improving HRQoL and reducing disability compared with PBOCitation16,Citation17.
Migraine-related disability can be measured using the Migraine Disability Assessment (MIDAS), a self-administered questionnaire; MIDAS scores can be used to calculate indirect costs in patients with migraineCitation18. A prior post-hoc analysis conducted using four multi-country Phase 3 studies estimated the annual indirect cost savings derived from MIDAS scores and annual wage information among patients receiving GMB in a global setupCitation19. However, no study has been conducted to specifically estimate the indirect cost savings following GMB treatment in the US population.
This post-hoc analysis of three Phase 3 clinical studies estimated the annual indirect cost savings associated with reduced absence or productivity loss at work or school, household work, and leisure/social activities following treatment with GMB or PBO in patients with EM (savings at 3 and 6 months vs. baseline) or CM (savings at 3 months vs. baseline) from the USCitation12,Citation13,Citation16. In addition, indirect cost savings for GMB vs. PBO, and indirect cost savings for GMB vs. PBO among employed patients with CM were also estimated. A sensitivity analysis was also performed to support the findings of our results.
Methods
Study design
This was a post-hoc analysis of three Phase 3, double-blind (DB), PBO-controlled, randomized studies of GMB in patients with EM or CM: EVOLVE-1 (EM; NCT02614183), EVOLVE-2 (EM; NCT02614196), and REGAIN (CM; NCT02614261)Citation12–14. Details of study design and inclusion/exclusion criteria have been published previouslyCitation12–14. This analysis included 6 months DB period data from EVOLVE-1 and EVOLVE-2, and 3 months DB period data from REGAIN. The 6 months data was not available for patients with CM. These studies were conducted at different sites in North America, South America, Europe, and Asia; however, the current analysis only includes results from the US.
Patient population
This post-hoc analysis included intent-to-treat US patients with EM from EVOLVE-1 and EVOLVE-2 studiesCitation12,Citation13 and US patients with CM from the REGAIN studyCitation14. EM and CM were defined as per International Classification of Headache Disorders, 3rd edition, beta version (ICHD-3 beta) guidelinesCitation20. EM was defined as not meeting the criteria for CM and having ≥4 migraine headache days. CM was defined as ≥15 headache days/month, of which ≥8 were migraine. Patients included in the analysis received either GMB (240 mg loading dose and 120 mg monthly dose) or PBO, with a baseline and ≥1 post-baseline MIDAS measure.
This research was conducted with anonymized data from the clinical studiesCitation12–14 and did not require a separate institutional review board approval. The clinical studies included in this analysis were conducted in accordance with the Declaration of Helsinki, the International Conference on Harmonisation Guidelines for Good Clinical Practice, and applicable local regulations. Ethics committees at all participating centers approved the protocol, and all patients provided written informed consent.
MIDAS questionnaire
The MIDAS consists of five questions to measure the impact of migraine on the patient’s life over a period of 3 months. The impact is measured in terms of the number of days of reduced productivity. The questions include number of days of work/school missed (Q1), days with productivity at work/school reduced by half or more (Q2), days of household work missed (Q3), days with productivity in household work reduced by half or more (Q4), and days of leisure activities missed (Q5). Scores for each of Q1 + Q2, Q3 + Q4, and Q5 range from 0–90. Patients with higher total scores on MIDAS (range: 0–270) have greater disabilityCitation21.
Employment status and wages
Employment status was collected only for the REGAIN study by clinical site personnel through direct questioning of patients on their employment status. Annual wages in USD for the US population were obtained from the World Economic Outlook Database. The average annual wage in 2019 was $65,111.60, which was used to determine the mean hourly wage rate ($65,111.6/(52*40) = $31.30 per hour) of family, social, and leisure activityCitation22. Hourly wages in USD for household work were captured from the Bureau of Labor Statistics. Mean hourly wages were calculated for each of the following household work categories – household activities and caring for helping household members. The average hourly wage for household activities was derived by averaging the hourly wages for the five subcategories, including maids and housekeeping cleaners; cooks; private household; dishwashers; maintenance and repair workers; and grounds maintenance workers. The average hourly wage for caring for and helping household members were derived by averaging the hourly wages for the childcare workers and home health and personal care aides.
Annual indirect costs evaluation
Indirect costs with GMB and PBO in all patients and in employed patients due to loss of work/school (in USD) at baseline, 3 months, and 6 months were calculated by multiplying annual wage in USD in 2019 by (Q1 + Q2)/60, assuming 60 working days in 3 monthsCitation23. Indirect costs due to loss of household work were first calculated for the duration of 3 months; the indirect costs were annualized by multiplying by 4. For each household work category (household activities, and caring for and helping household members), indirect costs were calculated by multiplying mean hourly wage by average number of hours per day and (Q3 + Q4). Average daily hours spent on each category by sex (for civilian population in 2019) was obtained from the American Time Use Survey from the Bureau of Labor and StatisticsCitation24. Finally, indirect costs of each category were summed up to get total indirect costs due to loss of productivity in household work. Household work included maids and housekeeping cleaners; cooks (private household); dishwashers; maintenance and repair workers; and grounds maintenance workers. Caring for and helping household members included childcare workers and home health and personal care aides. Annual indirect costs due to loss of leisure activities (including family, social or leisure) was calculated by multiplying mean hourly wage by average hours spent on leisure activities per day and Q5; it was annualized by multiplying by 4. Annual indirect cost savings (change from baseline to 3 and 6 months in annual indirect costs) were analyzed.
Statistical analyses
The intent-to-treatment (ITT) population included all US patients in the GMB or PBO arm who received at least one dose of the study drug and had a MIDAS measurement at baseline and at least one post-baseline measurement of MIDAS. Post-hoc power was not calculated for this analysis because calculating power using the observed effect size from a completed study is misguided for reasons laid out by several published studiesCitation25,Citation26. Also, reporting post-hoc power is nothing more than reporting the p-value in a different way as the observed significance level of a test also determines the observed powerCitation27. Descriptive analyses were conducted for patient demographic variables and baseline characteristics. Continuous variables were summarized using mean with standard deviations, and medians with interquartile range. Categorical variables were summarized using frequency counts and percentages. ANOVA and Fisher’s exact test were used to compare treatment groups (GMB vs. PBO and ITT population vs. study population) for continuous data and categorical data, respectively. For pooled data from EVOLVE-1 and EVOLVE-2, there were two post-baseline indirect costs which were derived from MIDAS scores at 3 months and 6 months visits during the 6 months double-blind period. Therefore, the change from baseline to 3 and 6 months in indirect costs were analyzed using a mixed model repeated measures (MMRM) analysis. The MMRM included the fixed, categorical effects of treatment, study ID, month, treatment-by-month interaction, age, sex, number of comorbidities, and baseline migraine headache day frequency category, as well as the continuous, fixed covariates of baseline value of indirect cost and baseline value-by-month interaction. The baseline value and baseline-by-month interaction were included to account for the differential influence over time that the baseline value has on the post-baseline values. For REGAIN, there was only one post-baseline measurement for MIDAS which indirect costs was calculated from. Therefore, the change in indirect costs from baseline to 3 months was analyzed using an analysis of covariance (ANCOVA) model with the last observation carried forward (LOCF) imputation. The ANCOVA model included the fixed categorical effects of treatment, age, sex, number of comorbidities, baseline medication overuse (yes/no), and concomitant prophylaxis use (yes/no), as well as the continuous fixed covariates of baseline value of the annual indirect costs. The analyses were repeated among employed patients with CM. Additionally, correlation between change in indirect costs for work/school vs. change in number of monthly migraine headache days (primary efficacy endpoint in EVOLVE and REGAIN trials) for overall population and by treatment groups from baseline to month 6 in patients with EM and from baseline to 3 months in patients with CM were visualized using scatterplots.
Sensitivity analysis was performed by repeating the primary analysis, however, given that reduced productivity may not have occurred over the entire day, the lost productivity at work/school and household work was valued by at least half (0.5) and calculated using the following equations,
Indirect costs due to loss of productivity in household work were first calculated for the duration of 3 months; the indirect costs were annualized by multiplying by 4. For each household work category, indirect costs were calculated by multiplying mean hourly wage by average number of hours per day and (Q3 + 0.5Q4). Finally, indirect costs of each category were summed up to get total indirect costs due to loss of productivity in household work.
The 95% confidence intervals (CI) for the least square mean (LSM) and difference between GMB and PBO were calculated.
Treatment effects were evaluated with a 2-sided significance level of 0.05 for all analyses. All statistical analyses were performed using SAS software Version 9.4.
Results
Baseline demographics and clinical characteristics
In this post-hoc analysis, 1,228 patients were included, out of which 805 (65.6%) patients had EM (mean age 41.5 ± 11.6 years), and 423 (34.4%) patients had CM (mean age 38.9 ± 11.8 years). More than 80% of patients with EM or CM were females. Mean monthly migraine headache days for patients with EM and CM were 9.2 ± 3.0 days and 19.4 ± 4.3 days, respectively. Among patients with EM, 271 and 534 patients received GMB or PBO, respectively, while among patients with CM, 144 and 279 patients received GMB or PBO, respectively (). At baseline, mean MIDAS scores for each item score (Q1–Q5) and total scores were similar (p >.05) between GMB- and PBO-treated patients with EM and CM. At baseline, mean (SD) MIDAS total score was numerically higher among patients with CM (in overall population = 65.7 [48.3]) than patients with EM (in overall population = 34.1 [27.5]). The mean (SD) MIDAS total score decreased in patients with EM at 3 months to 17.1 (22.2) and 6 months to 15.5 (21.0) (Supplementary Table S2). In patients with CM, mean (SD) MIDAS total score at 3 months decreased to 44.3 (46.3) (Supplementary Table S3). Baseline characteristics between patients included in the present study vs. the full ITT populations were similar (Supplementary Table S1).
Table 1. Demographics and clinical characteristics – patients with episodic or chronic migraine.
Indirect cost savings with GMB versus PBO – EM or CM at 3 and 6 months
The results shown below were from MMRM analysis. All MMRM models were converged with an unstructured covariance structure.
Indirect cost savings with GMB versus PBO – EM at 3 months
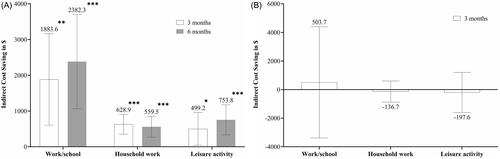
For work/school, indirect cost savings for patients with EM at 3 months were LSM [95% CI] = $5,790.4 [4,611.4–6,969.4], p <.0001 in the GMB group and $3,906.8 [2,979.9–4,833.6], p <.0001 in the PBO group (difference: $1,883.6 [603.6–3,163.7], p = .004). Similarly, for household work indirect cost savings were LSM [95% CI] = $2,198.4 [1,943.0–2,453.8], p <.0001 in the GMB group and $1,569.5 [1,366.7–1,772.2], p <.0001 in the placebo group (difference: $628.9 [353.0–904.9], p <.0001). For leisure activity, indirect cost savings were LSM [95% CI] = $2,091.4 [1,677.0–2,505.9], p <.0001 in the GMB group and $1,592.3 [1,269.2–1,915.4], p <.0001 in the placebo group (difference: $499.2 [42.4–956.0], p = .0323) ( and ).
Figure 1. Indirect cost savings with GMB and PBO from baseline. (a) Indirect cost savings in GMB among patients with EM; (b) Indirect cost savings in PBO among patients with EM; (c) Indirect cost saving in GMB among patients with CM; (d) Indirect cost saving in PBO among patients with CM. All data are presented as LSM change difference (95% CI). There are no 6 months data available for patients with CM. MMRM model: indirect cost change = treatment + study ID + month + treatment-by-month interaction + age + sex + number of comorbidities + baseline migraine headache day frequency category + baseline value + baseline value-by-month interaction. ANCOVA model: treatment + age + sex + number of comorbidities + baseline medication overuse (yes/no) + concomitant prophylaxis use (yes/no) + baseline value. Abbreviations. ANCOVA, Analysis of covariance; CI, Confidence interval; CM, Chronic migraine; EM, Episodic migraine; GMB, Galcanezumab; LSM, Least square mean; MMRM, Mixed model repeated measures; $, United States dollar. *** p < .001.
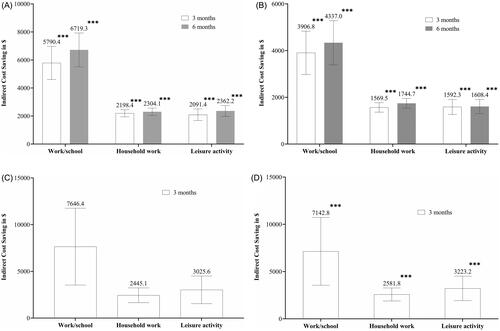
Figure 2. Indirect cost savings difference between GMB versus PBO. (a) Indirect cost savings at 3 months; (b) Indirect cost savings at 6 months. All data is presented as LSM (95% CI). There are no 6 months data available for patients with CM. MMRM model: indirect cost change = treatment + study ID + month + treatment-by-month interaction + age + sex + number of comorbidities + baseline migraine headache day frequency category + baseline value + baseline value-by-month interaction. ANCOVA model: treatment + age + sex + number of comorbidities + baseline medication overuse (yes/no) + concomitant prophylaxis use. Abbreviations. ANCOVA, Analysis of covariance; CI, Confidence interval; CM, Chronic migraine; EM, Episodic migraine; GMB, Galcanezumab; LSM, Least square mean; MMRM, Mixed model repeated measures; PBO, Placebo; $, United States dollar. * p < .05; ** p < .01; *** p < .001.
Indirect cost savings with GMB versus PBO – EM at 6 months
For school/work, indirect cost savings for patients with EM at 6 months were LSM [95% CI] $6,719.3 [5,514.8–7,923.9], p <.0001 in the GMB group and $4,337.0 [3,395.0–5,279.1], p <.0001 in the placebo group (difference: $2,382.3 [1,065.5–3,699.1], p = .0004). Similarly, for household work, indirect cost savings were LSM [95% CI] = $2,304.1 [2,038.7–2,569.6], p <.0001 in the GMB group and $1,744.7 [1,535.7–1,953.6], p <.0001 in the placebo group (difference: $559.5 [269.0–849.9], p = .0002). For leisure activity, indirect cost savings were LSM [95% CI] = $2,362.2 [1,975.0–2,749.4], p <.0001 in the GMB group and $1,608.4 [1,303.9–1,912.9], p <.0001 in the placebo group (difference: $753.8 [334.4–1,173.3], p = .0004) ( and ).
Indirect cost savings with GMB versus PBO – CM at 3 months
For work/school, indirect cost savings in patients with CM at 3 months were LSM [95% CI] = $7,646.4 [3,536.5–11,756.3], p = .0003 in the GMB group and $7,142.8 [3,554.7–10,730.9], p = .0001 in the placebo group (difference: $503.7 [−3,387.6–4,394.9], p = .7993). Similarly, for household work, indirect cost savings were LSM [95% CI] = $2,445.1 [1,653.7–3,236.4], p <.0001 in the GMB group and $2,581.8 [1,892.1–3,271.4], p <.0001 in the placebo group (difference: −$136.7 [−875.8–602.4], p = .7163). For leisure activity, indirect cost savings were LSM [95% CI] = $3,025.6 [1,547.2–4,503.9], p <.0001 in the GMB group and $3,223.2 [1,929.6–4,516.8], p <.0001 in the placebo group (difference: −$197.6 [−1,597.2–1,202.0], p = .7814) ( and ).
Indirect cost savings with GMB vs PBO at 3 months – CM (in employed patients)
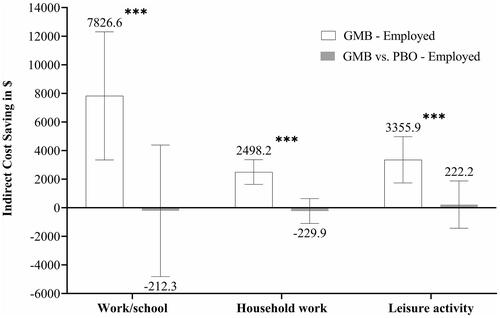
Treatment with GMB showed significantly greater indirect cost savings among employed patients at 3 months (LSM [95% CI] = $7,826.6 [3,343.1–12,310.1], p = .0007 for work/school, $2,498.2 [1,637.7, 3,358.7], p <.0001 for household work, and $3,355.9 [1,738.1–4,973.7], p < .0001 for leisure activity). Compared with PBO, treatment with GMB did not demonstrate significant difference in indirect cost savings (LSM [95% CI] = −$212.3 [−4,810.0–4,385.4], p = .9277 for work/school, −$229.9 [−1,096.6–636.8], p = .6022 for household work, and $222.2 [−1,433.1–1,877.5], p = .7920 for leisure activity) ().
Figure 3. Indirect cost savings difference between GMB versus PBO (in employed patients). All data is presented as LSM (95% CI). There are no 6 months data available for patients with CM. MMRM model: indirect cost change = treatment + study ID + month + treatment-by-month interaction + age + sex + number of comorbidities + baseline migraine headache day frequency category + baseline value + baseline value-by-month interaction. Abbreviations. ANCOVA, Analysis of covariance; CI, Confidence interval; CM, Chronic migraine; EM, Episodic migraine; GMB, Galcanezumab; LSM, Least square mean; MMRM, Mixed model repeated measures; PBO, Placebo; $, United States dollar. *** p < .001.
Correlation between indirect costs and migraine headache days
The primary efficacy endpoint was the overall mean change in the number of monthly migraine headache days from baseline in the EVOLVE and REGAIN trials. Correlation between comparison of change in indirect costs for work/school vs. change in number of monthly migraine headache days for overall population and by treatment groups from baseline to month 6 in patients with EM and from baseline to 3 months in patients with CM was statistically significant (Supplementary Figure S1).
Indirect cost savings with GMB – EM and CM at 3 and 6 months (sensitivity analysis)
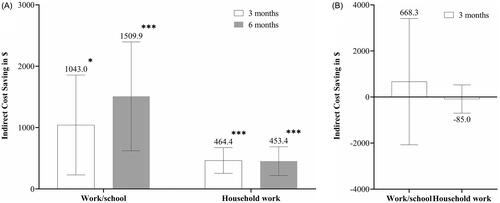
When the lost productivity at work/school and household work was valued by at least half (0.5), indirect cost savings with GMB were significant in patients with EM at 3 months (LSM (95% CI) = $1,043.0 [229.0–1,856.9], p = .0121 for work/school and $464.4 [254.7–674.1], p <.0001 for household work) and at 6 months ($1,509.9 [623.1–2,396.8], p = .0009 for work/school and $453.4 [219.1–687.6], p = .0002 for household work) (). At 3 months, indirect cost savings for patients with CM did not reach statistical significance (LSM [95% CI] = $668.3 [−2,073.3–3,409.9], p = .6320 for work/school and −$85.0 [−699.1–529.0], p = .7856 for household work) ().
Figure 4. Indirect cost savings difference between GMB – sensitivity analysis. (a) Indirect cost savings between GMB versus PBO at 3 months; (b) Indirect cost savings between GMB versus PBO at 6 months. All data is presented as LSM difference (95% CI). There are no 6 months data available for patients with CM. MMRM model: indirect cost change = treatment + study ID + month + treatment-by-month interaction + age + sex + number of comorbidities + baseline migraine headache day frequency category + baseline value + baseline value-by-month interaction. ANCOVA model: treatment + age + sex + number of comorbidities + baseline medication overuse (yes/no) + concomitant prophylaxis use. Abbreviations. ANCOVA, Analysis of covariance; CI, Confidence interval; CM, Chronic migraine; EM, Episodic migraine; GMB, Galcanezumab; LSM, Least square mean; MMRM, Mixed model repeated measures; PBO, Placebo; $, United States dollar. *p < .05; ***p < .001.
Discussion
The results of this post-hoc analysis of three Phase 3 studies suggest that patients with EM treated with GMB had significantly greater indirect cost savings at 3 and 6 months compared with baseline and with those receiving PBO. Indirect cost savings were achieved through reductions in missed days and loss of productivity at work/school, missed days, and loss of productivity at household work, and missed leisure days. Patients with CM treated with GMB also had significant indirect cost saving at 3 months compared with baseline. Among patients with CM treated with GMB versus PBO, although the indirect cost saving was numerically greater for missed days and loss of productivity at work/school, it did not achieve statistical significance. Employed patients with CM treated with GMB had significant annual indirect cost savings from baseline; however, the indirect cost saving was not statistically significant compared with that for patients receiving PBO.
Previous studies have demonstrated significant direct cost savings among patients with migraine receiving preventive therapies including CGRP mAbsCitation28–30. However, indirect cost saving analysis among patients with migraine, treated with GMB, was not conducted before in the US population; hence this study is important in understanding the impact of GMB on indirect costs in US patients with EM and CM. To estimate indirect costs, previous studies have measured days lost due to migraine using administrative records of workplace absence, short-term or long-term disability, and/or workers’ compensationCitation31,Citation32. For this analysis, MIDAS, a validated and reliable patient-reported measure, was used to estimate annual indirect cost savings. MIDAS is also correlated with clinical judgment regarding the need for medical careCitation33.
In addition to headaches, up to 80% of patients with migraine experience symptoms such as fatigue, irritability, difficulty concentrating, stiff neck, photophobia, phonophobia, and nausea, which substantially reduce work productivityCitation34. Decreased work productivity at the workplace because of migraine in the US resulted in an estimated $12 billion in annual indirect costs (all costs inflated to the 2019 dollar value and excluding presenteeism)Citation32. Previous studies conducted suggest that indirect costs of migraine, due to absenteeism and presenteeism, in the US are much higher than direct costsCitation35,Citation36. Hence, understanding the indirect cost savings associated with GMB is important. Treatment with CGRP preventive treatments may decrease indirect costs by lowering the incidents of absenteeism and presenteeismCitation37,Citation38. In the current study, preventive treatment with GMB resulted in significant indirect cost savings by reductions in lost days/productivity at work/school, household work, and leisure activity among patients with EM and CM.
According to a validation study, a day of absenteeism and ≥50% reduction of productivity in a day are weighted equal in MIDAS scoringCitation39. In the current study, a sensitivity analysis was conducted with a similar assumption that a reduced productivity day is equivalent to only half a day of work loss. With 0.5 for presenteeism we demonstrated significant indirect cost savings in patients with EM (p <.001). The results of the sensitivity analysis were similar to those of the primary analysis. These results are consistent with the findings of sensitivity analysis conducted in a prior indirect cost assessment studyCitation19.
Indirect costs incurred because of decreased productivity are significant, particularly in patients who are employed because of the impact on the individual, healthcare system, and employerCitation40,Citation41. In another analysis conducted in a global population, patients treated with GMB had significantly greater indirect cost savings from baseline among employed patients with CM (international dollar = 5,521; 95% confidence interval = 2,058–8,984; p = .0018)Citation19. Similarly, in the present study, employed patients with CM who had received GMB had a significant indirect cost savings from baseline (p <.001). Hence, preventive treatment with GMB may be beneficial for employed patients with migraine.
In the present study, significant indirect cost saving from baseline was observed among patients with EM and CM receiving PBO, suggesting a PBO effect. Similar results were observed in a prior global study comparing indirect costs among GMB versus PBO usersCitation19, and in EVOLVE-1 and EVOLVE-2 studiesCitation12,Citation13 comparing number of migraine headache days between GMB versus PBO users. The findings were confirmed by the significant correlation between indirect cost savings and changes in migraine headache days. In our study, indirect cost savings in patients with CM treated with GMB versus PBO were numerically greater, however it did not achieve statistical significance. This lack of significance in indirect cost saving observed among patients with CM versus EM may be because of a smaller sample size (CM, n = 423 vs. EM, n = 805) and more severe disability (mean MIDAS total score at 3 months: CM = 33.3 vs. EM = 17.1). These results are consistent with a prior global studyCitation19.
Strengths and limitations
This is the first study that evaluates the indirect cost savings in US patients with EM or CM treated with GMB. A similar study estimating indirect costs associated with GMB users with EM or CM was conducted in a global settingCitation19. One of the strengths of our study is the sensitivity analysis that considers real-word setup (0.5 days lost for a conservative estimate of indirect costs). Another strength of the current study is that it highlights the indirect costs in employed patients as these are significant from individual, societal, and employer perspectives. The use of three different domains – work/school, household, and leisure – to measure indirect cost savings adds value to the results as we can assess which domain improvement leads to the greatest cost savings. Such a domain-wise analysis was not done in the prior global studyCitation19.
One of the limitations of our study is that the employment status of patients was not captured in two of the three clinical studies included in the analysis. Without employment status, we might have overestimated absenteeism and presenteeism in MIDAS for patients who were not employed. However, the sensitivity analysis among all employed patients from the REGAIN study showed similar indirect cost savings after treatment with GMB vs. PBO. The employment status question did not allow for more than one selection, i.e. patients with two different employment statuses (e.g. retired and working part-time) did not reflect, which could have led to misclassification bias. Another limitation of the study may be that MIDAS scores are collected at 3-month intervals, which may had introduced recall bias.
Conclusions
The results of the study indicate that patients with EM treated with GMB achieved greater annual indirect costs savings due to reduced absenteeism and increased leisure/social activities than those who received PBO. The indirect cost savings from baseline were also significant in employed patients with CM treated with GMB, however the indirect cost savings with GMB were not significantly greater than those with PBO. Overall, these results indicate indirect cost savings following GMB treatment with similar observations in sensitivity analyses.
Transparency
Author contributions
Conception of work: OJV
Design of the work: OJV and WY
Acquisition of data: WY and XM
Data Analysis: WY and XM
Data interpretation: OJV, WY, RB, XM, and JH
Manuscript writing and critical revision: OJV, WY, RB, XM, and JH
Final approval: OJV, WY, RB, XM, and JH
Reviewer disclosures
A reviewer on this manuscript has disclosed that they have been a PI in two of the clinical trials analyzed in this manuscript (EVOLVE-2 and REGAIN). They have also received fees for training and consultancy activities from Lilly. Peer reviewers on this manuscript have no other relevant financial relationships or otherwise to disclose.
Previous presentations
A portion of these results was presented at the 2022 American Headache Society (AHS); June 9–12, 2022.
Supplemental Material
Download MS Word (898.3 KB)Acknowledgements
The authors thank Janet H Ford (Eli Lilly and Company, Indianapolis, IN) for providing input during the study design and implementation. Rahul Nikam and Keerthana Muthiah, employees of Eli Lilly Services India Pvt. Ltd., provided writing support.
Declaration of financial/other relationships
OJV, WY, RB, and JH are employees and stockholders of Eli Lilly and Company. XM is an employee of TechData Services Company and performs contracted work for Eli Lilly and Company.
Additional information
Funding
References
- Renjith V, Pai MS, Castelino F, et al. Clinical profile and functional disability of patients with migraine. J Neurosci Rural Pract. 2016;7(2):250–256.
- Shimizu T, Sakai F, Miyake H, et al. Disability, quality of life, productivity impairment and employer costs of migraine in the workplace. J Headache Pain. 2021;22(1):29.
- Munakata J, Hazard E, Serrano D, et al. Economic burden of transformed migraine: results from the American Migraine Prevalence and Prevention (AMPP) study. Headache. 2009;49(4):498–508.
- Ford JH, Foster SA, Nichols RM, et al. A real-world analysis of patient-reported outcomes in patients with migraine by preventive treatment eligibility status in the US and Europe. J Patient Rep Outcomes. 2020;4(1):53.
- Yucel A, Thach A, Kumar S, et al. Estimating the economic burden of migraine on US employers. Am J Manag Care. 2020;26(12):e403–e408.
- Bonafede M, Sapra S, Shah N, et al. Direct and indirect healthcare resource utilization and costs among migraine patients in the United States. Headache. 2018;58(5):700–714.
- Dueland AN, Leira R, Burke TA, et al. The impact of migraine on work, family, and leisure among young women - a multinational study. Curr Med Res Opin. 2004;20(10):1595–1604.
- Messali A, Sanderson JC, Blumenfeld AM, et al. Direct and indirect costs of chronic and episodic migraine in the United States: a web-based survey. Headache. 2016;56(2):306–322.
- Lipton RB, Lee L, Saikali NP, et al. Effect of headache-free days on disability, productivity, quality of life, and costs among individuals with migraine. J Manag Care Spec Pharm. 2020;26(10):1344–1352.
- Polson M, Williams TD, Speicher LC, et al. Concomitant medical conditions and total cost of care in patients with migraine: a real-world claims analysis. Am J Manag Care. 2020;26(1 Sup):S3–S7. pl).
- Lamb YN. Galcanezumab: first global approval. Drugs. 2018;78(16):1769–1775.
- Stauffer VL, Dodick DW, Zhang Q, et al. Evaluation of galcanezumab for the prevention of episodic migraine: the EVOLVE-1 randomized clinical trial. JAMA Neurol. 2018;75(9):1080–1088.
- Skljarevski V, Matharu M, Millen BA, et al. Efficacy and safety of galcanezumab for the prevention of episodic migraine: results of the EVOLVE-2 phase 3 randomized controlled clinical trial. Cephalalgia. 2018;38(8):1442–1454.
- Detke HC, Goadsby PJ, Wang S, et al. Galcanezumab in chronic migraine: the randomized, double-blind, placebo-controlled REGAIN study. Neurology. 2018;91(24):e2211–e2221.
- Mulleners WM, Kim BK, Láinez MJA, et al. Safety and efficacy of galcanezumab in patients for whom previous migraine preventive medication from two to four categories had failed (CONQUER): a multicentre, randomised, double-blind, placebo-controlled, phase 3b trial. Lancet Neurol. 2020;19(10):814–825.
- Ford J, Tassorelli C, Leroux E, et al. Changes in patient functioning and disability: results from a phase 3, double-blind, randomized, placebo-controlled clinical trial evaluating galcanezumab for chronic migraine prevention (REGAIN). Qual Life Res. 2021;30(1):105–115.
- Smitherman TA, Tietjen GE, Schuh K, et al. Efficacy of galcanezumab for migraine prevention in patients with a medical history of anxiety and/or depression: a post Hoc analysis of the phase 3, randomized, double-blind, placebo-controlled REGAIN, and pooled EVOLVE-1 and EVOLVE-2 studies. Headache. 2020;60(10):2202–2219.
- Porter JK, Di Tanna GL, Lipton RB, et al. Costs of acute headache medication use and productivity losses among patients with migraine: insights from three randomized controlled trials. Pharmacoecon Open. 2019;3(3):411–417.
- Tobin J, Ford JH, Tockhorn-Heidenreich A, et al. Annual indirect cost savings in patients with episodic or chronic migraine: post-hoc analyses from multiple galcanezumab clinical trials. J Med Econ. 2022;25(1):630–639.
- Headache Classification Committee of the International Headache Society (IHS). The international classification of headache disorders, 3rd edition (beta version). Cephalalgia. 2013;33(9):629–808.
- The Migraine Disability Assessment Test: National Headache Foundation. [cited 2022 Aug 4]. Available from: https://headaches.org/wp-content/uploads/2018/02/MIDAS.pdf
- Konduri KC, Astroza S, Sana B, et al. Joint analysis of time use and consumer expenditure data: examination of two approaches to deriving values of time. Transportation Res Record. 2011;2231(1):53–60.
- International Monetary Fund. World Economic Outlook Database [cited 2022 Aug 4]. Available from: https://www.imf.org/en/Publications/WEO/weo-database/2019/October.
- Bureau of Labor and Statistics. “American time use survey — 2021 results.” U.S. Department of Labor. USDL-20-1275 2020. p. 1–26. [cited 2022 Aug 4]. Available from: https://www.bls.gov/news.release/pdf/atus.pdf#:∼:text=The%20estimates%20in%20this%20news%20release%20are%20based,i.ndividuals%20age%2015%20and%20over%20spend%20their%20time.
- Hoenig JM, Heisey DM. The abuse of power. Am Stat. 2001;55(1):19–24.
- Levine M, Ensom MH. Post hoc power analysis: an idea whose time has passed? Pharmacotherapy. 2001;21(4):405–409.
- Althouse AD. Post hoc power: not empowering, just misleading. J Surg Res. 2021;259:a3–a6.
- Khanal S, Underwood M, Naghdi S, et al. A systematic review of economic evaluations of pharmacological treatments for adults with chronic migraine. J Headache Pain. 2022;23(1):122.
- Nguyen JL, Munshi K, Peasah SK, et al. Trends in utilization and costs of migraine medications, 2017–2020. J Headache Pain. 2022;23(1):111.
- Tinelli M, Leonardi M, Paemeleire K, et al. Structured headache services as the solution to the ill-health burden of headache. 3. Modelling effectiveness and cost-effectiveness of implementation in Europe: findings and conclusions. J Headache Pain. 2021;22(1):90.
- Hu XH, Markson LE, Lipton RB, et al. Burden of migraine in the United States: disability and economic costs. Arch Intern Med. 1999;159(8):813–818.
- Hawkins K, Wang S, Rupnow MF. Indirect cost burden of migraine in the United States. J Occup Environ Med. 2007;49(4):368–374.
- Stewart WF, Lipton RB, Whyte J, et al. An international study to assess reliability of the migraine disability assessment (MIDAS) score. Neurology. 1999;53(5):988–994. Sep 22
- Charles A. The evolution of a migraine attack - a review of recent evidence. Headache. 2013;53(2):413–419.
- Burton WN, Chen CY, Li X, et al. Evaluation of a workplace-based migraine education program. J Occup Environ Med. 2016;58(8):790–795.
- Yu J, Smith KJ, Brixner DI. Cost effectiveness of pharmacotherapy for the prevention of migraine: a Markov model application. CNS Drugs. 2010;24(8):695–712.
- Lipton RB, Brennan A, Palmer S, et al. Estimating the clinical effectiveness and value-based price range of erenumab for the prevention of migraine in patients with prior treatment failures: a US societal perspective. J Med Econ. 2018;21(7):666–675.
- Schoenen J, Manise M, Nonis R, et al. Monoclonal antibodies blocking CGRP transmission: an update on their added value in migraine prevention. Rev Neurol (Paris). 2020;176(10):788–803.
- Stewart WF, Lipton RB, Kolodner KB, et al. Validity of the Migraine Disability Assessment (MIDAS) score in comparison to a diary-based measure in a population sample of migraine sufferers. Pain. 2000;88(1):41–52.
- Martelletti P, Schwedt TJ, Vo P, et al. Healthcare resource use and indirect costs associated with migraine in Italy: results from the My Migraine Voice survey. J Med Econ. 2021;24(1):717–726.
- Lublóy Á. Economic burden of migraine in Latvia and Lithuania: direct and indirect costs. BMC Public Health. 2019;19(1):1242.