
Abstract
Aims
To summarize published studies evaluating productivity loss and productivity loss costs associated with cancer, chronic lung disease, depression, pain, and cardiometabolic disease among US employees.
Materials and methods
A PubMed search from the past 10 years was conducted using the terms productivity, absenteeism, presenteeism, cancer, bronchitis, asthma, chronic obstructive pulmonary disease, depression, pain, heart disease, hypertension, and diabetes (limited to English-language publications and studies of adults aged 19–64). Study endpoints included annual incremental time (work hours lost and Work Productivity and Impairment [WPAI] questionnaire overall work impairment) and monetary estimates of productivity loss. Studies were critically appraised using a modified Oxford Centre for Evidence-Based Medicine (OCEBM) Quality Rating Scheme.
Results
Of 2,037 records identified from the search, 183 studies were included. The most common observed condition leading to productivity loss was pain (24%), followed by cancer (22%), chronic lung disease (17%), cardiometabolic disease (16%), and depression (16%). Nearly three-quarters of the studies (n = 133, 72.7%) were case-control/retrospective cohort studies (OCEBM quality rating 3); the remainder were case series/cross-sectional studies (n = 28, 15.3%; quality rating 4), randomized clinical trials (n = 18, 9.8%; quality rating 1); and controlled trials without randomization/prospective comparative cohort trials (n = 4, 2.2%; quality rating 2). Samples sizes ranged from 18 patients to millions of patients for studies using the Medical Expenditure Panel Survey (MEPS). Most studies found employees lost up to 80 annual incremental work hours; employees with cancer and cardiometabolic disease had the greatest number of work hours lost. Overall percentage work impairment ranged from 10% to 70% and was higher for pain and depression. Annual incremental costs of lost work productivity ranged from $100 to $10,000 and were higher for cancer, pain, and depression.
Limitations
Study heterogeneity.
Conclusions
Despite some gaps in evidence for the cost of productivity loss, sufficient data highlight the substantial employer burden of lost productivity among priority conditions.
PLAIN LANGUAGE SUMMARY
Investment in workforce health and well-being is a practice pursued by high-performing companies as health improvement strategies have produced excellent returns on investment. This literature review sought to gain a better understanding of employee productivity loss for important diseases (i.e. cancer, chronic lung disease [bronchitis, asthma, or chronic obstructive pulmonary disease], depression, pain, and cardiometabolic disease [heart disease, hypertension, or diabetes] to help employers and healthcare payers prioritize investment in workforce health. The findings highlight the substantial burden of lost productivity among these conditions. Most studies found employees lost up to 80 annual work hours and employees with cancer and cardiometabolic disease had the greatest annual incremental number of work hours lost. The proportion of work impairment ranged from 10% to 70% and was higher for employees with pain and depression. The annual cost of lost work productivity ranged from $100 to $10,000 and was higher among employees with cancer, pain, and depression.
Introduction
Employer-sponsored health insurance (ESHI) is the most common form of healthcare coverage for individuals residing in the United States (US) under the age of 65 yearsCitation1. A substantial portion of US employees’ healthcare insurance premium costs are covered by employers, contributing to labor costs for organizationsCitation2. Annual premiums for ESHI have increased 22% over the last five years and 55% over the last ten yearsCitation3. In 2020 alone, annual premiums rose 4%, reaching an average of $7,470 for single coverage and $21,342 for family coverageCitation3. Worker health and well-being have become increasingly important for businesses given the link between investments in health and well-being and employee work output and qualityCitation2,Citation4,Citation5.
There is some evidence that health improvement strategies may have positive returns on investment and that access to comprehensive health insurance and the associated costs may be viewed as investments in employees rather than expensesCitation5–8. A study by Grossmeier et al.Citation6 found, over a 6-year observation period, stock values for a portfolio of companies that received high scores in a corporate health and wellness self-assessment appreciated by 235% compared with the Standard & Poor’s (S&P) 500 Index appreciation of 159%. Another study evaluating stock market performance of Corporate Health Achievement Award winners by Fabius et al.Citation7 found, from 1 July 1999 through 30 June 2012, Corporate Health Achievement Award winners had a cumulative return of 78.7% for their research portfolio compared to a cumulative return of −0.8% for the S&P 500. The investigators (Goetzel et al. 2016Citation8) repeated a similar analysis during the 14-year period from 2000 to 2014 and found Koop Award winners’ stock values appreciated by 325% compared with the market average appreciation of 105%. Hence, evidence supports establishing a corporate culture of health, well-being, and environmental safety provides a competitive advantage in the marketplace.
Robust investment in workforce health and well-being benefits appears to be one of multiple practices pursued by high-performing, well-managed companiesCitation6. Workers with deficiencies in their well-being benefits at work present an opportunity for companies to improve efficiencyCitation2, with respect to productivity, loyalty, and retention as well as decreased absenteeism (amount of time missed from work) and presenteeism (amount of reduced productivity/performance while at work) ratesCitation6–8. Employee health, productivity, and retention have become increasingly important for employers’ competitive advantage in the marketplaceCitation6–8, particularly since the emergence of COVID-19Citation9–11. In order to prioritize various treatments and expenditures, US employers may benefit from having a better understanding of the conditions that most impact employee productivity.
Evidence regarding the comparative productivity loss and the cost of productivity loss associated with various chronic conditions has not yet been collectively gathered, appraised, or integrated in the published medical literature. Specifically, there is limited systematic literature reviews and summaries about the indirect costs of productivity loss from the perspective of employers. A better understanding of employers’ productivity loss burden from priority conditions would help both employers and healthcare payers prioritize resource allocation and develop effective and targeted interventions. Employers could potentially implement programs and/or modify policies to mitigate the indirect consequences of these priority conditionsCitation4,Citation12,Citation13. Hence, the objective of this study was to conduct a systematic literature review to summarize existing published evidence evaluating the productivity loss associated with priority conditions among the working age population in the US.
Methods
Study design and approach
This systematic literature review was conducted and reported following the Preferred Reporting Items for Systematic Reviews and Meta-Analyses (PRISMA), one of the most commonly followed and robust guidelinesCitation14. The systematic review protocol was registered in the York PROSPERO database (PROSPERO: A registry for systematic review protocols | Augustus C. Long Health Sciences Library (columbia.edu); Study ID # 272626).
The intent of this study was to summarize published evidence that evaluates productivity loss and the cost of productivity loss of the most costly or “highest priority” chronic conditions to employers. A study by Mitchell et al.Citation15 was used to identify the top five health conditions associated with the greatest productivity loss and medical costs for US employers. These authors estimated productivity loss and medical costs using data from more than 1.3 million employed individuals who completed the OptumHealth Health Risk Appraisal (HRA) survey between January 2007 and December 2009Citation15. The authors considered average annual rates of absenteeism (days of work missed because of illness) and presenteeism (days at work but limited in performing job tasks because of health) in their estimates. The top five conditions in terms of productivity loss and medical costs per employee were cancer, chronic lung disease (bronchitis, asthma, or chronic obstructive pulmonary disease [COPD]), depression, pain, and cardiometabolic disease (heart disease, hypertension, or diabetes)Citation15.
Search strategy
A search strategy was developed to identify all studies published within the last 10 years that evaluated productivity loss and the cost of productivity loss of the five most costly chronic conditions to employers. A keyword search was carried out using the PubMed electronic database with the following search terms: (productivity or absenteeism or presenteeism) and (cancer or bronchitis or asthma or chronic obstructive pulmonary disease or depression or pain or heart disease or hypertension or diabetes). The search, conducted on 6 December 2021, was limited to English-language publications and adults aged 19–64 years. The detailed search terms and search strategy are outlined in eTable 1.
Inclusion and exclusion criteria
Studies were included if they contained a time or monetary estimate of the cost of productivity loss of the five identified chronic conditions. The cost of productivity loss was defined as the costs of chronic condition on labor market outcomes (i.e. absenteeism, presenteeism, and short-term and long-term disability). Studies were excluded if they were non-human, non-English, were conducted outside the US, did not contain primary data (e.g. literature reviews [systematic or narrative], meta-analyses, commentaries, editorials, study designs, etc.), did not have clinical data (e.g. laboratory data or non-human data), did not evaluate productivity loss (i.e. time or monetary estimates), did not evaluate one of the conditions of interest (i.e. cancer, chronic lung disease [bronchitis, asthma, or COPD], depression, pain, cardiometabolic disease [heart disease, hypertension, or diabetes]), did not evaluate the working age population (i.e. age 19–64), or were small case series or case studies. Only full-text publications were included. Conference abstracts and presentations were excluded. Corresponding authors were contacted if full-text articles could not be retrieved from public domains. The reference lists of identified articles were also reviewed to identify additional studies that contained relevant primary data.
Study selection procedure and data extraction
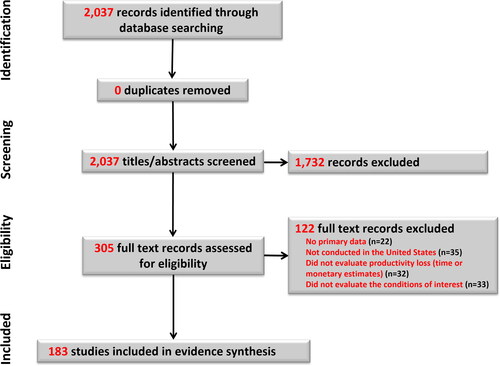
Two reviewers independently applied the inclusion and exclusion criteria. All studies underwent a title and abstract screening, and potentially relevant citations were additionally checked in a full-text screening. Disagreements were resolved through discussion, and reasons for exclusion were recorded. A PRISMA diagram () illustrates the study selection process.
Figure 1. PRISMA flow diagram showing study selection.
Data extracted included the journal citation, publication year, study design, data source, chronic condition evaluated, sample size, study population (i.e. baseline demographic and clinical characteristics), duration of follow-up, productivity loss outcomes evaluated, methods of calculation, and reported the cost of productivity loss. A summary of the studies included in the analysis can be found in eTable 2.
Quality assessment and risk of bias
Studies were appraised for their level of evidence based on the study design and the rigor of methodology used, as well as the ability to prevent and/or control for bias to analyze cause and effect. All included studies were critically appraised and ranked on a scale of 1–5 using a modified version of the Oxford Centre for Evidence-Based Medicine Quality Rating SchemeCitation16.
Data synthesis
The studies were summarized descriptively using frequency counts and proportions to describe the different types of studies, the numbers of employees, the populations evaluated, and the outcomes assessed. Separate descriptive summaries were prepared for each individual condition. Ranges of productivity loss and the cost of productivity loss were provided. Priority time estimates for employers were incremental work hours lost, followed by the percentage of overall work impairment from the Work Productivity and Impairment (WPAI) questionnaire. Incremental work hours lost were only those hours of work lost that could directly be attributed to the condition of interest that the patient had (i.e. work hours lost due to the patient’s cancer, chronic lung disease [bronchitis, asthma, or COPD], depression, pain, or cardiometabolic disease [heart disease, hypertension, or diabetes]). The WPAI questionnaire is a validated self-reported questionnaireCitation17–19 that is used to quantify work productivity and activity impairment by combining the self-reported amount of time missed from work with the self-reported amount of reduced productivity/performance while at work. The WPAI has four subscales: absenteeism, presenteeism, overall work impairment (absenteeism and presenteeism), and activity impairment. Subscale scores are generated in the form of percentages or proportions of impairment, with higher values indicating greater impairment.
Results
Study selection and quality
presents the PRISMA diagram illustrating the study selection. A total of 2,037 records were identified from the database search. The titles and/or abstracts were screened for relevancy, and 1,732 were excluded. Full text publications were obtained for 305 articles. Of the full text publications evaluated, 121 were excluded (22 had no primary data, 35 studies were not conducted in the US, 32 did not evaluate productivity loss (time or monetary estimates), and 32 did not evaluate the conditions of interest). No additional studies were identified through searching the reference lists of previously identified studies. A total of 183 studies were selected for inclusion in the systematic literature review evidence synthesis. Nearly three-quarters of the studies (n = 133, 72.7%) were case-control studies or retrospective cohort studies and had a quality rating of 3 on the modified Oxford Centre for Evidence-Based Medicine Quality Rating Scheme (Supplementary eTable 2). The remaining studies were case series with or without intervention or cross-sectional studies (n = 28, 15.3%; quality rating of 4), properly powered and conducted randomized clinical trials (n = 18, 9.8%; quality rating of 1); and well-designed controlled trials without randomization or prospective comparative cohort trials (n = 4, 2.2%; quality rating of 2). Samples sizes ranged from 18 patients to millions of patients for studies using the Medical Expenditure Panel Survey (MEPS) (Supplementary eTable 2).
Study characteristics
presents a summary of the characteristics of the studies identified in the systematic literature review, and Supplementary eTable 2 presents a more detailed extraction from the studies. The most common health conditions observed were pain (n = 44 studies, 24%), followed by cancer (n = 40 studies, 22%), chronic lung disease (n = 31 studies, 17%), cardiometabolic disease (n = 30 studies, 16%), and depression (n = 29 studies, 16%). Pain conditions evaluated in the studies identified in the literature review were mostly related to chronic pain (n = 41 of 44 studies), including osteoarthritis, rheumatoid arthritis, back pain, knee pain, neck pain, fibromyalgia, psoriatic arthritis, and neuropathic pain. Acute pain conditions (n = 3 of 44 studies) included oral pain and musculoskeletal injuries.
Table 1. Characteristics of studies included in the systematic literature review.
Two-thirds of the studies (66%) were secondary data analyses. The most common data sources or types were prospective studies (20%), unique patient surveys (16%), the Medical Expenditure Panel Survey (MEPS; 13%), randomized controlled trials (10%), MarketScan retrospective database evaluations (10%), other database evaluations (10%), and the National Health and Wellness Survey (9%). A large proportion of studies were published between 2016 and 2018 (40%), with a decline in the number of studies published since 2018.
Productivity loss
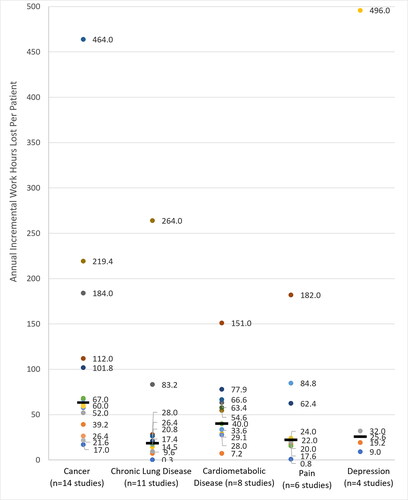
Nearly all of the included studies evaluated productivity loss (97.3%). Most studies found employees lost up to 80 annual incremental work hours attributed to their condition (). Among studies of employees with cancer, the annual incremental work hours lost ranged from 17.0 to 184.0; however, a majority of the studies found employees lost between 17.0 and 68.0 h of work per year due to cancer (median 63.5 h). Most studies of employees with cardiometabolic disease found employees lost between 28.0 and 77.9 work hours per year (median 40.0 h). Hours of work lost were similar across most studies of chronic pain and chronic lung disease, typically ranging from 0 to 28.0 work hours lost per year (medians were 22.0 h for pain and 18.4 h for chronic lung disease). Employees with chronic low back pain and severe arthritis had greater hours of lost workdays (84.8 and 182 work hours lost per year, respectively). Few studies reported annual work hours lost due to depression; however, the range (9.0–32.0 h/year) and median (25.6 h) were similar to chronic pain and chronic lung disease.
Figure 2. Annual incremental work hours lost per employee by condition.
Note. Each data point represents an observed study value for the incremental work hours lost. Some studies had multiple estimates. Median values are indicated with a straight black line.
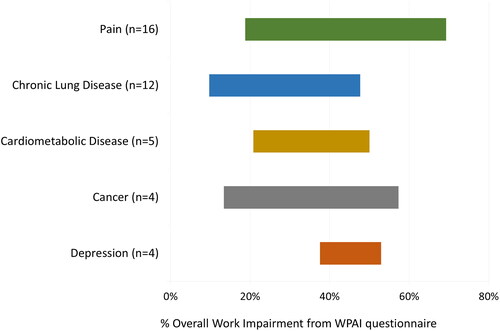
Many of the pain and chronic lung disease studies measured productivity loss using the WPAI. The overall proportion of work impairment as measured from the WPAI ranged from approximately 10% to 70% across all of the studies (). The WPAI overall work impairment was generally higher for employees with depression (range 37.6%–52.9%, median 47.1%) and pain (range 18.8%–69.3%, median 42.3%), followed by cardiometabolic disease (range 20.8%–50.0%, median 36.6%) and cancer (range 13.4%–57.3%, median 31.0%), and finally chronic lung disease (range 9.7%–47.7%, median 24.9%).
Figure 3. Range of overall work impairment over the past 2 weeks from the WPAI questionnaire by condition.
Abbreviation. WPAI, Work Productivity and Impairment.
Cost of lost productivity
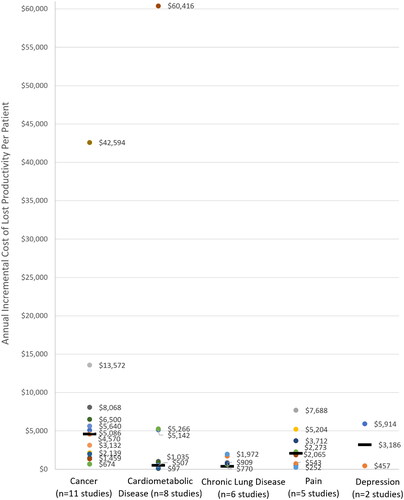
Less than half of the included studies evaluated the cost of productivity loss (42.6%). Annual incremental costs of lost work productivity typically ranged from $100 to $10,000 (). The annual cost of lost productivity was generally higher among employees with cancer (range $674–$42,594, median $4,570), depression (range $457–$5,914, median $3,186), and pain (range $252–$7,688, median $2,065), followed by chronic lung disease (range $363–$1,972, median $770) and cardiometabolic disease (range $97–$60,416, median $507).
Figure 4. Annual incremental cost of lost productivity per employee by condition.
Note. Each data point represents an observed study value for the incremental cost of lost productivity. Some studies had multiple estimates. Median values are indicated with a straight black line.
Discussion
Despite some gaps in evidence for the cost of productivity loss, this systematic literature review demonstrated the existence of sufficient data reporting the substantial employer burden of lost productivity for priority conditions. Nearly all of the 183 included studies quantified productivity time loss (97.3%); however, less than half of the studies evaluated the cost of productivity loss (42.6%). Most studies found employees lost up to 80 annual incremental work hours annually. Employees with cancer and cardiometabolic disease had the greatest annual incremental number of work hours lost. The proportion of overall work impairment as measured by the WPAI ranged from 10% to 70% and was generally higher for employees with pain and depression. The annual incremental costs of lost work productivity ranged from $100 to $10,000 and was generally higher among employees with cancer, pain, and depression.
Productivity loss time and cost estimates varied among the different studies. This heterogeneity is expected given the diversity of employee populations, range of conditions and condition impairment, and variation of study designs. This research provides a comprehensive summary of published evidence from 2011 to 2021 regarding productivity loss associated with priority conditions among the working age population in the US. The incremental estimates of time loss and costs observed in this study may be useful as a benchmark reference against which other studies of incremental productivity loss can be compared. As an example, a recent prior study by the authors (Rojanasarot et al.Citation20) evaluated the incremental productivity loss associated with erectile dysfunction (ED). The results showed, on average, men with ED had an additional 282.7 h/year of work impairment compared to men without ED, resulting in annual estimated incremental costs of $7,270 per employee. Hence, the findings from the current study provide context for the ED estimate and relative magnitude of impact ED can have on employee productivity.
Prior to this study, there was a paucity of published research summarizing the literature on productivity loss. The findings of the current study are, however, consistent with the few published studies on this subject. MacLeod et al.Citation21 examined the types and extent of hypertension-associated productivity loss among adults in the US. The annual additional time loss per person was estimated to be 1.3 days for absenteeism, and annual additional costs were estimated to be as high as $2,362 for absenteeism and presenteeism combined. A systematic literature review by Burton et al.Citation22 summarized studies of productivity loss due to rheumatoid arthritis (RA) in the US and Europe. Study findings showed 66% (range 36–84%) of employed RA subjects experienced work loss due to RA in the previous 12 months, for a median duration of 39 days (range 7–84 days). Similarly, Lenssinck et al.Citation23 summarized the literature for workplace productivity loss and sick leave for employees with inflammatory arthritis (IA). Approximately 17%–88% of IA employees experienced workplace productivity loss, with the total duration of sick leave ranging from 0.1 to 11 days over one month.
Employee health, productivity, and retention are increasingly important components of employers’ competitive advantage in the marketplaceCitation6–8. Unprecedented workplace changes emerging with COVID-19 necessitate the critical review of how to capture employee well-being and productivity. Traditional methods and data sources for capturing productivity loss may be less applicable given the dramatic changes the workplace has recently undergone. The pandemic has both accelerated and disrupted various trends associated with the future of workCitation11. Efforts to re-conceptualize productivity and to modify research strategies accordingly should be considered given the transformed work environments, job expectations, and health and behavior of employees.
Limitations of this study mostly relate to the heterogeneity of the employees, range of conditions and condition impairment, variation of study designs, and definitions of outcome measures. Although nonrandomized cohort studies or observational studies may provide more “real-world” representations of outcomes, costs, and utilization, differences in the population and study characteristics can increase the variation in results. For example, studies of employees with cancer ranged from employees who were in remission to employees with advanced/terminal cancer stages. Another example is the use of variable follow-up periods that potentially contributed to the differences in findings across studies. Differences in estimation methods and study populations also made it challenging to synthesize and compare the time lost and costs across studies. Furthermore, the studies that are summarized in the manuscript do not document causal effects. It is possible that other differences would have emerged had there been adequate data to consider additional factors or greater granularity (e.g. if types of cancer or types of cardiometabolic disease had been evaluated). Also, productivity loss was most commonly measured as hours of work loss or self-reported productivity loss as estimated through the WPAI. These sources are not direct measures of actual worker productivity (e.g. output per hours of work, employment rate, or earningsCitation24) and, hence, may be inaccurate. Nonetheless, the findings give some insights into the ranges of work loss or self-reported productivity loss available in the published medical literature. We did not differentiate among employees with incident, prevalent, or a history of these diseases, although most studies specified that employees had the condition at the time of the evaluation. Finally, the limited number of published studies available for some conditions (e.g. depression) and certain outcomes (e.g. cost of lost productivity) is a limitation.
Conclusions
This systematic literature review of recent publications showed that, despite some gaps in evidence for the cost of productivity loss, there are sufficient data highlighting the substantial employer burden of lost productivity. This research provides a comprehensive summary of recent published evidence regarding productivity loss associated with priority conditions among the working age population in the US. Most studies found employees lost up to 80 annual work hours and employees with cancer and cardiometabolic disease had the greatest annual incremental number of work hours lost. The proportion of work impairment ranged from 10% to 70% and was higher for employees with pain and depression. Employee health, productivity, and retention are increasingly important components of employers’ competitive advantage in the marketplace. These findings will help employers and healthcare payers prioritize investment in workforce health and develop effective and targeted interventions to enhance productivity of employees and ensure greater and more equitable participation in the workforce. The incremental estimates of time loss and costs observed may also provide useful benchmark references against which other studies of incremental productivity loss can be compared.
Transparency
Declaration of financial/other relationships
SR and SKB are full-time employees of Boston Scientific. NE is an employee of Health Services Consulting Corporation, a consulting company that is paid by Boston Scientific for the services rendered.
Author contributions
All authors contributed to the study design, manuscript development, and critical manuscript revision and have read and approved the final manuscript and agree to be accountable for all aspects of the work. SR and NE had full access to all the data in the study and take responsibility for the integrity of the data and the accuracy of the data analysis.
Reviewer disclosures
Peer reviewers on this manuscript have received an honorarium from JME for their review work but have no other relevant financial relationships to disclose.
Previous presentations
Poster presentation at the International Society for Pharmacoeconomics and Outcomes Research (ISPOR) 2022 Annual Meeting from 15 to 18 May 2022 in Washington, DC.
Supplemental Material
Download MS Word (98.4 KB)Acknowledgements
The authors would like to thank Alysha McGovern for her assistance in proofreading this manuscript.
Declaration of funding
This work was supported by Boston Scientific.
Correction Statement
This article has been corrected with minor changes. These changes do not impact the academic content of the article.
References
- The Kaiser Family Foundation State Health Facts. Health Insurance coverage of the total population. 2020; [cited 2021 April 16]. Available from https://www.kff.org/other/state-indicator/total-population/?currentTimeframe=0&sortModel=%7B%22colId%22:%22Location%22,%22sort%22:%22asc%22%7D
- Bialowolski P, McNeely E, VanderWeele TJ, et al. Ill health and distraction at work: costs and drivers for productivity loss. PLoS One. 2020;15(3):e0230562.
- Claxton G, Damico A, Rae M, et al. Health benefits in 2020: premiums in employer-sponsored plans grow 4 percent; employers consider responses to pandemic. Health Aff. 2020;39(11):2018–2028.
- Adams JM. The value of worker well-being. Public Health Rep. 2019;134(6):583–586.
- Centers for Disease Control and Prevention (CDC). Increase productivity: workplace health programs can increase productivity. 2023; [cited 2023 January 18]. Available from: https://www.cdc.gov/workplacehealthpromotion/model/control-costs/benefits/productivity.html.
- Grossmeier J, Fabius R, Flynn JP, et al. Linking workplace health promotion best practices and organizational financial performance: tracking market performance of companies with highest scores on the HERO scorecard. J Occup Environ Med. 2016;58(1):16–23.
- Fabius R, Thayer RD, Konicki DL, et al. The link between workforce health and safety and the health of the bottom line: tracking market performance of companies that nurture a "culture of health. J Occup Environ Med. 2013;55(9):993–1000.
- Goetzel RZ, Fabius R, Fabius D, et al. The stock performance of C. Everett koop award winners compared with the standard & poor’s 500 index. J Occup Environ Med. 2016;58(1):9–15.
- Pabilonia SW, Victoria V. Telework, wages, and time use in the United States. Rev Econ Househ. 2022;2022:1–48.
- De-la-Calle-Durán M-C, Rodríguez-Sánchez J-L. Employee engagement and wellbeing in times of COVID-19: a proposal of the 5Cs model. Int J Environ Res Public Health. 2021;18(10):5470.
- Ng MA, Naranjo A, Schlotzhauer AE, et al. Has the COVID-19 pandemic accelerated the future of work or changed its course? Implications for research and practice. Int J Environ Res Public Health. 2021;18(19):10199.
- Cancelliere C, Cassidy JD, Ammendolia C, et al. Are workplace health promotion programs effective at improving presenteeism in workers? A systematic review and best evidence synthesis of the literature. BMC Public Health. 2011;11:395–395.
- Tarro L, Llauradó E, Ulldemolins G, et al. Effectiveness of workplace interventions for improving absenteeism, productivity, and work ability of employees: a systematic review and Meta-Analysis of randomized controlled trials. Int J Environ Res Public Health. 2020;17(6):1901.
- Preferred Reporting Items for Systematic Reviews and Meta-Analyses (PRISMA). Preferred Reporting Items for Systematic Reviews and Meta-Analyses (PRISMA) Transparent Reporting of Systematic Reviews and Meta-Analyses. 2021; [cited 2021 April 18]. Available from: http://www.prisma-statement.org/.
- Mitchell RJ, Bates P. Measuring health-related productivity loss. Popul Health Manag. 2011;14(2):93–98.
- Oxford Centre for Evidence-Based Medicine. Quality Rating Scheme 2022; [cited 2022 June 30]. Available from: https://www.cebm.net/.
- Reilly MC, Gerlier L, Brabant Y, et al. Validity, reliability, and responsiveness of the work productivity and activity impairment questionnaire in Crohn’s disease. Clin Ther. 2008;30(2):393–404.
- Zhang W, Bansback N, Boonen A, et al. Validity of the work productivity and activity impairment questionnaire–general health version in patients with rheumatoid arthritis. Arthritis Res Ther. 2010;12(5):R177.
- Giovannetti ER, Wolff JL, Frick KD, et al. Construct validity of the work productivity and activity impairment questionnaire across informal caregivers of chronically ill older patients. Value Health. 2009;12(6):1011–1017.
- Rojanasarot SS, Bhattacharyya SK, Burnett AL. Cost of lost productivity due to erectile dysfunction and impact of employer benefit exclusion of penile prosthesis implantation treatment. J Occup Environ Med. 2021;64(5):403–408.
- MacLeod KE, Ye Z, Donald B, et al. A Literature review of productivity loss associated with hypertension in the United States. Popul Health Manag. 2022;25(3):297–308.
- Burton W, Morrison A, Maclean R, et al. Systematic review of studies of productivity loss due to rheumatoid arthritis. Occup Med. 2006;56(1):18–27.
- Lenssinck ML, Burdorf A, Boonen A, et al. Consequences of inflammatory arthritis for workplace productivity loss and sick leave: a systematic review. Ann Rheum Dis. 2013;72(4):493–505.
- Hakulinen C, Elovainio M, Arffman M, et al. Mental disorders and long-term labour market outcomes: nationwide cohort study of 2 055 720 individuals. Acta Psychiatr Scand. 2019;140(4):371–381.