
Abstract
Aim
Screening for non-valvular atrial fibrillation (NVAF) is key in identifying patients with undiagnosed disease who may be eligible for anticoagulation therapy. Understanding the economic value of screening is necessary to assess optimal strategies for payers and healthcare systems. We evaluated the cost effectiveness of opportunistic screening with handheld digital devices and pulse palpation, as well as targeted screening predictive algorithms for UK patients ≥75 years of age.
Methods
A previously developed Markov cohort model was adapted to evaluate clinical and economic outcomes of opportunistic screening including pulse palpation, Zenicor (extended 14 days), KardiaMobile (extended), and two algorithms compared to no screening. Key model inputs including epidemiology estimates, screening effectiveness, and risks for medical events were derived from the STROKESTOP, ARISTOTLE studies, and published literature, and cost inputs were obtained from a UK national cost database. Health and cost outcomes, annually discounted at 3.5%, were reported for a cohort of 10,000 patients vs. no screening over a time horizon equivalent to a patient’s lifetime, Analyses were performed from a UK National Health Services and personal social services perspective.
Results
Zenicor, pulse palpation, and KardiaMobile were dominant (providing better health outcomes at lower costs) vs. no screening; both algorithms were cost-effective vs. no screening, with incremental cost-effectiveness ratios per quality-adjusted life-year (QALY) of £1,040 and £1,166. Zenicor, pulse palpation, and KardiaMobile remained dominant options vs. no screening in all scenarios explored. Deterministic sensitivity analyses indicated long-term stroke care costs, prevalence of undiagnosed NVAF in patients 75–79 years of age, and clinical efficacy of anticoagulant on stroke prevention were the main drivers of the cost-effectiveness results.
Conclusions
Screening for NVAF at ≥75 years of age could result in fewer NVAF-related strokes. NVAF screening is cost-effective and may be cost-saving depending on the program chosen.
Introduction
Atrial fibrillation (AF) is the most common sustained arrhythmia and is a global health care problem, with an increasing prevalence worldwide driven by an aging populationCitation1–6. The presence of AF can lead to thromboembolic events such as ischemic strokes, which tend to be more severe compared to other causes of stroke and may result in greater disability and/or higher mortality.Citation7 In the UK, approximately 20% of strokes are attributed to AF.Citation8,Citation9 AF also has a substantial economic impact; the direct cost of AF, assuming a 3% annual increase in prevalence, was estimated at £1,435 million for 2020 and £2,351 million forecasted for 2030.Citation10 Anticoagulation is recommended for AF to mitigate the risk of stroke in eligible patients who have a CHA2DS2-VASc risk score of ≥2,Citation11 but diagnosis can be challenging as AF is often paroxysmal and asymptomatic. A considerable proportion of AF cases remain undiagnosed and therefore untreated, with an estimated 300,000 undiagnosed patients in the UK alone.Citation12
A variety of portable, wearable, and implantable devices have been developed for the detection of AF, which may facilitate screening in a variety of clinical settings.Citation13 The 12-lead electrocardiogram, a single time-point device, is the gold standard and the only device approved for diagnosis by the National Institute for Health and Care Excellence in the UKCitation11 alongside pulse palpation. Extended time screening devices include KardiaMobile and Zenicor. European Society of Cardiology guidelines state that systematic screening with electrocardiogram should be considered in individuals >75 years of age to detect AF.Citation14 Other advances being made for the detection of AF include machine learning algorithms which work by analyzing patient records within primary care settings and flagging patients at risk for AF for general practitioner (GP) review. These algorithms apply published risk models using baseline clinical variables and biomarkers for future AF risk prediction.Citation15 While the introduction of a screening program may increase the number of AF cases detected, it may also lead to additional costs as well as costs associated with initiating anticoagulation therapy for eligible patients.
The STROKESTOP trial was a randomized controlled trial conducted in two regions in Sweden and evaluating a systemic screening program for AF; patients 75–76 years of age were randomly assigned to a control group or invited to be screened for AF using the Zenicor device.Citation16 This was a clinical outcomes study to evaluate the benefit of screening on incidence of stroke and other key clinical endpoints. The trial reported a composite primary endpoint of ischemic or hemorrhagic stroke, systemic embolism, hospitalization for bleeding, or death from any cause. Over a median follow-up of 6.9 years, patients in the screening group had significantly fewer events than the patients in the control group (5.45 events per 100 years [95% CI = 5.29–5.61] vs. 5.68 events per 100 years [95% CI = 5.52–5.85]) when considering the primary endpoint. A cost-effectiveness analysis of STROKESTOP using extended follow-up data was presented at the 2021 European Society of Cardiology (ESC) congress.Citation17 Over a lifetime horizon in a cohort of 1,000 individuals, screening resulted in a gain of 77 life-years (LY) and 65 quality-adjusted life-years (QALY), and reduction in costs of an estimated €1.8 million.
While previous studies have conducted economic evaluations of AF screening strategies in the UK,Citation18–21 they have not included the full range of screening devices available for AF detection. A better understanding of the economic value associated with screening is therefore necessary to identify an optimal screening strategy in an effort to make patients aware of their undiagnosed AF who may be eligible for anticoagulation therapy. In this analysis, we evaluated the clinical and economic outcomes of one-time screening for AF with handheld digital devices, pulse palpation, as well as algorithms, among UK patients ≥75 years of age over the course of the patient’s lifetime.
Methods
Model structure
A previously published model was adapted to conduct cost effectiveness analysis of targeted screening for NVAF in UK patients ≥75 years of age.Citation22 A Markov cohort model was developed in Microsoft Excel to assess screening strategies for NVAF and anticoagulation treatments for NVAF (Supplementary Figure S1). The model used a 13-week cycle length simulating five identical cohorts of 10,000 patients of 75 years of age over a lifetime horizon. The following cohorts were used: no screening, screening once with a predictive-based algorithm, screening for 14 days with Zenicor, screening once with pulse palpation by a nurse, and screening for 45 days with KardiaMobile.
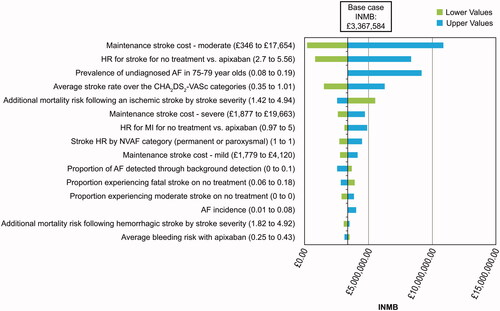
Figure 1. DSA results for INMB for KardiaMobile vs. no screening.
Patients with a true positive diagnosis of NVAF were treated with an oral anticoagulant (OAC) based on eligibility; all other patients did not receive treatment. If patients received a false negative or true positive diagnosis, they could experience the following clinical events: ischemic and hemorrhagic strokes of varying severity, systemic embolism, major and non-major bleeding events, myocardial infarction, treatment discontinuation, and death. Patients detected with NVAF were subject to a confirmatory 12-lead ECG test as this is the only device approved for diagnosis in the UK.Citation11 The risk of clinical events was not applied to patients with a true negative or false positive diagnosis as these patients do not have NVAF.
Model inputs
Epidemiology inputs are presented in Supplementary Table S2. The model included two sets of population characteristics: for the screening population (which consisted of patients subject to screening) and for patients with NVAF. A National Institute for Health and Research systematic literature review and CEA by Welton et al.Citation18 on screening strategies for NVAF was used to determine the prevalence of diagnosed and undiagnosed NVAF by age group; annual incidence of NVAF in each age group was obtained from the Heart & Circulatory Disease Statistics 2020 published by the British Heart Foundation.Citation23 The ratio of permanent to paroxysmal NVAF patients was stratified by age group and considered separately for undiagnosed and diagnosed NVAF patients; proportions of diagnosed NVAF cases that are paroxysmal are taken from Welton et al.Citation18 The annual risk of progression from paroxysmal to permanent was assumed to be the same for all age groups and was also taken from Welton et al.Citation18 Risk of stroke and major bleeding was estimated using the CHA2DS2-VASc risk classification scheme, with distribution of patients among the scores sourced from NICE guidance NG196 G2.Citation24
Table 2. Absolute clinical outcomes results per 10,000 patients.
Effectiveness of screening strategies are presented in Supplementary Table S3. The screening programs evaluated in the model were no screening, algorithms, Zenicor, pulse palpation, and KardiaMobile. Two screening algorithms, Hill et al.Citation15 and Schnabel et al.Citation25 were evaluated in the model. Hill et al.Citation15 evaluated novel and conventional statistical and machine learning models for risk prediction of NVAF using a retrospective cohort study of adults aged ≥30 years without a history of NVAF (N = 2,994,837), listed on the Clinical Practice Research Datalink, from January 2006 to December 2016. Over the study period, 95,607 patients developed NVAF. Time-varying neural networks were concluded to be the optimal predictive algorithm with 75% sensitivity and 74.9% specificity. Schnabel et al.Citation25 aimed to identify a set of routinely available predictors of incident AF in primary care and post-stroke using machine learning methods. It aggregated NVAF predictors in patients aged >45 years using claims data from the InGef database (N = 1,476,391) for incident NVAF and NVAF post-stroke. The model resulted in a sensitivity of 77% and a specificity of 70%. Background screening was also included in the model; background diagnosis refers to the detection of NVAF as a result of a patient’s normal interactions with the healthcare system (e.g. routine physical exam). Following the STROKESTOP study, 5% of all NVAF patients, independent of age, would be detected every year.Citation16
Risks of clinical events are presented in Supplementary Table S4. Clinical inputs were calculated or sourced from a secondary analysis of ARISTOTLE trial,Citation26 network meta-analyses,Citation27 and published literatureCitation28; background mortality was based on UK 2017–2019 life tables.Citation29 For patients with NVAF, a hazard ratio (HR) based on previous NVAF CEMsCitation28,Citation30 that were calculated using mortality data from a Swedish study was applied to background mortality rates, reflecting the increased risk of mortality vs. the general population after accounting for events modeled.
All costs were reported in 2021 GBP. Screening costs were divided into fixed costs and variable costs, and were calculated for each device separately (Supplementary Table S5). Fixed costs included the sum of (i) the purchase cost of a given device, (ii) total maintenance cost of the screening program, (iii) cost required for personnel training, and (iv) one-time purchase and maintenance cost for software required by the devices. Variable costs (per screening) included (i) per-screening cost, (ii) wages of the personnel conducting and interpreting screening, (iii) administration costs, and (iv) cost of sending invitation letters to program participants. Purchase costs of handheld devices (e.g., Zenicor and KardiaMobile) followed the approach given in the NICE medical technologies guidance 64 (MTG64) on KardiaMobile for detecting NVAFCitation31 which calculated the cost per person year (PY). Medical personnel costs for initial screening were considered as 3 min of administration time for all methods; pulse palpation included one additional minute of nurse time. Costs of a confirmatory test were composed of an ECG 12-lead device cost, with 15 min of nurse time to conduct the ECG, 3 min of administration time, and 1 min of specialist time to interpret the results. Apixaban treatment was evaluated as it is the most widely used direct oral anticoagulantCitation32; using British National Formulary 2021 data,Citation33 the average daily cost of apixaban was calculated as £1.90. Event costs were sourced from literature and National Health Service (NHS) reference costs and are presented in Supplementary Table S6.
The health-related quality-of-life of the cohort was determined based on age, presence of NVAF, or other medical events. The utility of the population screened without NVAF was determined by age group using the EuroQol five dimensions questionnaire (EQ-5D; Supplementary Table S7). General-population EQ-5D utilities were taken from an analysis of EQ-5D data from Kind et al.Citation34 Patients were assigned utilities according to their health states; these were updated upon the occurrence of stroke or hemorrhagic strokes with different utility scores for different severity level (i.e. mild, moderate, severe; Supplementary Table S8). Utility values for stroke were taken from a UK-based population study conducted by Luengo-Fernandez et al.Citation35; values for systemic embolism (SE) and myocardial infarction (MI) were taken from NICE NG196 G2.Citation24 Utility decrements were applied additively to patients upon the occurrence of other ICHs, other major bleeds, clinically relevant non-major (CRNM) bleeds, and cardiovascular hospitalizations (unrelated to stroke and MI) for a certain duration specific for each event (Supplementary Table S9). Utility decrements associated with use of apixaban were obtained from a study by Gage and Owens.Citation36
Analysis
The base case analyses were a pairwise comparison of the comparators in the model vs. no screening. The health economic model used the following comparators: algorithms (Hill et al.Citation15 and Schnabel et al.Citation25), KardiaMobile, Zenicor, and pulse palpation. Only the Hill algorithm was included in the sensitivity analysis as this algorithm is based on a large sample size of patients from the UK Clinical Practice Research Datalink and has been validated in a retrospective cohort study.Citation37
Outcomes were reported for a cohort of 10,000 patients over a time horizon equivalent to a patient’s lifetime, from an NHS and personal social services perspective, with an assumption of 100% compliance in rate of screening. Cost and health discount rates were both considered at 3.5% per NICE guidance.Citation38 Health outcomes were evaluated in terms of NVAF cases detected, strokes avoided, and QALY gains. Costs were presented as screening-related, anticoagulant-related, and medical event-related costs. Incremental costs and health outcomes were used to calculate incremental cost-effectiveness per QALY gained, per NVAF case detected, per stroke avoided, and per life year gained.
A univariate deterministic sensitivity analysis (DSA) was performed where each parameter was varied according to the 95% confidence intervals and standard deviations where applicable while holding all other parameters constant. Where confidence intervals and standard deviations were unavailable, the standard deviation was assumed to be 20% of the mean. Results were defined in terms of incremental effectiveness, incremental costs, and incremental net monetary benefit (INMB).
To assess the joint uncertainty of the underlying parameter estimates, a probabilistic sensitivity analysis (PSA) was performed. Each parameter was assigned a distribution best matching the data type, as per guidance in Briggs and Schulpher.Citation39 A number of probability distributions were employed, including beta for inputs such as proportions and utility values, lognormal for HRs, uniform, gamma for costs, and Dirichlet distributions for multinomial outcomes. The model was set to the probabilistic setting and ran for 1,000 simulations to generate incremental cost-effectiveness ratios (ICERs) by varying event rates, costs, risks, and utilities simultaneously; time horizon and model settings were kept constant, whereas key inputs were varied from replication to replication by sampling from probability distributions.
Various scenario analyses were considered to further explore parameters and assumptions. Modeling assumptions for screening sensitivity, choice of NVAF risk sources, OAC eligibility, discount rates, costs associated with screening, interpretation of tests and a different machine-learning risk prediction algorithm source were tested. Screening sensitivity was varied by ±20%.
Screening effectiveness and cost inputs were reviewed by a UK-based key opinion leader. Predictive validity was checked by comparing clinical results projected from the model with those reported in the updated analysis of STROKESTOP. The screening method used in STROKESTOP was Zenicor. Model settings were updated to use inputs from STROKESTOP with the following configurations applied: STROKESTOP and model outcomes comparison was conducted separately for no screening and Zenicor, as the patient numbers in STROKESTOP were different for the screened and control cohort. The total invited to screening (N = 13,979) vs. no screening (N = 13,996) was analyzed, as well as participants only (N = 7,165) vs. no screening (N = 13,996). Only the 75–79 years old patient group was considered using a 0.454/0.546 male-to-female ratio. Background detection rates were set to 0%. The proportion of patients eligible for OAC treatment was based on the proportion of OAC users among individuals with diagnosed NVAF (57.6% for the no screening arm, 60.6% for the total invited to screening, and 63.3% for participants only of the screening arm).
Comorbidities reported for the control group in the updated STROKESTOP analysis were used to calculate CHA2DS2-VASc score. The time horizon of the model was set to 6.9 years, corresponding to the median follow-up time in STROKESTOP. The results from the predictive validation showed that risk ratios for ischemic stroke and death were similar between the model and STROKESTOP (Supplementary Table S10).
Results
Zenicor, pulse palpation, and KardiaMobile all dominated against no screening, providing better health outcomes at lower costs; the algorithms (Hill et al.Citation15 and Schnabel et al.Citation25) were more effective and more costly compared to no screening, resulting in an ICER per QALY of £1,040 using the Hill et al.Citation15 algorithm and an ICER per QALY of £1,166 using the Schnabel et al.Citation25 algorithm (). KardiaMobile (extended) had the highest number of NVAF cases detected, closely followed by pulse palpation, resulting in the lowest number of ischemic strokes, MI, and SE events for these two comparators (). No screening had the lowest number of NVAF cases detected, resulting in the highest number of ischemic strokes, MI, and SE events in comparison to the other strategies. Numbers needed to screen to detect one AF case and to avoid one ischemic stroke were lowest with KardiaMobile (extended), followed by pulse palpation ().
Table 1. Incremental results vs. no screening based on a cohort of 10,000 patients.
Patients who underwent screening with the algorithms, pulse palpation, or KardiaMobile (extended) experienced the highest LYs, followed by Zenicor (extended 14 days). Patients screened with pulse palpation or KardiaMobile (extended) experienced the highest QALYs, followed by algorithms and Zenicor (extended 14 days); no screening resulted in the lowest LYs and QALYs per patient.
Overall, pulse palpation was the least expensive screening strategy, followed by KardiaMobile (extended), Zenicor (extended 14 days), algorithms, and no screening. Discounted absolute health and cost outcomes per patient are presented in Supplementary Table S11.
The effect that variations in the parameter values had on incremental QALYs, incremental costs, and INMB was assessed with a one-way DSA (; Supplementary Figure S2). A positive INMB indicated screening with the intervention was cost-effective compared to no screening. The main drivers of the model for IMNB and QALYs were prevalence of undiagnosed NVAF in patients 75–79 years of age, and HR for stroke for no treatment vs. apixaban. Main drivers of the model for costs were the maintenance cost associated with a moderate stroke, and the HR for stroke for no treatment vs. apixaban.
Figure 2. Scatter plot of incremental costs vs. incremental QALYs for each comparator vs. no screening.
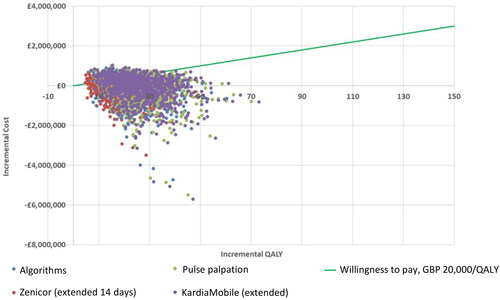
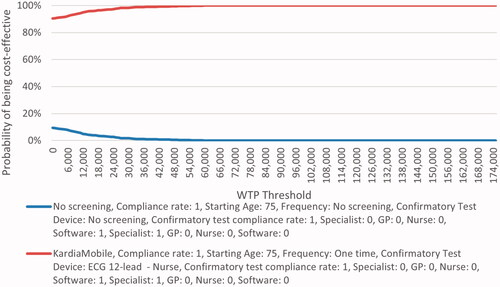
shows the incremental cost vs. incremental QALY for each PSA iteration showing pairwise comparison of each comparator vs. no screening. A £20,000 willingness-to-pay threshold was used. The majority of simulations showed all comparators dominating against no screening, with some simulations being more effective but more costly than no screening. Pairwise comparison of each comparator vs. no screening yielded similar cost-effectiveness acceptability curves (; Supplementary Figure S3) where all comparators appear to be cost-effective over no screening at any given willingness-to-pay threshold. The following lists the proportion of simulations that were dominant against no screening over the 1,000 iterations: 45.5% with algorithms, 48.2% with Zenicor (14 days), 47.8% with pulse palpation, and 47.6% with KardiaMobile. In addition, the proportion of simulations resulting in ICERs under £20,000 per QALY compared to no screening were as follows: 80.2% with algorithms, 83.5% with Zenicor (14 days), 83.0% with pulse palpation, and 82.6% with KardiaMobile.
Figure 3. Cost-effectiveness acceptability curve for KardiaMobile vs. no screening.
Results from scenario analysis varying different parameters impacting the ICER are presented in Supplementary Table S12. Zenicor, pulse palpation, and KardiaMobile remained dominant screening options compared to no screening in all scenarios explored. The ICER of algorithms vs. no screening ranged from being a dominant option to £1,490 per QALY, which was much lower than the £20,000/QALY threshold in all scenarios. Negligible changes from the base case results were seen.
Discussion
In this analysis, Zenicor, pulse palpation, and KardiaMobile screening methods were all dominant against no screening, whereas algorithms were more effective and more costly than no screening. Difference in results observed between the digital devices and algorithms are due to the difference in assumptions made on their screening strategy approach. Algorithms were intended to be used with a targeted screening approach, i.e. identifying patients based on their risk factors for NVAF; and assuming they would be invited for further testing NVAF for which an additional GP visit cost was incurred compared to those screened in routine practice. The other screening strategies were expected to be used in routine clinical practice as more opportunistic screening approaches, which explains the effect seen on the dominant model results. The dominance of screening programs over no screening was driven primarily by the high sensitivity of screening programs and aversion of medical event costs. The model results therefore suggest that screening for NVAF is cost-effective vs. no screening, leading to increased detection of NVAF as well as increased stroke prevention, at an acceptable cost of increased oral anticoagulants which is partially offset by lower medical costs.
A high proportion of screening-detected NVAF is asymptomatic and may not be captured in a routine setting; however, when adjusting for risk factors there is no evidence to suggest that asymptomatic NVAF results in a lower risk of stroke.Citation18 The STROKESTOP randomized controlled trial, which included older patients, further supports the benefits of screening, including in key outcomes such as ischemic stroke (participants vs. controls HR = 0.76 [CI = 0.68–0.87; p <0.0001]). In the context of NVAF, concerns for over-diagnosis or over-treatment may be less important and should be balanced with the detrimental impact on patient outcomes and costs to the health care system that may result without diagnosis or treatment.
There are two cost-effectiveness analyses conducted from the STROKESTOP team; the firstCitation40 was published based on the original STROKESTOP study systemic screening findingsCitation16 and a more recent analysis was presented at the ESC Congress 2021Citation17 using the long-term follow-up data from STROKESTOP.Citation41 A cost-effectiveness analysis of STROKESTOP conducted evaluating population-based screening for NVAF in patients 75/76 years of age using the Zenicor device was presented at ESC 2021, though ICER/QALY was not provided.Citation17 Over a lifetime horizon in a cohort of 1,000 individuals, 10.6 strokes were averted, 2.9 bleedings associated with hospitalization were averted and one case of systemic embolism was observed with screening. The full study methodology is not yet published and it is therefore difficult to compare results, but data show that screening with Zenicor dominated over other screening strategies; this is in line with our model results. Results from other key cost-effectiveness analyses are presented in Supplementary Table S13.
Differences in the results of our study compared to the published ones are mainly related to differences in model design which are described in further detail. The first analysis of STROKESTOP included a mass systemic screening with Zenicor, whereas the current analysis used an opportunistic screening approach; demographic and cost inputs were also specific to a Swedish population, whereas the current model used UK-specific inputs. There are also differences in the way costs are captured for clinical events, e.g. STROKESTOP applies a higher medical cost for a period of 1 year after a stroke occurs and then applies a lower medical maintenance cost after 1 year; the current model applies acute stroke costs for 2 weeks after the event occurs and then applies a long-term maintenance cost after the acute period is complete. Additionally, the sensitivity and specificity of Zenicor was not reported in the STROKESTOP study and therefore the publication could have used different screening effectiveness assumptions vs. the current model.
In comparison to the Hobbs analysis, the current model subjects patients to the risk of a higher number of clinical events; only ischemic stroke, hemorrhagic stroke and GI bleeds are included in the Hobbs CEA, whereas the current model considers ischemic stroke, ICH, other major bleeds, MI, SE, and other cardiovascular hospitalization. Therefore, total mean costs in the Hobbs CEA are lower than our model as the current model considers a greater number of clinical events and the costs associated with them. The study used a younger patient population and was published before the advent of OACs, making the anticoagulants of choice in the model warfarin (base case) and aspirin in scenarios; model results are therefore not comparable with the current model. Hobbs reports that screening showed a potential reduction in ischemic strokes; however, no pattern was established for mean costs and QALYs vs. no screening. Hobbs also used a discrete event simulation to conduct the CEA, running the model for 500,000 patients. The current model used a Markov approach with a cohort of 10,000 patients, leading to differences in the modeling approach.
Compared with the National Institute for Health Research (NIHR) analysis, there were key differences between these studies that could contribute to the difference in results observed. First, the current model assumes a 100% compliance rate of screening in the base case to capture maximum effect of a population-based screening strategy, whereas a 42.9% uptake rate was assumed in the NIHR model. NIHR based clinical event rates on a NMA published in 2017, whereas clinical event rates in our model are primarily based on post-hoc analyses of the ARTISTOLE trial; these data were used as it provided rates of stroke, ICH, and other major bleed detailed by each age group and specific to each CHA2DS2-VASc value, which allowed for additional granularity vs. real-world evidence or NMA results. Different costing assumptions were also used for screening and medical events between the current model and the NIHR model, such as higher costs of systemic embolism in the NIHR model. The NIHR model does not stratify stroke by severity except for post-stroke management costs, and instead averages costs of an acute stroke event by severity; although the same Luengo-Fernandez et al.Citation35 publication was used in both models, this approach leads to a different cost estimate for stroke events compared to the current model.
Lastly, Hill’s model structure was based on a published NVAF model used by NIHRCitation18; the structure and health states used were similar between both models. However, the current analysis also models additional clinical events such as systemic embolism, other cardiovascular hospitalizations, and GI and non-GI bleeds, whereas the Hill model accounts for the possibility of joint clinical events occurring after the first single event.
Results of this study were robust in sensitivity and scenario analyses. Zenicor, pulse palpation, and KardiaMobile remained dominant against no screening in all scenarios, and algorithms were highly cost-effective in all scenarios, with ICER/QALY well below the £20,000 willingness-to-pay threshold. However, further research into comparative screening effectiveness inputs is required.
No head-to-head studies were available to compare the effectiveness of all the screening devices evaluated in the model. The effectiveness of KardiaMobile and Zenicor were assumed to be the same as their one-time screening use estimates due to a lack of available data; however, this assumption is conservative to the extended approaches and is not expected to have a significant impact on our CE results. There is also a lack of UK-specific data for systemic embolism costs and therefore assumptions were made on the cost of a SE event using other cardiovascular hospitalization cost data; however, the DSA did not show SE costs to drive model results for any comparator, and therefore this assumption is not expected to have a significant impact on our CE results. Additionally, the proportion of OACs prescribed in 2019 that were direct-acting rose considerably to 62%, with apixaban being the most widely used treatmentCitation32; we expect this trend to be even more pronounced in 2023 and for the results of this study to be broadly representative of treatment options used in the clinical setting.
While we assumed 5% of patients with undiagnosed NVAF are detected annually without a screening program, based on the assumption utilized in the STROKESTOP model,Citation40 there is no published underlying evidence to support this figure; this parameter was varied in the DSA, and a small impact was found on model QALY results but minimal impact on costs or INMB. Additionally, assessment of screening strategies with a higher screening frequency than one-off is subject to considerable uncertainty because the true NVAF incidence and the rate of diagnosis are not known. In the current model, we assumed all incident cases of NVAF would be undiagnosed, and thus the benefits of more frequent screening are due to diagnosis of new NVAF and diagnosis of previously undetected NVAF. The Markov approach used lacks memory to fully capture the evolution of NVAF burden and its impact on stroke risk over time and separate newly incident NVAF with previously undetected NVAF.
Conclusions
Screening for NVAF at 75 years of age could result in fewer NVAF-related strokes. This study adds to the body of evidence that suggests NVAF screening utilizing various approaches is cost-effective, and may be cost-saving to the NHS depending on the screening program chosen.
Transparency
Declaration of financial/other relationships
AN, SP, and TK are employees of Evidera, which was paid by Bristol Myers Squibb/Pfizer in connection with the conduct of this study. RM is an employee and shareholder of Pfizer. YJ has received honoraria from Bristol Myers Squibb/Pfizer in connection with the development of this manuscript. Peer reviewers on this manuscript have no relevant financial or other relationships to disclose.
Author contributions
All authors contributed to the conception and design, or analysis and interpretation of the data; the drafting of the paper or revising it critically for intellectual content; and the final approval of the version to be published. All authors agree to be accountable for all aspects of the work.
Supplemental Material
Download MS Word (747.7 KB)Acknowledgements
Medical writing support was provided by Brooke Middlebrook, CMPP, of Evidera, Inc. and funded by Pfizer and Bristol Myers Squibb.
Additional information
Funding
References
- Dai H, Zhang Q, Much AA, et al. Global, regional, and national prevalence, incidence, mortality, and risk factors for atrial fibrillation, 1990–2017: results from the global burden of disease study 2017. Eur Heart J Qual Care Clin Outcomes. 2021;7(6):574–582.
- Kornej J, Börschel CS, Benjamin EJ, et al. Epidemiology of atrial fibrillation in the 21st century. Circ Res. 2020;127(1):4–20.
- Sieck S. The economic impact of atrial fibrillation in the US. In: Peacock WF, Clark CL, editors. Short stay management of atrial fibrillation. Cham: Springer International Publishing; 2016. p. 27–40.
- Turakhia MP, Shafrin J, Bognar K, et al. Economic burden of undiagnosed nonvalvular atrial fibrillation in the United States. Am J Cardiol. 2015;116(5):733–739.
- Wang L, Ze F, Li J, et al. Trends of global burden of atrial fibrillation/flutter from global burden of disease study 2017. Heart. 2021;107(11):881–887.
- Velleca M, Costa G, Goldstein L, et al. A review of the burden of atrial fibrillation: understanding the impact of the new millennium epidemic across Europe. EMJ Cardiol. 2019;7(1):110–118.
- Miller PS, Andersson FL, Kalra L. Are cost benefits of anticoagulation for stroke prevention in atrial fibrillation underestimated? Stroke. 2005;36(2):360–366.
- Lacoin L, Lumley M, Ridha E, et al. Evolving landscape of stroke prevention in atrial fibrillation within the UK between 2012 and 2016: a cross-sectional analysis study using CPRD. BMJ Open. 2017;7(9):e015363.
- Reiffel JA. Atrial fibrillation and stroke: epidemiology. Am J Med. 2014;127(4):e15–e16.
- Burdett P, Lip GYH. Atrial fibrillation in the UK: predicting costs of an emerging epidemic recognizing and forecasting the cost drivers of atrial fibrillation-related costs. Eur Heart J Qual Care Clin Outcomes. 2022;8(2):187–194.
- National Institute for Health and Care Excellence. Atrial fibrillation: diagnosis and management [NG196]; 2021. Available from: https://www.nice.org.uk/guidance/ng196/evidence
- Foundation BH. Atrial fibrillation: finding the missing 300,000 2019. Available from: https://www.bhf.org.uk/for-professionals/healthcare-professionals/blog/2019/atrial-fibrillation-finding-the-missing-300000
- Jones NR, Taylor CJ, Hobbs FDR, et al. Screening for atrial fibrillation: a call for evidence. Eur Heart J. 2020;41(10):1075–1085.
- Hindricks G, Potpara T, Dagres N, et al. ESC guidelines for the diagnosis and management of atrial fibrillation developed in collaboration with the European Association of Cardio-Thoracic surgery (EACTS). Eur Heart J. 2021;42(5):373–498.
- Hill NR, Ayoubkhani D, McEwan P, et al. Predicting atrial fibrillation in primary care using machine learning. PLoS One. 2019;14(11):e0224582.
- Svennberg E, Engdahl J, Al-Khalili F, et al. Mass screening for untreated atrial fibrillation: the STROKESTOP study. Circulation. 2015;131(25):2176–2184.
- Lyth J, Svennberg E, Bernfort L, et al. STROKESTOP: cost-effectiveness of population screening for atrial fibrillation based on long-term follow-up data. European Society of Cardiology Congress 2021 - The Digital Experience; presented 27 August 2021.
- Welton NJ, McAleenan A, Thom HH, et al. Screening strategies for atrial fibrillation: a systematic review and cost-effectiveness analysis. Health Technol Assess. 2017;21(29):1–236.
- Hobbs FDR, Fitzmaurice DA, Mant J, et al. A randomised controlled trial and cost-effectiveness study of systematic screening (targeted and total population screening) versus routine practice for the detection of atrial fibrillation in people aged 65 and over. The SAFE study. Health Technol Assess. 2005;9(40):93.
- Hill NR, Groves L, Dickerson C, et al. Identification of undiagnosed atrial fibrillation using a machine learning risk prediction algorithm and diagnostic testing (PULsE-AI) in primary care: cost-effectiveness of a screening strategy evaluated in a randomised controlled trial in England. J Med Econ. 2022;25(1):974–983.
- Szymanski T, Ashton R, Sekelj S, et al. Budget impact analysis of a machine learning algorithm to predict high risk of atrial fibrillation among primary care patients. EP Europace. 2022;24(8):1240–1247.
- Oguz M, Lanitis T, Li X, et al. Cost-effectiveness of extended and one-time screening versus no screening for non-valvular atrial fibrillation in the USA. Appl Health Econ Health Policy. 2020;18(4):533–545.
- British Heart Foundation Statistics. Heart & circulatory disease statistics 2020; 2020 [cited 2021 Jul 23]. Available from: https://www.bhf.org.uk/what-we-do/our-research/heart-statistics/heart-statistics-publications/cardiovascular-disease-statistics-2020
- National Institute for Health and Care Excellence. Atrial fibrillation: diagnosis and management [NG196]. G2: Anticoagulant therapy: health economics analysis; 2021 [2021 Jan 14]. Available from: https://www.nice.org.uk/guidance/ng196/evidence/g2-anticoagulant-therapy-health-economics-analysis-pdf-9081923443
- Schnabel RB, Sullivan LM, Levy D, et al. Development of a risk score for atrial fibrillation (Framingham Heart Study): a community-based cohort study. The Lancet. 2009;373(9665):739–745.
- Granger CB, Alexander JH, McMurray JJV, et al. Apixaban versus warfarin in patients with atrial fibrillation. N Engl J Med. 2011;365(11):981–992.
- Tawfik A, Bielecki JM, Krahn M, et al. Systematic review and network meta-analysis of stroke prevention treatments in patients with atrial fibrillation. Clin Pharmacol. 2016;8:93–107.
- Dorian P, Kongnakorn T, Phatak H, et al. Cost-effectiveness of apixaban vs. current standard of care for stroke prevention in patients with atrial fibrillation. Eur Heart J. 2014;35(28):1897–1906.
- Office of National Statistics. National life tables – life expectancy in the UK: 2017 to 2019 [Dataset]; 2020 [cited 2021 Jul 8]. Available from: https://www.ons.gov.uk/peoplepopulationandcommunity/birthsdeathsandmarriages/lifeexpectancies/bulletins/nationallifetablesunitedkingdom/2017to2019
- Freeman JV, Zhu RP, Owens DK, et al. Cost-effectiveness of dabigatran compared with warfarin for stroke prevention in atrial fibrillation. Ann Intern Med. 2011;154(1):1–11.
- National Institute for Health and Care Excellence. Resource impact template: KardiaMobile for the ambulatory detection of atrial fibrillation (MTG64); 2022 [cited 2022 Feb 21]. Available from: https://www.nice.org.uk/guidance/mtg64
- Afzal S, Zaidi STR, Merchant HA, et al. Prescribing trends of oral anticoagulants in England over the last decade: a focus on new and old drugs and adverse events reporting. J Thromb Thrombolysis. 2021;52(2):646–653.
- Joint Formulary Committee. British national formulary (online). London: BMJ Group and Pharmaceutical Press; 2021. Available from: http://www.medicinescomplete.com
- Kind P, Hardman G, Macran S. UK population norms for EQ-5D. York, UK: Centre for Health Economics, University of York; 1999.
- Luengo-Fernandez R, Yiin GS, Gray AM, et al. Population-based study of acute- and long-term care costs after stroke in patients with AF. Int J Stroke. 2013;8(5):308–314.
- Gage BC, Owens DK. The effect of stroke and stroke prophylaxis with aspirin or warfarin on quality of life. Arch Intern Med. 1996;156(16):1829–1836.
- Sekelj S, Sandler B, Johnston E, et al. Detecting undiagnosed atrial fibrillation in UK primary care: validation of a machine learning prediction algorithm in a retrospective cohort study. Eur J Prev Cardiol. 2021;28(6):598–605.
- National Institute for Health and Care Excellence. NICE health technology evaluations: the manual; 2022 [cited 2022 Jan 31]. Available from: http://www.nice.org.uk/process/pmg36
- Briggs AH, Schulpher CK. Decision modelling for health economic evaluation. Oxford, UK; Oxford University Press; 2006.
- Aronsson M, Svennberg E, Rosenqvist M, et al. Cost-effectiveness of mass screening for untreated atrial fibrillation using intermittent ECG recording. Europace. 2015;17(7):1023–1029.
- Svennberg E, Friberg L, Frykman V, et al. Clinical outcomes in systematic screening for atrial fibrillation (STROKESTOP): a multicentre, parallel group, unmasked, randomised controlled trial. Lancet. 2021;398(10310):1498–1506.