
Abstract
Aims
To provide more recent estimates of healthcare utilization and costs in Huntington’s disease (HD) in the Medicaid population.
Materials and Methods
This retrospective analysis used administrative claims data for HD beneficiaries (≥1 HD claim; ICD-9-CM 333.4) from Medicaid Analytic eXtract data files from 1 January 2010–31 December 2014. The date of the first HD claim during the identification period (1 January 2011–31 December 2013) was assigned as the index date. If a beneficiary had multiple HD claims during the identification period, one was randomly chosen as the index date. Beneficiaries were required to be continuously enrolled in fee-for-service plans during the 1-year pre-index and post-index periods. Medicaid beneficiaries without HD were drawn from a 100% random sample and matched (3:1) to those with HD. Beneficiaries were classified by disease stage (early/middle/late). All-cause and HD-related (any utilization related to HD diagnosis or symptoms associated with HD) healthcare utilization and costs were reported.
Results
A total of 1,785 beneficiaries without HD were matched to 595 beneficiaries with HD (139 early-, 78 middle-, and 378 late-stage). The mean (SD) annual total costs were higher for beneficiaries with HD than beneficiaries without HD ($73,087 [$75,140] vs. $26,834 [$47,659], p <.001) and driven by inpatient costs ($45,190 [$48,185] vs. $13,808 [$39,596], p <.001). Total healthcare costs were highest among beneficiaries with late-stage HD (mean [SD] cost: $22,797 [$31,683] for early-stage HD vs. $55,294 [$129,290] for middle-stage HD vs. $95,251 [$60,197] for late-stage HD; p <.001).
Limitations
Administrative claims are intended for billing purposes and subject to coding errors. This study did not address functional status, which may provide further insight to late-stage and end-of-life burden of HD, and indirect costs.
Conclusions
Medicaid beneficiaries with HD have higher acute healthcare utilization and costs compared to beneficiaries without HD, which tend to increase with disease progression, indicating that HD beneficiaries at later disease stages have greater burden.
PLAIN LANGUAGE SUMMARY
Huntington’s disease (HD) is a degenerative genetic disorder marked by progressive decline in cognitive and motor functions, leading to severe disability and loss of independence. The median and mean survival time after a diagnosis of HD is 15 years. Little is known about the kinds of health services used or costs associated with HD in the United States (US) in the Medicaid population. The study objective was to estimate healthcare utilization and direct medical spending among Medicaid beneficiaries with HD. The mean annual total costs were higher for beneficiaries with HD than beneficiaries without HD ($73,087 vs. $26,834). Mean total healthcare costs were highest among beneficiaries with late-stage HD ($22,797 for early-stage HD vs. $55,294 for middle-stage HD vs. $95,251 for late-stage HD). Medicaid beneficiaries with HD have higher acute healthcare utilization and costs compared to beneficiaries without HD, with utilization and costs increasing with disease progression, indicating that HD beneficiaries at later disease stages have greater burden.
Subject classification codes:
Introduction
Huntington’s disease (HD) is a multifaceted, genetic, neurodegenerative disorder marked by progressive decline in cognitive and motor functions, leading to severe disability and loss of independenceCitation1,Citation2. A recent study estimated HD incidence among US beneficiaries in 2017 to be 6.1 per 100,000 person-years and the prevalence to be 13.1 per 100,000 personsCitation3. Age at onset spans from early childhood to senescence, although typical HD onset occurs between 30–50 years of ageCitation4. The prognosis is particularly poor, and the median and mean survival time after a diagnosis of HD is 15 yearsCitation5. In the absence of effective disease-modifying therapy, the treatment is mainly aimed at symptomatic relief for the motor, cognitive, and behavioral anomalies.
As the disease progresses, individuals with HD require increasing levels of care and support, coupled with extensive utilization of medical and non-medical resources for optimal management of the manifestations of this debilitating diseaseCitation6–9. However, few studies have investigated the healthcare utilization and costs associated with HD in the United States (US), particularly in the Medicaid population. Prior claims analyses have investigated the burden of HD populations with mixed types of healthcare coverage or in Medicare aloneCitation6,Citation10–15. Of these, two reported results by Medicaid-insured patients using data through 2009Citation6,Citation10. While these studies shed light on various aspects of HD, there are no recent or comprehensive studies of disease burden focusing on the Medicaid population.
There is a growing focus on quantifying the economic burden of HD, to provide national-scale cost and resource-use estimates in the US. Health policy planners and decision-makers need to have a comprehensive understanding of the unmet need and associated resource utilization of HD, particularly for Medicaid beneficiaries for whom the estimated prevalence and economic burden of HD may be higher than for other populations, such as commercially-insured patientsCitation3,Citation6. With this in mind, along with the unique data elements collected in the Medicaid database, we sought to provide more recent estimates of healthcare utilization and direct medical expenditures among Medicaid beneficiaries diagnosed with HD.
Methods
Study design and data source
This retrospective study analyzed the most recent data from Medicaid Analytic eXtract (MAX) files from 17 US states (California, Georgia, Idaho, Iowa, Louisiana, Michigan, Minnesota, Mississippi, Missouri, New Jersey, Pennsylvania, South Dakota, Tennessee, Utah, Vermont, West Virginia, Wyoming), between 1 January 2010 and 31 December 2014. MAX is a research-ready data source which contains Medicaid administrative claims data including demographic, eligibility, and enrollment information. It also includes claims-level records that can be used for detailed analysis of patterns of service utilization, diagnoses, and cost of care among Medicaid enrollees. All paid claims were included in the database, therefore, there are no missing data. MAX data is available for all 50 US states from 1999–2012; only 28 states submitted data in 2013, and 17 in 2014. MAX encounters and utilizations data may be incomplete for Medicaid enrollees in prepaid plans (such as Health Maintenance Organization, Prepaid Health Plan, and Primary Care Case Management) or with dual eligibility (covered by both Medicaid and Medicare); therefore, in this study, we only included non-Medicare, full Medicaid coverage enrollees in Fee-for-Service (FFS) plans.
Beneficiary population
The study population included beneficiaries who had at least one claim with a diagnosis code of HD (International Classification of Diseases, Ninth Revision, Clinical Modification (ICD-9-CM): 333.4) during the identification (ID) period (1 January 2011 to 31 December 2013). The date of the first HD claim was assigned as the index date. If a beneficiary had multiple claims with an HD diagnosis code during the ID period, one was randomly chosen as the index date to capture all disease stages. Beneficiaries were required to have continuous enrollment in FFS plans for at least 1 year prior to (baseline or pre-index period) and 1 year after (follow-up or post-index period) the index date (). Beneficiaries with dual eligibility were excluded.
Figure 1. Study time frame. Abbreviations. EOL, end-of-life; ID, identification.
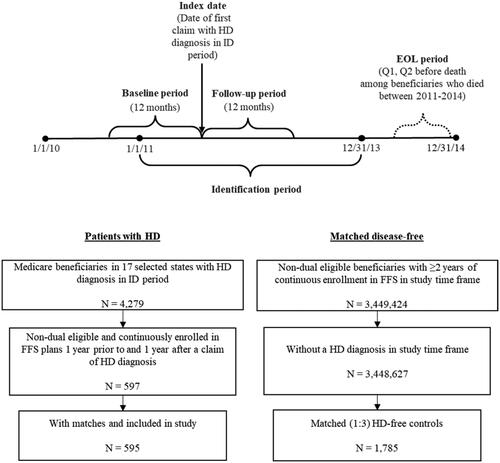
A comparison group was drawn from a 100% random sample of Medicaid beneficiaries and comprised those without HD, defined as beneficiaries without a diagnosis of HD during the entire study period. Beneficiaries without HD were exactly matched to HD-beneficiaries on a 3:1 ratio by calendar year, age, sex, and the US state.
To investigate the outcomes along a continuum of HD progression, we stratified beneficiaries with HD by disease stage (early, middle, late). Stage of disease was measured in the 1-year post-index period based on a published hierarchical algorithm that assigns stage based on the presence of disease markers (i.e. diagnoses or services) received in claims during the index yearCitation6. Beneficiaries with late stage disease were identified first based on the presence of any of the following markers: nursing home, feeding tube, incontinence, bedsore, hospice care, at least two falls within a 1-month period, and dysphagia. The middle stage disease markers included: home assistance, physical therapy, dementia, gait disorder, dysarthria, speech therapy, and having two falls in a 1-month period. Finally, beneficiaries without late or middle stage disease markers were defined as having early stage diseaseCitation6. Unless otherwise indicated, ICD-9-CM, CPT, and HCPCS codes were used to identify disease stage markers.
In addition, an end-of-life analysis was performed to examine the end-of-life care among deceased Medicaid beneficiaries who were diagnosed with HD but subsequently died between 1 January 2011 and 31 December 2014. All beneficiaries were required to have continuous enrollment in the 1-year preceding the date of death (baseline period).
Study measures and analysis
Demographic and socioeconomic characteristics, HD symptoms, and comorbidities, including the Charlson comorbidity index (CCI), were measured during the baseline period. All healthcare utilization and cost outcomes were measured in the follow-up period for the main study cohort and stratified by stage of disease. For the end-of-life care analysis, outcomes were measured during the last two quarters of life. All-cause and HD-related (any utilization related to HD diagnosis or symptoms associated with HD healthcare utilization) healthcare utilization outcomes were measured, which included emergency department (ED) visits, inpatient hospitalization, physician office visits, skilled nursing facility (SNF) care, hospice care, respite care, home health care, residential care, and use of durable medical equipment (DME). Medication use was reported for selected HD treatments (i.e. tetrabenazine, deutetrabenazine, glutamatergic-modifying drugs [amantadine, riluzole], neuroleptics, donepezil, minocycline, nabilone, coenzyme Q10, energy metabolites such as creatine and omega-3 fatty acids) and for supportive medications (i.e. antidepressants, anxiolytics, antiepileptic agents, antispastic agents, stimulants, or lithium). Costs (all-cause and HD-related) were calculated for inpatient (e.g. acute hospitalization, SNF, hospice, or other inpatient), outpatient (e.g. ED, physician office, lab, or other outpatient facility costs), and outpatient pharmacy services. Costs were adjusted to 2014 dollars using the medical care component of the Consumer Price IndexCitation16.
Among HD beneficiaries who died between 2011 and 2014, outcomes were examined at the end-of-life in the last two quarters before the date of death: The first quarter (Pre Q1) was defined as the 3-month period immediately preceding date of death, while Pre Q2 was defined as the 3-month period preceding Pre Q1.
Descriptive statistics were reported for all outcome measures (means and standard deviations [SD] for continuous variables; counts and proportions [%] for categorical variables), including costs, for the main comparison groups and by disease stage (early, middle, late). Chi-square tests were used for comparison of categorical outcomes and t-tests or ANOVA were used for continuous outcomes at a significance level of 0.05. All statistical analyses were conducted using SAS version 9.4. Strobe guidelines for observational studies were usedCitation17.
Results
Healthcare utilization and costs in beneficiaries with vs. without Huntington’s disease
A total of 1,785 beneficiaries without HD were matched to 595 beneficiaries with HD (, ). The matched cohorts had a mean (SD) age of 46.8 (14.4) years, 63.7% female, and >55% were white, with all regions represented (29.6% Midwest, 15.5% Northeast, 28.6% South, 26.4% West). The HD beneficiaries had a lower mean (SD) Charlson comorbidity index score (0.9 [1.5] vs. 1.3 [2.0], p <.001) while more chronic conditions on average at baseline (3.7 [1.9] vs. 3.1 [2.4], p <.001) compared to beneficiaries without HD.
Table 1. Baseline characteristics among Medicaid beneficiaries, with vs. without Huntington’s disease.
The HD beneficiaries had a higher proportion of all-cause inpatient hospitalizations (26.1% vs. 15.5%, p <.001), ED visits (53.6% vs. 41.4%, p <.001), and skilled nursing facility care (50.4% vs. 10.9%, p <.001) as compared to beneficiaries without HD (). Compared to beneficiaries without HD, the HD beneficiaries had higher prescription drug use for antidepressants (56.5% vs. 40.6%), anxiolytics (32.6% vs. 20.9%), and antiepileptics (50.3% vs. 33.2%) (; all p <.001). The mean (SD) annual total costs were higher for HD beneficiaries than beneficiaries without HD ($73,087 [$75,140] vs. $26,834 [$47,659], p <.001) and were primarily driven by inpatient costs ($45,190 [$48,185] vs. $13,808 [$39,596], p <.001) (, ).
Figure 2. Mean annual all-cause healthcare costs among Medicaid beneficiaries with vs. without Huntington’s Diseasea. aBeneficiaries without HD were exactly matched to beneficiaries diagnosed with HD on a 1:1 ratio by age, sex, calendar year, and US state.
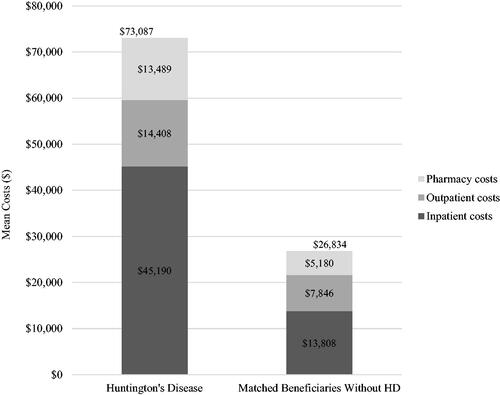
Table 2. Healthcare utilization and costs among Medicaid beneficiaries, with vs. without Huntington’s Disease (adjusted to 2014 Dollars).
Healthcare utilization and costs by stage of Huntington’s disease
In the stratified analyses, the majority of beneficiaries with HD had late-stage disease: early (n = 139; 23.4%), middle (n = 78; 13.1%), late (n = 378; 63.5%) (). Disease strata varied by mean (SD) age (40.5 [15.9], 42.8 [17.5], 50.0 [12.0] years) and number of chronic conditions (3.0 [1.8], 3.8 [2.0], 3.9 [1.9]) (); all p <.001. Late-stage beneficiaries had higher report of HD symptoms (72.7%, 76.9%, 95.5%; ), higher use of HD treatment (46.8%, 55.1%, 69.8%), anxiolytics (23.0%, 26.9%, 37.3%), and antiepileptics (42.4%, 34.6%, 56.3%), all p ≤.005 (); and all-cause hospitalizations (18.0%, 24.4%, 29.4%, p =.031) (). Total annual healthcare costs were highest among beneficiaries with late-stage HD (mean [SD] cost: $22,797 [$31,683] for early-stage HD vs. $55,294 [$129,290] for middle stage HD vs. $95,251 [$60,197] for late-stage HD; p <.001) primarily driven by inpatient costs ($68,860 [$44,258] for late-stage HD). The mean total costs more than doubled between early and middle stages (, ). Similarly for HD-related costs, annual healthcare costs were highest among beneficiaries with late-stage disease (mean [SD] cost: $9,970 [$22,972] for early-stage HD vs. $22,484 [$36,528] for middle stage HD vs. $66,070 [$54,193] for late-stage HD; p <.001) also driven by inpatient costs ($51,005 [$46,939] for late-stage HD) (, ).
Figure 3. Mean healthcare costs by disease stage and at end of life (all-cause)a–c. aLate-stage disease markers identified first: nursing home, feeding tube, incontinence, bedsore, hospice care, at least two falls within a 1-month period and dysphagia. Middle stage disease markers identified second: home assistance, physical therapy, dementia, gait disorder, dysarthria, speech therapy, and having two falls in a 1-month period. Beneficiaries without late or middle stage disease markers were defined as early-stage disease. bAt the end of life, Pre Q1 was defined as the 3-month period immediately preceding death and Pre Q2 was defined as the 3-month period preceding Pre Q1. cAnnual costs by disease stage; quarterly costs for end-of-life analysis.
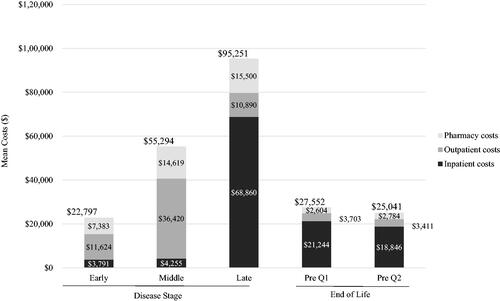
Figure 4. Mean healthcare costs by disease stage and at end of life (Huntington’s disease-related)a–e. aLate-stage disease markers identified first: nursing home, feeding tube, incontinence, bedsore, hospice care, at least two falls within a 1-month period, and dysphagia. Middle stage disease markers identified second: home assistance, physical therapy, dementia, gait disorder, dysarthria, speech therapy, and having two falls in a 1-month period. Beneficiaries without late or middle stage disease markers were defined as early-stage disease. bAt the end of life, Pre Q1 was defined as the 3-month period immediately preceding death and Pre Q2 was defined as the 3-month period preceding Pre Q1. cAnnual costs by disease stage; quarterly costs for end-of-life analysis. dHD-related: any utilization related to HD diagnosis or symptoms associated with HD. eCosts reported for full HD pharmacy category including: tetrabenazine, deutetrabenazine, neuroleptics, amantadine, riluzole, donepezil, minocycline, nabilone, coenzyme Q10, and energy metabolites.
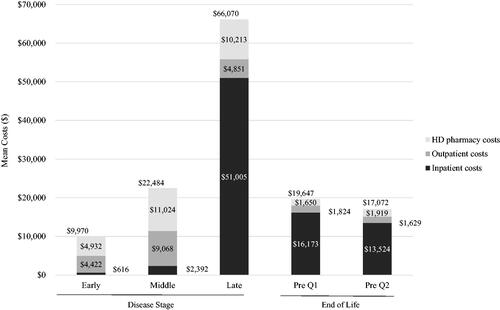
Table 3. Baseline characteristics among Medicaid beneficiaries with Huntington’s disease, by disease stage and at end of life.
Table 4. Healthcare utilization and costs among Medicaid beneficiaries with Huntington’s disease, by disease stage and at end of life.
Huntington’s disease at the end-of-life
In the end-of-life analysis, we identified 5,699 beneficiaries with a diagnosis of HD between 1 January 2010 and 31 December 2014. Of these beneficiaries, 1,247 died between 1 January 2011 and 31 December 2014. Among deceased HD beneficiaries, 128 were non-dual eligible and had 1 year of continuous enrollment in FFS prior to the date of death (baseline period). Mean (SD) age was 51.2 (11.7) years, 63.3% were female, and number of chronic conditions in the baseline was 4.9 (2.3). A high proportion of beneficiaries reported HD symptoms during baseline (96.9%) (). Use of HD treatment and all-cause hospitalizations in the last quarter before death occurred in 60.9% and 33.6% of beneficiaries, respectively; mean (SD) total costs were $27,552 ($15,649) in that same time period (, ). While mean (SD) HD-related costs were $19,647 ($13,943) in the quarter preceding death and $17,072 ($14,078) the quarter prior, primarily driven by HD-related inpatient costs ($16,173 [$12,769] and $13,524 [$12,052], respectively) ().
Discussion
This study provides more recent, comprehensive estimates of healthcare utilization and costs associated with the management of HD than prior analyses in Medicaid populations. We found that the Medicaid beneficiaries with HD have higher inpatient hospitalizations and ED visits as compared to beneficiaries without HD. Furthermore, beneficiaries with HD had higher use of antidepressants, anxiolytics, and anti-epileptics compared to those without HD, which reflects the prevalence of neuropsychiatric symptoms that have been reported in patients with HDCitation18–21. The higher healthcare utilization among HD-beneficiaries translated to healthcare costs nearly 3-times that of matched beneficiaries without HD (all-cause annual total cost: $73,087 vs. $26,834 for beneficiaries with and without HD, respectively), driven by use of inpatient services such as acute hospitalizations, SNF, and hospice care. This is consistent with prior work that has showed patients with HD are admitted to a hospice at a younger age compared to other patientsCitation22.
As would be expected with a progressive degenerative condition, healthcare utilization and costs tended to increase with disease severity, with beneficiaries at late disease stage having more than thrice the cost burden than those with middle-stage HD (HD-related annual total cost: $22,484 for middle-stage HD vs. $66,070 for late-stage HD). The primary driver of cost being inpatient hospitalizations, SNF, and hospice care ($2,392 for middle-stage HD vs. $51,005 for late-stage HD). In addition, beneficiaries with HD who died during the study period had elevated healthcare utilization and costs in the final few months before death, mainly driven by inpatient services. Furthermore, in HD beneficiaries with late-stage disease and at the end of life, total HD-related costs were substantial, and accounted for approximately 70% of total all-cause costs. In comparison, total HD-related costs accounted for 44% and 41% of total all-cause costs for early- and middle-stage beneficiaries, respectively, further illustrating the substantial increase in economic burden associated HD as the disease progresses. These findings indicate that delaying the disease progression through early diagnosis and early initiation of therapy and management may alleviate the burden of HD on the beneficiaries and their families, as well as the healthcare system in the US.
The findings of this study highlight the significant economic burden of HD in the Medicaid population and are consistent with the findings of previous studies from the US and Europe. In a retrospective study by Divino et al. the direct healthcare costs among Medicaid and commercially insured HD beneficiaries were estimated to be between $3,257–4,947 USD in early stages, rising steeply to $22,582–$37,495 USD in late stages (annualized cost per beneficiary), between 2002–2009Citation6. The authors reported highest total costs among Medicaid beneficiaries with late-stage HD. Our study showed a similar trend of increasing costs by disease stage; however, our cost estimates associated with HD are higher than those presented in this prior study. The reason for this difference is unclear but could be attributed to more recent cost estimates in our study (adjusted to 2014 US dollars), to varied calculation methods (the prior study annualized costs), or to compositional differences between the cohorts (e.g. the HD sample in our study had a higher proportion of female patients). Moreover, in our study, the inpatient hospitalizations contributed as the major healthcare cost component as against the outpatient costs which were the primary cost drivers in the Divino 2013 studyCitation6. This difference may be due to insurance coverage, as long-term care (e.g. hospice care and SNF) is not fully captured in commercial claims and the majority of patients in the Divino et al. study were commercially-insured. The vast majority of the Medicaid beneficiaries in the Divino 2013 study were in the late disease stage, a pattern similar to our study. The authors have acknowledged that this could be partially attributed to the fact that the beneficiaries are eligible to enter a Medicaid system only after exhausting all other resourcesCitation6.
In a recent international survey, direct medical costs of patients with HD increased with disease severity, also driven by hospitalizations and residential care costs; additionally, indirect medical costs accounted for the 66–84% of total costs driven by lost work productivity and informal careCitation23. In another UK study, the average annual cost per person with HD was estimated to be £21,605, with informal care being the major cost driverCitation9. Although we did not assess the burden of informal care or other societal costs, which could be substantial in more severely affected beneficiaries suffering from chronic neurodegenerative disorders such as HD, the use of SNF and hospice care was observed in 79% and 15% of beneficiaries with late-stage HD, respectively. One prior study showed that 54.4% of hospitalized HD patients were discharged to long-term care facilities due to disability later in the course of diseaseCitation24. Additionally, a 2019 literature review reported that costs at the end of life accounted for 13–25% of the overall expenditures, which is consistent with our findings of elevated costs in the final months of deceased Medicaid beneficiariesCitation25. Finally, all-cause costs reported in our study are higher than those previously reported in other neurodegenerative diseases. In a recent 2020 study, beneficiaries with Parkinson’s disease were estimated to have annual direct medical costs of $24,439 (2017 US dollars)Citation26. Furthermore, an earlier 2010 claims analysis estimated the annual all-cause cost burden in patients with multiple sclerosis to be $18,829 (adjusted to 2010 US dollars); this would approximately be $20,442 in 2014 US dollarsCitation27.
The strengths of this analysis are derived from the use of claims databases, which reduce responder bias as compared to the surveys. Furthermore, this study provides comprehensive estimates in the Medicaid population using the most recently available MAX data, shedding light on the economic burden of HD in comparison to those without HD, and by disease stage and at the end-of-life. However, there are limitations to this study. First, although we used the most recently available Medicaid claims data, covering 2010–2014, CMS has since phased out the MAX data and the analyses cannot be easily updated. Nonetheless, the Medicaid population is uniquely vulnerable and often overlooked in studies of HD. Second, due to CMS policies we are unable to report median values. CMS seeks to protect the confidentiality of Medicare and Medicaid beneficiaries by avoiding the release of information that can be used to identify individual beneficiariesCitation28,Citation29. Median values cannot be reported as they represent individual patients and any reporting that could identify (whether directly or indirectly) a beneficiary is prohibited as a part of the research agreementCitation28,Citation29. Additionally, extreme values (e.g. minimum, maximum, median, mode, percentiles) in the output are restricted by CMS and only approved on a case-by-case basisCitation30. Third, administrative claims are intended for billing purposes and are subject to coding errors. Fourth, our study did not address functional status, which may provide further insight to late-stage and end-of-life burden of HD, or informal (or indirect) costs, which have been shown to be a significant driver of costs in HD outside of the USCitation9. Fifth, as this was a descriptive study with the aim of estimating costs and describing utilization of Medicaid beneficiaries with HD, we did not apply a log or gamma model for costs, or model costs in any way. Our goal was to describe actual costs in various stages of the disease, rather than predict these costs or identify characteristics associated with higher costs. We did not adjust for patient characteristics in our comparison of HD stages, because these characteristics are inherently different across groups. We used a comparison group of age, gender, region, and year matched patients to provide estimates of cost and utilization in a disease-free population. Sixth, as in prior studies our eligibility criteria only required one diagnosis of HD, instead of a second confirmatory diagnosisCitation6,Citation10,Citation11. While both underreporting (mild cases) and misdiagnosis may exist in our cohort, this identification approach has been commonly used by previous claims analyses for rare diseases such as HDCitation6,Citation10,Citation11. Finally, this study analyzed a database of Medicaid beneficiaries in 17 States; thus, the study results may not be generalizable to other Medicaid populations in the US.
Conclusions
This resource utilization and direct healthcare cost analysis establishes a substantial economic burden associated with HD in the Medicaid population, notable during the late stage of the disease and at end of life. While this study provides direct estimates of healthcare burden among Medicaid-HD beneficiaries, future studies are needed to account for the indirect-costs associated with lost productivity, informal care, and other societal costs in HD. Furthermore, there is a need for more recent and better-quality data with which to study the burden of neurologic disorders.
Transparency
Declaration of funding
This research was sponsored by Genentech, Inc. and funded by F. Hoffmann-La Roche Ltd.
Declaration of financial/other relationships
AP is an employee and shareholder of Genentech, Inc.
EC, and CP are employees of PHAR, which was paid by Genentech, Inc., to conduct the research described in the manuscript, and reports other relevant financial activities with AbbVie, Akcea, Amgen, AstraZeneca, Boston Scientific Corporation, Eisai, Greenwich Biosciences, Helsinn, Jazz, Novartis, Otsuka, Prothena, Recordati, Regeneron, Sage, Sanofi US Services, Sunovion, and Takeda Pharmaceuticals USA outside the submitted work.
SR was an employee of PHAR at the time of this study, which was paid by Genentech, Inc., to conduct the research described in the manuscript, and reports other relevant financial activities with AbbVie, Akcea, Amgen, AstraZeneca, Boston Scientific Corporation, Eisai, Greenwich Biosciences, Helsinn, Jazz, Novartis, Otsuka, Prothena, Recordati, Regeneron, Sage, Sanofi US Services, Sunovion, and Takeda Pharmaceuticals USA outside the submitted work.
Author contributions
All authors fulfilled the ICMJE authorship requirements.
Reviewer disclosures
Peer reviewers on this manuscript have no relevant financial or other relationships to disclose.
Previous presentations
Figures and tables in this manuscript have been included in posters presented at the 2021 American Academy of Managed Care Pharmacy (AMCP) annual conference.
Acknowledgements
None reported.
Data availability statement
Data is available from the Centers for Medicare and Medicaid Services (CMS).
References
- National Institutes of Health. Huntington’s disease: Hope Through Research. 2020. https://www.ninds.nih.gov/disorders/patient-caregiver-education/hope-through-research/huntingtons-disease-hope-through
- Paoli RA, Botturi A, Ciammola A, et al. Neuropsychiatric burden in Huntington’s disease. Brain Sci. 2017;7:67.
- Exuzides A, Reddy SR, Chang E, et al. Epidemiology of Huntington’s disease in the United States Medicare and Medicaid populations. Neuroepidemiology. 2022;56(3):192–200. doi: 10.1159/000524732.
- Pringsheim T, Wiltshire K, Day L, et al. The incidence and prevalence of Huntington’s disease: a systematic review and meta-analysis. Mov Disord. 2012;27(9):1083–1091. doi: 10.1002/mds.25075.
- Keum JW, Shin A, Gillis T, et al. The HTT CAG-Expansion mutation determines age at death but not disease duration in Huntington disease. Am J Hum Genet. 2016;98(2):287–298. doi: 10.1016/j.ajhg.2015.12.018.
- Divino V, DeKoven M, Warner JH, et al. The direct medical costs of Huntington’s disease by stage. A retrospective commercial and Medicaid claims data analysis. J Med Econ. 2013;16(8):1043–1050. doi: 10.3111/13696998.2013.818545.
- Dorey J, Tedroff J, Squitieri F, et al. J21 European-Huntington’s disease burden study (EURO-HDB) - Preliminary results for Italy and France. J Neurol Neurosurg Psychiatry. 2010;81(Suppl 1):A45.3–A46. doi: 10.1136/jnnp.2010.222661.21.
- Gooch CL, Pracht E, Borenstein AR. The burden of neurological disease in the United States: a summary report and call to action: burden of neurological disease. Ann Neurol. 2017;81(4):479–484. doi: 10.1002/ana.24897.
- Jones C, Busse M, Quinn L, et al. The societal cost of Huntington’s disease: are we underestimating the burden? Eur J Neurol. 2016;23(10):1588–1590. doi: 10.1111/ene.13107.
- Anderson KE, Divino V, DeKoven M, et al. Interventional differences among Huntington’s disease patients by disease progression in commercial and Medicaid populations. J Huntingtons Dis. 2014;3(4):355–363. doi: 10.3233/JHD-140124.
- Sung VW, Iyer RG, Gandhi SK, et al. Retrospective analysis of healthcare resource use, treatment patterns, and treatment-related events in patients with Huntington’s disease-associated chorea initiated on tetrabenazine. J Health Econ Outcomes Res. 2018;6(1):15–24. doi: 10.36469/9779.
- Exuzides A, Reddy SR, Chang E, et al. Healthcare utilization and cost burden of Huntington’s disease among Medicare beneficiaries in the United States. J Med Econ. 2021;24(1):1327–1336. doi: 10.1080/13696998.2021.2002579.
- Exuzides A, To TM, Abbass IM, et al. Healthcare resource utilization and costs in individuals with huntington’s disease by disease stage in a US population. J Med Econ. 2022;25(1):722–729. doi: 10.1080/13696998.2022.2076997.
- To TM, Exuzides A, Abbass IM, et al. Health care resource utilization and costs among individuals with vs without huntington disease in a US population. J Manag Care Spec Pharm. 2022;28:1228–1239.
- Mendizabal A, Ngo Vu A-T, Thibault D, et al. Hospitalizations of children with huntington’s disease in the United States. Mov Disord Clin Pract. 2017;4(5):682–688. doi: 10.1002/mdc3.12506.
- U.S. Bureau of Labor Statistics, Division of Consumer Prices and Price Indexes. Consumer Price Index. U.S. Bureau of Labor Statistics. 2021. https://www.bls.gov/cpi/
- Vandenbroucke JP, von Elm E, Altman DG, et al. Strengthening the reporting of observational studies in epidemiology (STROBE): explanation and elaboration. PLoS Med. 2007;4(10):e297. doi: 10.1371/journal.pmed.0040297.
- Anderson KE, van Duijn E, Craufurd D, et al. Clinical management of neuropsychiatric symptoms of Huntington disease: expert-Based consensus guidelines on agitation, anxiety, apathy, psychosis and sleep disorders. J Huntingtons Dis. 2018;7(3):355–366. doi: 10.3233/JHD-180293.
- Ishihara L, Oliveri D, Wild EJ. Neuropsychiatric comorbidities in Huntington’s and Parkinson’s disease: a United States claims database analysis. Ann Clin Transl Neurol. 2021;8(1):126–137. doi: 10.1002/acn3.51252.
- Paulsen JS, Nehl C, Hoth KF, et al. Depression and stages of Huntington’s disease. J Neuropsychiatry Clin Neurosci. 2005;17(4):496–502. doi: 10.1176/jnp.17.4.496.
- Epping EA, Paulsen JS. Depression in the early stages of Huntington disease. Neurodegener Dis Manag. 2011;1(5):407–414. doi: 10.2217/nmt.11.45.
- Johnson MO, Frank S, Mendlik M, et al. Utilization of hospice services in a population of patients with Huntington’s disease. J Pain Symptom Manage. 2018;55(2):440–443. doi: 10.1016/j.jpainsymman.2017.09.004.
- Rodríguez‐Santana I, Mestre T, Squitieri F, et al. Economic burden of Huntington’s disease in Europe and the USA: results from the Huntington’s disease burden of illness study (HDBOI). Euro J of Neurol. 2023;30(4):1109–1117. doi: 10.1111/ene.15645.
- Dubinsky RM. No going home for hospitalized Huntington’s disease patients. Mov Disord. 2005;20(10):1316–1322. doi: 10.1002/mds.20589.
- Duncan I, Ahmed T, Dove H, et al. Medicare cost at end of life. Am J Hosp Palliat Care. 2019;36(8):705–710. doi: 10.1177/1049909119836204.
- Yang W, Hamilton JL, Kopil C, et al. Current and projected future economic burden of parkinson’s disease in the U.S. NPJ Parkinsons Dis. 2020;6:15. doi: 10.1038/s41531-020-0117-1.
- Asche CV, Singer ME, Jhaveri M, et al. All-cause health care utilization and costs associated with newly diagnosed multiple sclerosis in the United States. J Manag Care Pharm. 2010;16(9):703–712. doi: 10.18553/jmcp.2010.16.9.703.
- ResDAC. RIF Data Use Agreement (DUA). ResDAC. 2022. https://resdac.org/request-form/rif-data-use-agreement
- ResDAC. Waruiru Mburu. CMS Cell Size Suppression Policy. ResDAC. 2017. https://resdac.org/articles/cms-cell-size-suppression-policy
- Chronic Conditions Warehouse. Chronic conditions warehouse virtual research data center: data output review process. West Des Moines, IA: Chronic Conditions Warehouse; 2023.