
Abstract
Objectives
To assess the cost-effectiveness of transarterial radioembolization (TARE) versus conventional transarterial chemoembolization (cTACE) and drug-eluting beads chemoembolization (DEE-TACE) for patients with unresectable early- to intermediate-stage hepatocellular carcinoma (HCC).
Design
A cohort-based Markov model with a five-year time horizon was developed to evaluate the cost-effectiveness of the three embolization treatments. Upon entering the model, patients with HCC received either TARE or one of the two other embolization treatments. Patients remained in a “watch and wait” state for tumor downstaging that allowed them to move to health states such as liver transplant, resection, systemic therapies, or cure. Clinical input parameters were retrieved from the published literature, and where values could not be sourced, assumptions were made and validated by clinical experts. Health benefits were quantified using quality-adjusted life years (QALYs). Cost input parameters were obtained from various sources, including the Medicare Cost Report, IBM® Micromedex RED BOOK, and published literature.
Results
At five years, TARE was found to be cost-saving (saving $15,779 per person compared to cTACE) and produced 0.33 more QALYs per person than cTACE. TARE cost $13,696 more but produced 0.33 more QALYs than DEE-TACE, with an incremental cost-effectiveness ratio of $41,474 per QALY gained at five years. After accounting for parameter uncertainty, the likelihood of TARE being cost-effective was at least 90% against all comparators at a cost-effectiveness threshold of $100,000 per QALY gained.
Conclusions
TARE produces more QALYs than cTACE and DEE-TACE, with a high probability of being cost-effective against both comparators.
PLAIN LANGUAGE SUMMARY
The Barcelona Clinic Liver Cancer guideline recommends the use of transarterial radioembolization (TARE), conventional (cTACE), or drug-eluting bead transarterial chemoembolization (DEE-TACE) for treating hepatocellular carcinoma (HCC). This study evaluated the cost-effectiveness of TARE versus two alternative embolization treatments (cTACE and DEE-TACE) in treating patients with unresectable early- to intermediate-stage HCC.
A cohort-based Markov model was developed to analyze the costs and benefits of these treatments from a US healthcare perspective within a 5-year time horizon. A 20-year time horizon was assessed as a scenario. In the model, patients were assigned to receive TARE, cTACE, or DEE-TACE and remained in the “watch and wait” stage for tumor downstaging. Data used in the model was taken from previous studies and in consultation with clinical experts. The benefits of the treatments were measured by considering the impact on the patient’s quality of life. The costs associated with the treatments were obtained from various sources, including reports, publicly available databases, and published literature.
The findings show that TARE is not only cost-saving compared to cTACE but also results in a higher number of quality-adjusted life years (QALYs) per person. While TARE was more expensive than DEE-TACE, it produced more QALYs, further indicating more favorable patient outcomes and overall treatment effectiveness. These findings could potentially impact resource allocation and decision-making for the treatment of HCC.
Introduction
The economic burden of hepatocellular carcinoma (HCC) is substantial, with median costs of HCC care of $6,279 per patient-month of observation, across different stages and treatmentsCitation1. For patients with unresectable HCC or contraindication to surgical intervention, systemic or locoregional therapy may be treatment optionsCitation2. The Barcelona Clinic Liver Cancer (BCLC) recommends conventional (cTACE) or drug-eluting bead transarterial chemoembolization (DEE-TACE)Citation3. However, transarterial radioembolization (TARE) is increasingly recognized as an alternative to cTACE or DEE-TACE, with TheraSphere Y-90 Glass Microspheres recently receiving FDA approval for the treatment of unresectable HCCCitation4,Citation5.
TARE was proven clinically superior to comparators in a randomized controlled trial (RCT) and a propensity score-matched study, where TARE has been shown to prolong the time to progression and improve overall survival (OS)Citation6–8. Furthermore, patients who received TARE with glass microspheres had a prolonged duration of responseCitation9 and an increased likelihood of downstaging compared to those who received cTACECitation10. In addition, the long-term clinical outcomes of transplant patients who receive TARE are favorable, with 3-, 5-, and 10-year OS rates after liver transplantation of 84%, 77%, and 60%, respectivelyCitation11.
Cost-effectiveness analyses (CEA) examine the health and monetary consequences of at least two interventions, providing valuable information for resource allocation and decision-making. Given the multitude of treatment options for HCC, a CEA is warranted. While an economic evaluation of chemoembolization and radioembolization has been performed from a United Kingdom (UK) healthcare perspectiveCitation12, costs, treatment pathways, and resource use vary between the US and UK healthcare systemsCitation13. Hence, the results from the UK may not accurately inform the current US healthcare decisions.
Previous US evaluations are either datedCitation14 or have focused on a different patient population, specifically those with advanced and locally advanced HCC, and compared TARE to sorafenibCitation13. Consequently, the findings from this study may not directly apply to the early to intermediate-stage HCC population targeted in this study. Additionally, as the upfront cost per TARE treatment exceeds that of DEE-TACE and cTACE, it is important to model the average number of treatments required and subsequent outcomes of TARE in an up-to-date US-specific economic evaluation, which is warranted in this contemporary era of increased TARE utilization and an indication for unresectable HCC. This study aims to compare the cost-effectiveness of TARE with Y-90 glass microspheres to cTACE and DEE-TACE in patients with early to intermediate HCC from a US perspective.
Methods
Model structure
A UK cohort-based Markov modelCitation12 was adapted to a US healthcare perspective. The model was chosen due to its ability to capture the dynamic progression of disease and transitions between health states over time. The existing health states are defined based on clinical characteristics and prognosis, and patients can transition between them based on probabilities linked to disease progression or treatment response. Institutional Review Board (IRB) approval was not required for this work.
The model structure () was developed in Microsoft Excel and was based on a simplified clinical pathway of 1,000 HCC patients aged 65 and above. Each health state represents a possible consequence of the intervention being analyzed. Upon entering the model, patients had unresectable early- to intermediate-stage HCC (BCLC stage A or B).
Figure 1. Markov model structure for TARE cost-effectiveness analysis. Abbreviations. Post-transplant: is made up of three states where people only stay for one cycle; Dead state, People can enter this state at any point. People enter the model in the “watch and wait” state after receiving treatment, where they either stay in this state or have a resection, liver transplant, or systemic therapy. People stay in the “resection” state for one cycle only. When in the “pre-transplant” health state, people can either move into a “post-transplant” state or to “systemic therapy”.
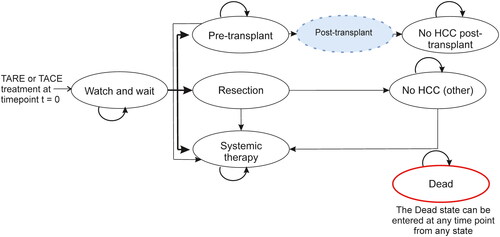
Patients received treatment (either TARE or one of two comparators: cTACE or DEE-TACE) and entered the “watch and wait” health state while being under observation of whether their tumors were downstaged, in which case those patients were considered for potentially curative treatment. Downstaging was defined by a change in United Network for Organ Sharing (UNOS) status from T3 to T2. Patients able to receive curative treatment either had a resection or were considered for the liver-transplant waiting list. The “pre-liver transplant” health state included the six-month mandatory waiting period for a HCC exception scoreCitation15. Simplifying assumptions were made, including that liver transplants are curative (assuming there was no HCC recurrence after a successful liver transplant), and patients could experience HCC recurrence after resection but were assumed to receive no further curative interventions (patients could receive best supportive care (BSC) or systemic therapy only). Patients in remission did not need further treatment and were moved into the “no HCC (other)” health state for the remainder of their lifetime. Patients not in remission, not eligible for resection or transplant, or with cancer progression, received systemic therapies or BSC for the remainder of their lifetime.
The model followed the cohort over a five-year time horizonCitation16. A four-week cycle length was used to capture the movement of patients between health states, and a 3% discount rate was applied to costs and quality-adjusted life years (QALYs), aligning with recommendations for methodological practices of cost-effectiveness analyses in the USCitation17.
Key model inputs
Transition probabilities
The four-week probability of moving between health states was based on Lewandowski et al.Citation10 and expert clinical opinions (). After receiving treatment and entering the “watch and wait” health state, patients were assumed to have a 19% probability of leaving this state during each cycle, based on a median follow-up time before observing whether downstaging was successful at 3.1 monthsCitation10. An assumption was made that the follow-up time was the same for TARE, cTACE and DEE-TACE due to a lack of available data for all three treatments. The probabilities of being considered for receiving potentially curative treatment (either resection or liver transplant health states) rather than treatment with systemic therapies were 58% for those treated with TARE and 31% for the other treatmentsCitation18. An assumption was made that the probabilities associated with DEE-TACE were equivalent to those for cTACE since direct and robust US comparative downstaging evidence for DEE-TACE (compared with TARE) specific to the population modeled is not available. When looking at a broader population of people with HCC, a meta-analysis has indicated that DEE-TACE is not superior to c-TACE in terms of survival and tumor response rateCitation19. Similar results were found in a study focusing on an Italian populationCitation20.
Table 1. Key Markov model inputs for TARE cost-effectiveness analysis study.
The type of embolization treatment was assumed to have no effect on the post-transplant, post-resection, or systemic therapy outcomes. Therefore, the remainder of the transition probabilities between subsequent health states were equal between TARE and all comparators. Specifically, for all patients, those selected for curative treatment were split equally (50% in each) into resection and transplant health statesCitation21. The probability (4.7%) of an HCC patient moving from the pre-transplant to post-transplant health state was determined by clinical opinion based on the time on the waiting list. Additionally, 20% of patients were assumed to progress while on the transplant list (equivalent to 0.9% every four weeks), after which the patient received systemic therapy or BSC, based on clinical opinion. Three post-transplant tunnel health states were included in the model to represent differences in health state costs and resource use in the first three months following a transplant.
Health-Related quality of life (HRQoL)
Each model health state was assigned a utility ranging from zero (death) to one (perfect health) sourced from Lim et al. and the phase 3 lenvatinib trial “REFLECT”Citation22,Citation23. This was done in an attempt to represent differences in the “benefit” or “preference” for different health statesCitation24. The values were adjusted as the population aged using sex-adjusted valuesCitation25 to ensure that the utility values decreased accordingly as patients in the model aged (). Due to limited data for each health state, the utility values for a patient in a “watch and wait,” “pre-liver transplant,” “post-transplant (no HCC),” or “resection” state were assumed to be the same as the utility values of a patient in a pre-progressed cancer state.
Mortality
Patients in each health state had a non-zero death probability before the next cycleCitation26–29. Mortality in the model was based on health states and was treatment independent. All-cause age-adjusted background mortality rates in the model were based on the US life tables (sources included in )Citation30. All the rates were converted to probabilities for use in the model.
Cost inputs
In this analysis, costs represent direct costs to the hospital (e.g. device, drug acquisition costs, costs to treat adverse events and monitoring costs). Cost inputs were obtained from multiple sources such as Medicare Cost Reports (MCR)Citation31, IBM® Micromedex RED BOOK OnlineCitation32, and published literature. The hospital-specific cost-to-charge ratios for the pertinent cost centers were applied to the billed charges in the MCR. The breakdown of the costs is detailed in the supplementary material (Tables S1–S5). All cost inputs were adjusted to 2021 US dollars using the US consumer price indexCitation33.
Health state resource use
Health resource utilization assumptions associated with each health state were established from a cross-sectional online survey conducted in September 2021 with a convenience sample of 25 US healthcare providers treating or managing HCC patients recruited via Sermo, an online global physician platformCitation34. The sample comprised of medical oncologists, hepatologists, interventional radiologists, radiation oncologists, and nurses. Survey questions were closed-ended and all survey data results were validated by two physicians (Supplementary material Table S6–S11). The responses determined the frequency of physician visits, laboratory tests, and hospitalizations every four weeks in each health state.
On average, 1.5 DEE-TACE treatments and 3 TACE treatments per person was assumed. This was based on expert clinical opinion and falls between published values of 1.4 and 2.8 per patient for DEE-TACE patients and between 2.50 and 3.03 for cTACE patientsCitation35.
Treatment-Related adverse events
Data on Grade 3 and 4 treatment-related adverse events that occurred in at least 5% of people in either the intervention or comparator arm were retrieved from the literature and included in the model (Supplementary Material Table S12). A 0.014 utility decrement was associated with each adverse event to capture the reduction in HRQoL that results from adverse events following a previously published reportCitation22.
Economic model outcomes
Benefits were quantified using QALYs, which capture the increase in years lived, adjusted for the utility of the health state in which those years are lived. QALYs combine the changes in both the quality and quantity of life associated with an interventionCitation36. Differences in QALYs associated with different treatments can then be compared to differences in the costs of those treatments through the incremental cost-effectiveness ratio (ICER), which is calculated as the difference in cost divided by the difference in QALYs, and is typically described as the cost per QALY gained for a particular treatmentCitation37. If the ICER is less than the willingness-to-pay threshold (WTP) (in this instance, $100,000 per QALY gained), the intervention is considered cost-effective. A WTP of $100,000 per QALY is a common threshold used to evaluate oncology treatmentCitation38. Further model outputs generated included life-years gained (LYG) and clinical breakdowns, such as the number of patients successfully downstaged.
Scenario and threshold analysis
Various scenarios were explored to understand the effects of different input values on the deterministic results (supplementary material Table S13). Threshold analyses were conducted to determine the point at which the model conclusions changed when varying model inputs, such as the patient split between liver transplant and resection and the probability of recurrence post-resection.
Deterministic and Probabilistic sensitivity analysis
Deterministic sensitivity analysis (DSA), in the form of a tornado diagram, was performed to identify the key drivers of the model. Individual inputs were varied one at a time while holding others constant, and the change in the ICER was plotted. The data ranges were assumed to be 20% above and below the mean where clinically plausible. Two-way DSA was conducted by simultaneously varying two input variables. Probabilistic sensitivity analysis (PSA) was also performed to account for multivariate and stochastic parameter uncertainty in the model. This involved randomly generating input values from probability distributions assigned to each input and recording the resulting cost-effectiveness results. Results for 1,000 model simulations were generated and used to estimate a probabilistic ICER and the probability that TARE was cost-effective at the given threshold versus the comparators.
Results
In the probabilistic pairwise results (), TARE was dominant compared with cTACE at five years as it was less costly ($15,779) and produced 0.33 more QALYs per person than cTACE. TARE was $13,696 more costly per person than DEE-TACE but produced 0.33 more QALYs per person, with a probabilistic ICER of $41,474 per QALY gained over a five-year time horizon (the base case). Over five years, the likelihood of TARE being cost-effective was at least 90.8% against all comparators at a WTP threshold of $100,000/QALY (). A breakdown of costs (Table S14) and the cumulative costs per person (Figure S1) over the five-year time horizon are provided.
Figure 2. Incremental cost-effectiveness planes and acceptability curves (TARE versus each comparator). (A,B) Incremental cost-effectiveness planes for probabilistic sensitivity analysis for TARE versus (A) cTACE and (B) DEE-TACE. Cost-effectiveness threshold at $100,000 is presented. (C,D) Cost-effectiveness acceptability curve for TARE versus (C) cTACE and (D) DEE-TACE. Abbreviations. cTACE, conventional transarterial chemoembolization; DEE-TACE, Drug-eluting bead transarterial chemoembolization; QALYs, quality-adjusted life-years.
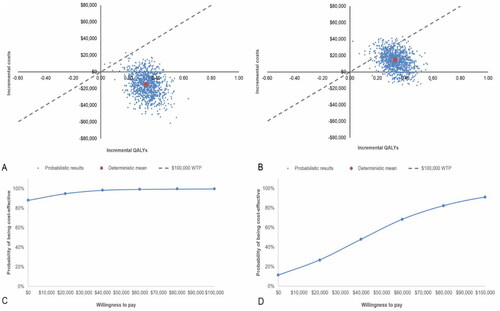
Table 2. Probabilistic model results at 5 and 20 years (results presented as mean and 95% Credible intervals).
Patients treated with TARE gained 2.29 life years compared with 1.83 life-years for all comparators over the five-year time horizon (2.17 compared with 1.75 when discounted), with higher life-year gains starting in year one. The model demonstrated that TARE led to 87% more patients being eligible for liver transplant or resection compared to all comparators.
When a lifetime (20-year) time horizon was applied, the conclusions remained consistent with the five-year horizon results, with the DEE-TACE ICER reduced by approximately $6,000 per QALY gained to $34,834 per QALY gained.
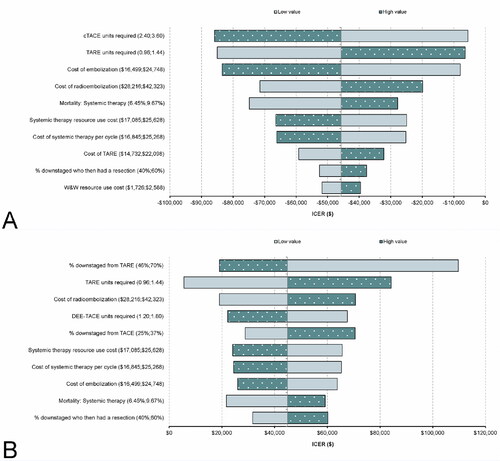
The five-year deterministic results are presented in Table S15 of the supplementary material. In the tornado diagrams, the key drivers of the deterministic results were the number of treatments required (for both comparisons) and the proportion of people whose tumor was downstaged by TARE (in the DEE-TACE arm) ().
Figure 3. Deterministic sensitivity analysis results (TARE versus each comparator). (A) Tornado diagram for TARE versus cTACE; (B) Tornado diagram for TARE versus DEE-TACE. Abbreviations. cTACE, conventional transarterial chemoembolization; DEE-TACE, Drug-eluting bead transarterial chemoembolization; ICER, Incremental cost-effective ratio.
Two of the scenarios evaluating the impact of varying the model inputs on the cost-effectiveness of TARE versus the comparators changed the conclusions of the model (). One of these was the scenario comparing TARE and DEE-TACE, where the proportion downstaged reduced to 31% and 17%, respectively, resulting in an ICER of $124,821 per QALY gained over a five-year time horizon. The second was applying systemic therapy costs as a one-off cost upon entering the “systemic therapy” health state (based on treatment duration) rather than assuming an ongoing cost per cycle. TARE remained cost-effective compared to cTACE, but the ICER increased to $102,991 per QALY gained over a five-year time horizon when compared to DEE-TACE. However, over a time horizon of 20 years, TARE remained cost-effective compared to cTACE and DEE-TACE in both scenarios.
Table 3. Model scenario and threshold results (TARE versus each comparator, five-year time horizon unless otherwise stated).
In the threshold analysis, TARE remained cost-effective compared to DEE-TACE when, of those in whom downstaging was successful, the proportion of people who became eligible for a transplant (versus resection) was more than 19.9%. When compared to cTACE, TARE was cost-effective regardless of the proportion who became eligible for transplant versus resection. Furthermore, TARE remained a cost-effective therapy to alternative therapies (cTACE and DEE-TACE) regardless of the proportion of patients with cancer recurrence post-resection ().
The two-way DSA examined the variation in the number of TARE and TACE treatments (Table S16). When the number of TARE units was fixed at 1.5 treatments, it remained a cost-effective therapy when at least 2 cTACE treatments were administered. Additionally, TARE remained cost-effective when the number of TARE treatments increased to 2, and the number of cTACE treatments was 3 or more. Compared to DEE-TACE, TARE remained cost-effective as long as the number of TARE treatments was 1.5 and at least 1.5 DEE-TACE treatments were required.
The proportion of individuals who entered the transplant pathway (versus resection) and the waiting time to transplant were evaluated using a second two-way DSA. TARE was cost-effective against cTACE at waitlist times of up to 30 months, regardless of the proportion of individuals who had a transplant. Moreover, TARE remained a cost-effective option against DEE-TACE at waitlist times for up to 30 months, provided that more than 19% of patients followed the transplant pathway.
Discussion
This study demonstrated that TARE was cost-effective when compared with cTACE and DEE-TACE in patients with unresectable early-to intermediate stage HCC from a US healthcare perspective. These results support several economic advantages for the treatment of patients with HCC. In the base case, over a five-year time horizon, TARE was estimated to be 5% less costly than cTACE (incremental cost: $15,779) and 5% more costly than DEE-TACE (incremental cost: $13,696) once post-procedural costs were accounted for. TARE produced 0.33 more QALYs than all comparators, with a 90% probability of cost-effectiveness. TARE was estimated to dominate cTACE at year one and be cost-effective from year two compared to DEE-TACE. In the model, TARE led to 87% more patients eligible for transplants and resections when compared with cTACE and DEE-TACE and provided an extra 0.46 undiscounted life years.
TARE was associated with cost savings of $15,779 per patient over the five-year time horizon compared with cTACE. While costs in the “post-transplant” and “resection” health states were greater for TARE than comparators (due to more people becoming eligible for a potentially curative treatment), TARE had lower costs in the systemic therapy health state (from reduced systemic therapy costs) and the “watch and wait” health state (since this state is predominantly made up of treatment costs). These savings, as well as those from reducing mortality (a reduction in end-of-life costs), outweighed the costs incurred by additional liver transplants and resections.
TARE was approximately $14,000 more costly per patient than DEE-TACE. This was largely due to the lower number of DEE-TACE treatments compared with cTACE (an average of 1.5 DEE-TACE treatments versus 3 cTACE treatments were used in this model). This led to the five-year costs in the “watch and wait” health state being more than $28,000 more expensive per person for those treated with TARE compared to DEE-TACE. It should be noted that the average number of embolization treatments was linked only to costs in the model and was assumed to be independent of downstaging rates. Each TACE treatment was associated with an embolization cost of more than $20,500 per patient; as such, the number of treatments required was a key driver of the model results.
A further sensitivity analysis involved changing the waiting times for a liver transplant, given the impact of the COVID-19 pandemic on treatment delaysCitation39 and the high geographical variability in waiting times (expert clinical opinion suggested waiting times could vary from six months in Midwestern states to 30 months in New York and California). When varying the waiting times and the proportion of patients in the model who followed the transplant pathway, TARE dominated cTACE. In addition, TARE was cost-effective compared to DEE-TACE, when more than 19% of patients followed the transplant pathway. Assumptions around no recurrence post-transplant might favor TARE, however, it is highly unlikely that alternative assumptions around this area of the model are likely to alter the conclusion of these findings – that TARE is cost-effective in early- to intermediate-stage HCC population.
In addition, the downstaging rates from Lewandowski et al. were varied as part of the deterministic scenario analyses (see ). The overall conclusion was unchanged (TARE remained a dominant treatment versus cTACE and cost-effective versus DEE-TACE), except for when the proportion of people who successfully downstaged were reduced simultaneously to 31% for TARE and 17% for DEE-TACE. The increased ICER is due to a smaller difference in downstaging between the arms. However, this scenario was based on a very low sample size (n = 5 for TARE and n = 12 for DEE-TACE) and based on people who were downstaged at nine months, leading to this being a very conservative and uncertain scenario. Utility values for each health state were also varied in the deterministic sensitivity analysis and made minimal differences to the results (i.e. they did not make enough difference to become visible in the tornado diagram).
One further scenario had an impact on the cost-effectiveness of TARE compared with DEE-TACE over a five-year time horizon. This was applying a one-off cost of systemic therapy (based on treatment duration) when people move into the “systemic therapy” health state rather than assuming an ongoing weighted average cycle cost until death (not based on treatment duration). However, the ICER is only just above the $100,000 per QALY threshold ($102,991), and TARE remains cost-effective when running this scenario over a 20-year time horizon.
While a five-year time horizon was chosen as the base case for this analysis, it could be argued that a 20-year time horizon would be more appropriate, given the chronic nature of HCC. A five-year time horizon was chosen after extensive consultations with clinicians who treat patients diagnosed with HCC, who highlighted that most survival benefits associated with the interventions occurred within the initial five-year period following treatment.
While previous health economic evaluations have been conducted for TARE, many of these studies either focused on a more advanced HCC population with alternative treatments were conducted from a healthcare system that may not be generalizable to the US (e.g. UK healthcare system) or exist in the grey literature onlyCitation35,Citation40–42. One study evaluated the cost-effectiveness of TARE versus TACE from a US Medicare perspective but was critiqued for the lack of detailCitation14,Citation35. Another cost study compared the cost of SIRT with chemoembolization, and more than one-third of simulations produced results consistent with these findings that SIRT is the less expensive therapy due to the number of treatmentsCitation43. This study completed a rigorous comparative analysis of TARE versus cTACE and DEE-TACE from a US healthcare perspective. This paper used the same methodology as a previously published paper from the UKCitation12 but considered the mandatory wait time for the HCC exception score and used US-specific costs and resource utilization data.
A strength of this model is that all input parameters were validated by clinicians, thus strengthening the internal validity of the results. Additionally, the model underwent both internal technical validation and external validity of the cost results, further increasing the reliability of the findings. The manuscript was appraised using the Consolidated Health Economic Evaluation Reporting Standards (CHEERS) checklist, which encourages comprehensive reporting of economic evaluationsCitation44 (Supplementary Material). Furthermore, inputs such as health state utility values were selected based on data from REFLECT, a global RCT comparing sorafenib with lenvatinib that included patients from the USCitation45. Therefore, the results from this cost-effectiveness analysis are generalizable to the US population.
This CEA model has some limitations. First, due to limited data from head-to-head studies, it was challenging to compare TARE with other therapies for HCC. Transarterial embolization (TAE) was considered a comparator in the analysis, but a lack of comparative data between TARE and TAE led to its exclusion. Furthermore, a recent Y-90 study, DOSISPHERECitation46, investigated a new method of personalized dosing (PDA) and demonstrated a median OS of 26.6 months in the PDA arm compared with 10.7 months in the standard dosing arm in a group of patients with advanced HCC, was not included in the model. The exclusion of these results could lead to an underestimation of the clinical benefits of TARE. A second recent study, TRACE, was not incorporated into the model, which compared TARE with DEE-TACE. While the study’s interim analysis included a small sample size (n = 38), the results were consistent with Lewandowski et al.’s findings, indicating TARE was superior to DEE-TACE in terms of tumor control, overall survival and successful downstaging for liver transplantation (TARE arm: n = 10 vs. DEE-TACE arm: n = 4).
Second, this model does not include indirect and societal costs that may be incurred outside the hospital system, such as patient out-of-pocket costs or costs paid by Medicaid. However, since TARE requires fewer procedures than TACE, it is likely that lower indirect and societal costs are incurred compared with embolization treatments that require multiple treatments. Moreover, the higher likelihood of being eligible for curative treatment (estimated at 87% in this study) may result in a lower care burden for patients treated with TARE, as fewer patients would move on to palliative treatment (systemic therapy or BSC). While these factors were not accounted for in this model, they could influence the cost-effectiveness of TARE versus alternative embolization therapies. Therefore, future economic evaluations should be conducted to evaluate the cost-effectiveness of TARE versus alternative embolization therapies from a societal perspective.
Third, the cost of TARE and embolization was calculated using the MCR, which may contain unaudited and potentially missing cost data. However, MCR remains the most appropriate data for estimating the cost of TARE and embolization treatment in hospitals, given the lack of alternative data sources. Further to this, the 30%–70% split between Medicare and commercial insurance to calculate the cost of radioembolization was based on extensive consultations with clinical experts, reimbursement specialists, and Medicare analysts who possess in-depth knowledge and experience in the treatment of HCC across different healthcare settings. To account for any uncertainty, the cost of radioembolization was varied by 20% in the DSA (which ultimately reflects changes in the 30%–70% split). This is one of the key drivers of the model results, but this variation did not change the conclusions of the model.
Fourth, to simplify the model, cancer recurrence post-transplant or treatment with ablation was not included. While ablation is a potential alternative treatment for patients with early-stage HCC ineligible for liver transplantationCitation3, it may not always be a feasible option due to tumor size or locationCitation47, even though it is a less expensive strategyCitation43. Including ablation in the model would impact the cost-effectiveness of TARE as a smaller proportion of people would follow the transplant pathway, where, if people reach the “no HCC (post-transplant)” health state, they stay until death. The extent of this impact is unknown without further analysis. However, the existing scenario reducing the proportion of patients who have a transplant versus resection has demonstrated little impact on the cost-effectiveness conclusions until it reduces to under 19.9% (TARE versus DEE-TACE only). Future research focusing on the cost-effectiveness of TARE in only early-stage HCC patients should be considered.
Fifth, due to the paucity of evidence on resource utilization, an online survey was conducted to gather clinical opinions on healthcare-related resource utilization. While efforts were made to ensure the representativeness of the survey, the generalizability of the model findings may be limited, given the geographical variability of cancer treatment in the US. Future economic evaluations could consider regional differences, including regional costs and subgroup analyses in the cost-effectiveness of TARE.
Sixth, the use of a constant rate of mortality may only partially reflect the dynamic nature of mortality in real life, where mortality rates can vary over time. The maximum of the absolute mortality and the age and sex equivalent general population mortality was used in the model. The use of a constant rate of mortality for the “No HCC (post-transplant)” health state, derived from 5-year overall survival, may underestimate the long-term mortality after transplantation in the 20-year time horizon scenario, as it will not increase with age until it becomes the same as the general population mortality in the model.
Finally, the model assumed a mean number of 1.5 DEE-TACE procedures per person, which may be underestimated in real-world practice and equivalent to cTACE. However, this conservative assumption ultimately does not affect the conclusions of this study. Increasing the mean number of DEE-TACE procedures per person would increase the cost of the DEE-TACE pathway, making TARE more cost-effective.
Conclusion
This study demonstrates that in early- to intermediate-stage HCC patients eligible for embolization, TARE produces more QALYs than the alternative treatments, cTACE and DEE-TACE. TARE has the potential to be cost-effective against both cTACE and DEE-TACE and could enable more HCC patients to achieve curative resection or liver transplant, and therefore is an important treatment option in managing HCC.
Transparency
Author contributions
HD, HB, TB, SM, and HH were involved in the model design and development. HD, TB, and SM were involved in drafting and editing the manuscript. AW and NA were involved with model validation, data collection, drafting, and editing of the manuscript. MVP and OA were involved with model validation and manuscript editing and revision.
Reviewer disclosures
A reviewer on this manuscript has disclosed that they are and have been an employee of consultancy companies, they have received consultancy fees and expenses from Bayer and Sirtex for conducting economic evaluation for sorafenib and SIR-Spheres in advanced HCC, including manuscripts and HTA submissions previously.
Another reviewer has worked as a health economics consultant, I have worked on statistical analyses, economic modelling, manuscripts, HTA submissions for different stages of HCC for multiple products and multiple manufacturers previously. At present, they have no current ongoing work in HCC.
All the peer reviewers on this manuscript have received an honorarium from JME for their review work but have no other relevant financial relationships to disclose.
Previous presentations
This research was submitted and has been accepted for presentation at the Society of Interventional Oncology, Washington, DC, January 19–23, 2023, titled “Five-year Cost-effectiveness Analysis of Y-90 Glass Microspheres & Transarterial Chemotherapies for the Treatment of Intermediate-stage Hepatocellular Carcinoma”. It was also presented as a traditional poster for SIR 2022 Annual Scientific Meeting in Boston, June 11–16, 2022 (abstract number 556, titled “Cost-Effectiveness of Radioembolization with Y90 Glass Microspheres versus Transarterial Chemotherapies in the Treatment of Intermediate Stage Hepatocellular Carcinoma: A US Hospital Perspective”). The abstract can be found here: https://www.jvir.org/article/S1051-0443(22)00696-0/fulltext.
Supplemental Material
Download MS Word (27.9 KB)Supplemental Material
Download PDF (93.8 KB)Supplemental Material
Download MS Word (112.4 KB)Acknowledgements
The authors would like to acknowledge Rod Martin (for generating cost data), Joe Gardill (for validating cost data), Wendy Wifler, Liesl Hargens, and Alexa Da Silva for validating clinical care pathways of all modalities.
Declaration of funding
This study was supported by Boston Scientific.
Declaration of financial/other relationships
AOW and NA are full-time employees of Boston Scientific. OA and MVP are advisors and consultants for Boston Scientific. OA and MVP were not compensated for their participation in this study. HD, TB, HH, and SM are employees of York Health Economics Consortium, a consulting company paid by Boston Scientific for these services (consultancy, economic model adaptation, and drafting the manuscript) rendered. HB was an employee of the York Health Economics Consortium at the time the work was conducted.
Data availability statement
The data supporting the findings of this study are available upon reasonable request.
References
- Tapper EB, Catana AM, Sethi N, et al. Direct costs of care for hepatocellular carcinoma in patients with hepatitis C cirrhosis. Cancer. 2016;122(6):852–858. doi: 10.1002/cncr.29855.
- Brar G, Kesselman A, Malhotra A, et al. Redefining intermediate-stage HCC treatment in the era of immune therapies. J Clin Oncol Oncol Pract. 2022;18(1):35–41. doi: 10.1200/op.21.00227.
- Reig M, Forner A, Rimola J, et al. BCLC strategy for prognosis prediction and treatment recommendation barcelona clinic liver cancer (BCLC) staging system. The 2022 update. J Hepatol. 2022;76(3):681–693. doi: 10.1016/j.jhep.2021.11.018.
- Nazzal M, Gadani S, Said A, et al. Liver targeted therapies for hepatocellular carcinoma prior to transplant: contemporary management strategies. Glob Surg. 2018;4(1): doi: 10.15761/gos.1000171.
- Food and Drink Administration. Recently approved devices: therasphere – P200029. 2021. Available from: https://www.fda.gov/medical-devices/recently-approved-devices/theraspheretm-p200029.
- Kim MA, Jang H, Choi NR, et al. Yttrium-90 radioembolization is associated with better clinical outcomes in patients with hepatocellular carcinoma compared with conventional chemoembolization: a propensity score-matched study. J Hepatocell Carcinoma. 2021;8:1565–1577. doi: 10.2147/jhc.S335879.
- Salem R, Gordon AC, Mouli S, et al. Y90 radioembolization significantly prolongs time to progression compared with chemoembolization in patients with hepatocellular carcinoma. Gastroenterology. 2016;151(6):1155–1163 e2. doi: 10.1053/j.gastro.2016.08.029.
- Dhondt E, Lambert B, Hermie L, et al. 90Y radioembolization versus drug-eluting bead chemoembolization for unresectable hepatocellular carcinoma: results from the TRACE phase II randomized controlled trial. Radiology. 2022;303(3):699–710. doi: 10.1148/radiol.211806.
- Salem R, Johnson GE, Kim E, et al. Yttrium-90 radioembolization for the treatment of solitary, unresectable HCC: the LEGACY study. Hepatology. 2021;74(5):2342–2352. doi: 10.1002/hep.31819.
- Lewandowski RJ, Kulik LM, Riaz A, et al. A comparative analysis of transarterial downstaging for hepatocellular carcinoma: chemoembolization versus radioembolization. Am J Transplant. 2009;9(8):1920–1928. doi: 10.1111/j.1600-6143.2009.02695.x.
- Gabr A, Kulik L, Mouli S, et al. Liver transplantation following yttrium-90 radioembolization: 15-year experience in 207-Patient cohort. Hepatology. 2021;73(3):998–1010. doi: 10.1002/hep.31318.
- Manas D, Bell JK, Mealing S, et al. The cost-effectiveness of TheraSphere in patients with hepatocellular carcinoma who are eligible for transarterial embolization. Eur J Surg Oncol. 2021;47(2):401–408. doi: 10.1016/j.ejso.2020.08.027.
- Ham C. Money can’t buy you satisfaction. BMJ. 2005;330(7491):597–599. doi: 10.1136/bmj.330.7491.597.
- Rostambeigi N, Dekarske AS, Austin EE, et al. Cost effectiveness of radioembolization compared with conventional transarterial chemoembolization for treatment of hepatocellular carcinoma. J Vasc Interv Radiol. 2014;25(7):1075–1084. doi: 10.1016/j.jvir.2014.04.014.
- National Liver Review Board (NLRB). Guidance to liver transplant programs and the national liver review board for: adult MELD exceptions for hepatocellular carcinoma (HCC). 2022.
- Teyateeti A, Mahvash A, Long JP, et al. Survival outcomes for yttrium-90 transarterial radioembolization with and without sorafenib for unresectable hepatocellular carcinoma patients. J Hepatocell Carcinoma. 2020;7:117–131. doi: 10.2147/jhc.S248314.
- Sanders GD, Neumann PJ, Basu A, et al. Recommendations for conduct, methodological practices, and reporting of cost-effectiveness analyses: second panel on cost-effectiveness in health and medicine. JAMA. 2016;316(10):1093–1103. doi: 10.1001/jama.2016.12195.
- Lewandowski RJ, Gabr A, Abouchaleh N, et al. Radiation segmentectomy: Potential curative therapy for early hepatocellular carcinoma. Radiology. 2018;287(3):1050–1058. doi: 10.1148/radiol.2018171768.
- Facciorusso A, Di Maso M, Muscatiello N. Drug-eluting beads versus conventional chemoembolization for the treatment of unresectable hepatocellular carcinoma: a meta-analysis. Dig Liver Dis. 2016;48(6):571–577. doi: 10.1016/j.dld.2016.02.005.
- Golfieri R, Giampalma E, Renzulli M, et al. Randomised controlled trial of doxorubicin-eluting beads vs conventional chemoembolisation for hepatocellular carcinoma. Br J Cancer. 2014;111(2):255–264. doi: 10.1038/bjc.2014.199.
- Seshadri RM, Besur S, Niemeyer DJ, et al. Survival analysis of patients with stage I and II hepatocellular carcinoma after a liver transplantation or liver resection. HPB. 2014;16(12):1102–1109. doi: 10.1111/hpb.12300.
- National Institute for Health and Care Excellence. Lenvatinib for advanced, unresectable, untreated hepatocellular carcinoma [ID1089]. London: National Institute for Health and Care Excellence; 2018.
- Lim KC, Wang VW, Siddiqui FJ, et al. Cost-effectiveness analysis of liver resection versus transplantation for early hepatocellular carcinoma within the milan criteria. Hepatology. 2015;61(1):227–237. doi: 10.1002/hep.27135.
- York Health Economics Consortium. Utility. 2016. Available from: https://yhec.co.uk/glossary/utility/.
- Jiang R, Janssen MFB, Pickard AS. US population norms for the EQ-5D-5L and comparison of norms from face-to-face and online samples. Qual Life Res. 2021;30(3):803–816. doi: 10.1007/s11136-020-02650-y.
- UNOS. OPTN Metrics (Liver): UNOS. 2021 [cited 2021 Oct]. Available from: https://insights.unos.org/OPTN-metrics/.
- Llovet JM, Ricci S, Mazzaferro V, et al. Sorafenib in advanced hepatocellular carcinoma. N Engl J Med. 2008;359(4):378–390. doi: 10.1056/NEJMoa0708857.
- Bellavance EC, Lumpkins KM, Mentha G, et al. Surgical management of early-stage hepatocellular carcinoma: resection or transplantation? J Gastrointest Surg. 2008;12(10):1699–1708. doi: 10.1007/s11605-008-0652-2.
- Bentley TS, Ortner N. 2020 U.S. organ and tissue transplants: cost estimates, discussion, and emerging issues. Milliman Research Report; Seattle, WA; 2020.
- Arias E. United States Life. Tables, 2017. National vital statistics reports: from the centers for disease control and prevention, national center for health statistics. Natl Vital Stat Sys. 2019;68(7):1–66.
- Centers for Medicare & Medicaid Services. Healthcare cost report information system. 2020 [cited 2021 June]. Available from: https://www.cms.gov/.
- IBM. IBM Micromedex RED BOOK. Colorado: IBM. 2021 [cited 2021 March]. Available from: https://www.ibm.com/uk-en/products/micromedex-red-book.
- U.S. Bureau of Labor Statistics. CPI inflation calculator. 2021 [cited 2021 June]. Available from: https://www.bls.gov/data/inflation_calculator.htm.
- Sermo. 2022 [cited 2022 Jan 18]. Available from: https://www.sermo.com/.
- Walton M, Wade R, Claxton L, et al. Selective internal radiation therapies for unresectable early-, intermediate- or advanced-stage hepatocellular carcinoma: systematic review, network meta-analysis and economic evaluation. Health Technol Assess. 2020;24(48):1–264. doi: 10.3310/hta24480.
- York Health Economics Consortium. Quality-adjusted life year. 2016. Available from: https://yhec.co.uk/glossary/quality-adjusted-life-year-qaly/.
- York Health Economics Consortium. Incremental cost-effectiveness ratio. 2016. Available from: https://yhec.co.uk/glossary/incremental-cost-effectiveness-ratio-icer/.
- Neumann PJ, Cohen JT, Weinstein MC. Updating cost-effectiveness–the curious resilience of the $50,000-per-QALY threshold. N Engl J Med. 2014;371(9):796–797. doi: 10.1056/NEJMp1405158.
- American Association for Cancer Research. AACR report on the impact of COVID-19 on cancer research and patient care. Clin Cancer Res. 2022;28(4):609–610.
- Muszbek N, Remak E, Evans R, et al. Cost-utility analysis of selective internal radiation therapy with Y-90 resin microspheres in hepatocellular carcinoma. Future Oncol. 2021;17(9):1055–1068. doi: 10.2217/fon-2020-1004.
- Rognoni C, Ciani O, Sommariva S, et al. Real-World data for the evaluation of transarterial radioembolization versus sorafenib in hepatocellular carcinoma: a cost-effectiveness analysis. Value Health. 2017;20(3):336–344. doi: 10.1016/j.jval.2016.09.2397.
- Marqueen KE, Kim E, Ang C, et al. Cost-Effectiveness analysis of selective internal radiotherapy with yttrium-90 versus sorafenib in locally advanced hepatocellular carcinoma. J Clin Oncol Oncol Pract. 2021;17(2):e266–e277. doi: 10.1200/OP.20.00443.
- Ray CE Jr, Battaglia C, Libby AM, et al. Interventional radiologic treatment of hepatocellular carcinoma-a cost analysis from the payer perspective. J Vasc Interv Radiol. 2012;23(3):306–314. doi: 10.1016/j.jvir.2011.11.016.
- Husereau D, Drummond M, Augustovski F, et al. Consolidated health economic evaluation reporting standards 2022 (CHEERS 2022) statement: updated reporting guidance for health economic evaluations. Value Health. 2022;25(1):3–9. doi: 10.1016/j.jval.2021.11.1351.
- Kudo M, Finn RS, Qin S, et al. Lenvatinib versus sorafenib in first-line treatment of patients with unresectable hepatocellular carcinoma: a randomised phase 3 non-inferiority trial. Lancet. 2018;391(10126):1163–1173. doi: 10.1016/s0140-6736(18)30207-1.
- Garin E, Tselikas L, Guiu B, et al. Personalised versus standard dosimetry approach of selective internal radiation therapy in patients with locally advanced hepatocellular carcinoma (DOSISPHERE-01): a randomised, multicentre, open-label phase 2 trial. Lancet Gastroenterol Hepatol. 2021;6(1):17–29. doi: 10.1016/s2468-1253(20)30290-9.
- Rhim H, Lim HK. Radiofrequency ablation of hepatocellular carcinoma: pros and cons. Gut Liver. 2010;4(Suppl 1):S113–S8. doi: 10.5009/gnl.2010.4.S1.S113.