
Abstract
Objective
Nivolumab plus ipilimumab (NIVO + IPI) and pembrolizumab plus axitinib (PEM + AXI) have demonstrated significant clinical benefits as first-line (1 L) treatments for intermediate/poor-risk advanced renal cell carcinoma (aRCC) patients. This study aimed to assess the cost-effectiveness of NIVO + IPI versus PEM + AXI from a Brazilian private healthcare system perspective, utilizing a novel approach to estimate comparative efficacy between the treatments.
Methods
A three-state partitioned survival model (progression-free, progressed, and death) was developed to estimate costs, life-years (LYs), quality-adjusted LYs (QALYs), and the incremental cost-utility ratio (ICUR) over a 40-year time horizon. In the absence of head-to-head comparisons between NIVO + IPI and PEM + AXI, clinical data for NIVO + IPI was obtained from CheckMate 214 (NCT02231749) and for PEM + AXI from KEYNOTE-426 (NCT02853331). A matching-adjusted indirect comparison was conducted to account for the imbalance of treatment effect modifiers between the trials. Patient characteristics, resource use, health state utilities, and costs were based on Brazilian-specific sources. Costs and health outcomes were both discounted by 5% annually in line with Brazilian guidelines. The robustness of the results was evaluated through extensive sensitivity analysis and scenario analyses.
Results
When comparing the matched versus unmatched OS, PFS, and TTD curves there was no noteworthy difference. NIVO + IPI was associated with cost savings (R$ 350,232), higher LYs (5.54 vs. 4.61), and QALYs (4.74 vs. 3.76) versus PEM + AXI, resulting in NIVO + IPI dominating PEM + AXI. Key model drivers were the treatment duration for PEM, NIVO, and AXI. NIVO + IPI remained dominant in all scenario analyses, which indicated that model results were robust to alternative modelling inputs or assumptions.
Conclusions
This analysis shows that NIVO + IPI is estimated to be a life-extending and potentially cost-saving 1 L treatment option when compared with PEM + AXI for intermediate/poor-risk a RCC patients in the Brazilian private healthcare system.
PLAIN LANGUAGE SUMMARY
Nivolumab plus ipilimumab (NIVO+IPI) and pembrolizumab plus axitinib (PEM+AXI) are currently the two most prescribed therapies in the Brazilian private healthcare market for the first-line (1L) treatment of intermediate/poor-risk advanced renal cell carcinoma (RCC) patients. Given that financial resources are limited, economic evaluations are needed to enable Brazilian payers to make informed decisions.
In order to provide robust evidence on the relative costs and benefits of 1L RCC treatments in the Brazilian private healthcare system, the cost-effectiveness of NIVO+IPI versus PEM+AXI was evaluated using a three-state model. This model simulates the patient's journey, where a patient can remain free of disease progression, experience disease progression, or die. To reflect the Brazilian situation, patient characteristics, healthcare resource use and costs, and quality-of life data in the model were based on Brazilian sources.
NIVO+IPI and PEM+AXI have not been compared “head-to-head” in a clinical trial, therefore treatment efficacy was estimated using a matching-adjusted indirect comparison, a method that uses patient-level data from one trial (Checkmate 214) to match summary patient characteristics from the comparator trial (KEYNOTE-426), thus enabling a robust comparison.
Model results showed that NIVO+IPI was associated with cost savings (R$ 350,232), higher life-years (5.54 vs 4.61), and quality-adjusted life-years (4.74 vs 3.76) versus PEM+AXI, resulting in NIVO+IPI being less costly and providing more clinical benefits than PEM+AXI.
By showing that NIVO+IPI is a life-extending and cost-saving 1L treatment option when compared with PEM+AXI for intermediate/poor-risk aRCC patients, this study can help Brazilian payers make value-based choices on their resource allocation.
1. Introduction
Kidney cancer is the 13th most common cancer in Brazil with nearly 12,000 new cases reported in 2020Citation1, with renal cell carcinoma (RCC) accounting for around 3% of all cancersCitation2. When diagnosed in the early stages, standard treatment in Brazil includes radical nephrectomy or renal-sparing approachesCitation3. However, a significant proportion of patients with RCC are diagnosed in late stages; it is estimated that nearly 38% of patients with RCC in Brazil have advanced or metastatic renal cell carcinoma (aRCC) at diagnosisCitation4. For those patients, immunotherapy and targeted therapies, sometimes with radical nephrectomy, are the main treatment options, given that RCC is a chemotherapy-resistant tumorCitation5,Citation6.
First-line (1 L) treatment of aRCC is dependent on risk classification, based on the International Metastatic Renal Cell Carcinoma Database Consortium (IMDC) prognostic risk; a validated risk model that categorizes patients into favorable, intermediate, and poor-risk groups according to the number of risk factors at diagnosisCitation7–9. Given that aRCC is incurable, treatment selection in the 1 L setting is of critical importance, as in most cases, and the aim of treatment is to slow the progression of the disease alleviate symptoms and improve quality of lifeCitation10.
In Brazil, 1 L treatment options recommended in the Brazilian Society of Clinical Oncology (SBOC) guidelines for intermediate or poor-risk patients with aRCC include the following options: nivolumab plus ipilimumab (NIVO + IPI), cabozantinib monotherapy, nivolumab plus cabozantinib, avelumab plus axitinib, and pembrolizumab plus axitinib (PEM + AXI)Citation11. In clinical practice, treatment of aRCC has evolved from tyrosine kinase inhibitor (TKI) monotherapy to immuno-oncology (IO) combination therapies, including the dual IO combination NIVO + IPI and the IO + TKI therapy PEM + AXI, which are currently the two most prescribed therapies in the Brazilian private health care market. TKI monotherapies such as sunitinib (SUN) and pazopanib (PAZ) are used as alternative options for those with no access to immunotherapyCitation5,Citation11.
CheckMate 214 (NCT02231749) and KEYNOTE-426 (NCT02853331) are phase 3, randomized, open-label studies comparing, respectively, NIVO + IPI and PEM + AXI to SUN monotherapy in aRCC patientsCitation12,Citation13. These trials were conducted with approval from a formal ethics review committee. Results for the intermediate/poor-risk population from the CheckMate 214 trial showed that among patients with previously untreated aRCC, treatment with NIVO + IPI resulted in superior overall survival (OS) compared to SUN (hazard ratio [HR] 0.68; 95% confidence interval [CI] 0.58–0.81)Citation14. Similarly, in the intermediate/poor-risk population, results from the KEYNOTE-426 trial indicated that patients treated with PEM + AXI had improved OS (HR, 0.64; 95% CI, 0.52–0.80) compared with patients treated with SUNCitation15,Citation16. Patients treated with NIVO + IPI (HR, 0.73; 95% CI, 0.61–0.87) or PEM + AXI (HR, 0.69; 95% CI, 0.56–0.84) also achieved a benefit in progression-free survival (PFS) compared to SUNCitation14–16.
In a setting of continuous technological and scientific development, the increase in costs caused by the inclusion of innovative treatments threatens the sustainability of healthcare delivery and the consequent financial constraints have caused wide variations in patterns of care for cancer patients in BrazilCitation10. Considering that financial resources are limited in healthcare systems, economic evaluations are needed to enable an adequate decision-making process for such innovative therapies.
Therefore, the aim of this study was to evaluate the cost-effectiveness of NIVO + IPI versus PEM + AXI as 1 L treatments for aRCC patients with intermediate/poor-risk from a Brazilian private healthcare system perspective. For the purpose of informing the cost-effectiveness analysis, estimates on the long-term comparative efficacy (OS and PFS) and treatment costs using the time to treatment discontinuation (TTD) for NIVO + IPI and PEM + AXI in the intermediate/poor-risk aRCC population are required. In the absence of head-to-head comparisons between NIVO + IPI and PEM + AXI, this analysis compared the two treatment regimens by means of a matching-adjusted indirect comparison (MAIC). A MAIC was conducted to adjust for the imbalance of treatment effect modifiers (TEMs) between the trials (i.e. an imbalance of population characteristics that alter the effect of treatment on relative outcomes) such that the treatment is more or less effective in one population. Subsequently, independent curves were fitted to account for the non-proportional hazards seen in CheckMate 214 and KEYNOTE-426 for all time-to-event outcomes.
2. Methods
2.1. Model overview
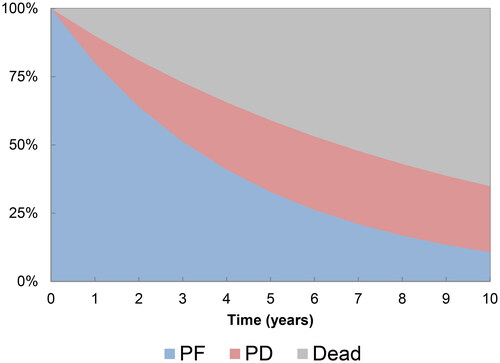
A partitioned survival model (PartSA) was developed in Microsoft Excel to evaluate the cost-effectiveness of NIVO + IPI versus PEM + AXI from a Brazilian private healthcare system perspective (). The model uses three health states: progression-free (PF), progressed disease (PD) and death. The health state occupancy is derived using an area-under-the-curve approach from matched OS and PFS curves derived from CheckMate 214 and KEYNOTE-426. The proportion of patients in the PD state was determined by the difference between the OS and PFS curves.
Figure 1. Model structure. Abbreviations. PF, progression-free state; PD, progressed disease state.
A lifetime horizon (40 years) was adopted to estimate the long-term differences in costs and outcomes to capture all relevant differences between the two treatmentsCitation17. A weekly cycle length with half-cycle correction was implemented to capture the rapid changes in survival over time and to accommodate the dosing regimens for NIVO + IPI and PEM + AXI.
Model outcomes included total healthcare costs, life-years (LYs), quality-adjusted LYs (QALYs), the incremental cost-utility ratio (ICUR), and the incremental cost-effectiveness ratio in terms of LYs gained (ICER). Cost and outcomes were discounted at a rate of 5% per year. All costs were reported in Brazilian Real (R$)Citation18.
2.2. Model inputs
2.2.1. Target population
The baseline characteristics at model entry were based on a study by Nardi et al. describing the demographic, clinical and pathological characteristics of RCC in BrazilCitation19 (mean age: 59.8 years; 58.9% male) and the Brazilian Institute of Geography and StatisticsCitation20 (mean weight: 73.1 kg) to reflect the intermediate/poor-risk aRCC population in Brazil.
2.2.2. Intervention and comparator
Treatment options included in the model were based on SBOC guidelines and those used in Brazilian clinical practice. To align with clinical practice, NIVO + IPI is compared to PEM + AXI in this analysis. The 60-month data cut from the CheckMate 214 trial has shown NIVO + IPI to achieve a median OS of 47.0 months (CI, 34.4–47.4)Citation21. Based on the latest published data from KEYNOTE-426 with a minimum follow-up of 23 months, median OS was not reached for PEM + AXI in the intention-to-treat (ITT) population and no information was provided for the intermediate/poor-risk population.
2.2.3. Matching adjusted indirect comparison of OS, PFS and TTD
Non-proportionality of hazards and heterogeneity of baseline characteristics are common challenges in current trials investigating IO treatments for aRCCCitation22. The proportional hazards (PH) assumption and population heterogeneity were addressed by means of an anchored MAIC using data from CheckMate 214 and KEYNOTE-426 to inform the comparative efficacy of NIVO + IPI versus PEM + AXI, using SUN as the common comparator. An anchored MAIC is a statistical method that estimates treatment effects in more comparable populations with regard to treatment effect modifiers by re-weighting the study population for which individual patient-level data (IPD) is available via propensity scores, thus minimizing biases and enabling more reliable treatment effect estimation. This method was chosen as it reduces heterogeneity in baseline characteristics between trials by means of matchingCitation23 and, in contrast to other standard methods for indirect treatment comparison, can also provide valid outcomes when the PH assumption is not met.
2.2.4. Data preparation and feasibility assessment
As IPD from KEYNOTE-426 trial were unavailable, Kaplan–Meier (KM) curves from the intermediate/poor-risk population of KEYNOTE-426Citation16 were digitized using the WebPlotDigitizerCitation24 and pseudo-IPD was reconstructed using the methodology from GuyotCitation25, an established web-based application for data extractionCitation26. Between-trial heterogeneity was assessed using published baseline characteristics of the KEYNOTE-426 trial overall population and CheckMate 214 IPD based on the most recent data cut (February 2021). Since baseline characteristics of the KEYNOTE-426 intermediate/poor-risk population were not published, it was assumed these were similar to the baseline characteristics of the overall KEYNOTE-426 trial population. While this assumption could not be tested for the KEYNOTE-426 trial, supporting evidence was found in the analysis of the CheckMate 214 data, which showed a similarity of characteristics, such as the site of metastatic locations, in the overall and intermediate/poor-risk populationCitation12.
2.2.5. Testing of treatment effect modifiers
The presence of TEMs was assessed for the CheckMate 214 trial intermediate/poor-risk population, with the intention to balance TEMs in KEYNOTE-426 and CheckMate 214 by means of matching. TEMs were defined as variables that influence the treatment effect of NIVO + IPI or SUN on OS. Variables that were prognostic for OS but did not affect the treatment effect were disregarded, as per published guidanceCitation23. Variable selection was based on available variables in the baseline characteristics in KEYNOTE-426, see . Multivariate survival analyses were conducted including each of the parameters explored as TEMs independently. Each survival analysis included a parameter for the potential TEM and an interaction term between treatment and the potential TEM. Both continuous and categorical parameters were tested. The coefficient of the interaction term indicated the size and direction of effect modification. TEMs with a statistically significance interaction term (p ≤ 0.05) or with a meaningful association level (p ≤ 0.25)Citation27 were selected for inclusion in the MAIC. This and all other statistical analyses were conducted in RCitation28.
Table 1. Treatment effect modifiers assessed in CheckMate 214 trial’s intermediate/poor-risk population.
2.2.6. Matching-adjusted indirect comparisons
Imbalances in TEMs may bias the comparison between the unadjusted populationsCitation23. To account for the issue of non-PH and imbalances in TEMs, MAICs were conducted, adjusting for differences in TEMs. Two MAICs were conducted using two different sets of TEMs, to assess the robustness of the analysis and sensitivity to the inclusion of different TEMs. The primary MAIC used the TEMs identified during the heterogeneity assessment, a scenario analysis used IMDC group, and baseline metastases as TEMs to align with a previously published MAIC of NIVO + IPI versus PEM + AXI in RCCCitation29. In both analyses, the MAIC was conducted by assigning weights to individual patients included in the CheckMate 214 trial in such a way, that a balance was achieved between the matched CheckMate 214 and KEYNOTE-426 populations with respect to the TEMs of interest. In addition to the two MAICs, a naïve comparison was conducted with no adjustment for imbalances in TEMs.
2.2.7. Survival analysis
The PH assumption within each trial was tested using available IPD from the intermediate/poor-risk population of CheckMate 214 and pseudo-IPD from the intermediate/poor-risk population of KEYNOTE-426. The log-cumulative hazards and Schoenfeld residual plots were visually assessed and the Grambsch Therneau test was conducted as a quantitative test for proportionality. Using the matched CheckMate 214 and KEYNOTE-426 data, OS, PFS, and TTD were analysed. While TTD data was not published for the intermediate/poor-risk 1 L aRCC population of the KEYNOTE-214 trial, PFS was used as a proxy to calculate costs for PEM + AXI as concurrence between PFS and TTD has been previously reported for the KEYNOTE-426 trialCitation30. As observed time-to-event (TTE) data was limited, long-term survival was extrapolated by fitting parametric survival curves to the data. Dependent models (i.e. models assuming one shared parametric shape) were not fitted, as the PH assumption had been rejected for all TTE outcomes. Instead, 13 independent models, seven standard parametric models (exponential, Weibull, Gompertz, log-logistic, log-normal, and [generalized] gamma), and six spline models (probit, odds and hazard, one or two knots) were fitted to the matched TTE data of CheckMate 214 and KEYNOTE-426 to estimate long-term OS, PFS, and TTD, using maximum likelihood estimation. Model selection was based on statistical fit (AIC and BIC), the visual fit of the trial data (survival and hazard curves) with the survival model, comparison to observed landmark survival estimates, and consideration of the model selections reported in previous HTA submissions in aRCCCitation31.
2.2.8. General population mortality
General population mortality was used to act as a lower bound for OS hazards, and PFS hazards could not exceed OS hazards at any time for any treatment in the model. Annual mortality according to age and sex was taken from Brazil’s IBGE general population mortality ratesCitation20. Age- and gender-adjusted mortality rates were calculated based on population characteristics from Nardi et al.Citation19 (mean age: 59.8 years; 58.9% male).
2.2.9. Quality of life
Health state utility estimates for each treatment were based on CheckMate 214 data. EQ-5D-3L health utility scores were calculated using Brazilian EQ-5D preference weightsCitation32. For the PF health state, this generated a treatment-specific utility for NIVO + IPI of 0.861. To date no statistically significant health-related quality of life benefit has been demonstrated for PEM + AXI versus SUNCitation31,Citation33–35, the utility for PEM + AXI was assumed to be equivalent to the utility estimated from CheckMate 214 for SUN (0.815). For the PD health state, the same approach was taken resulting in a utility of 0.837 for NIVO + IPI and 0.816 for PEM + AXI. Given that utility was treatment-specific, utility decrements due to adverse events (AEs) were not included in the analysis to avoid double counting. This is a conservative approach, given grade 3/4 AEs were less frequent for NIVO + IPI.
2.2.10. Resource use and costs
Cost estimates were derived based on the Brazil Supplementary healthcare perspective. Only direct medical costs were included in the analysis, these included the costs for treatment, follow-up, AEs, and subsequent treatment. The 1 L drug acquisition costs were estimated using the list prices for NIVO + IPI and PEM + AXI obtained from the official list published by the Câmara de Regulação do Mercado de Medicamentos with 18% state taxes (PF 18%) (CMED)Citation36 (). All possible formulations for each drug were considered and only the cheapest formulation was then used in the economic analysis as the cheapest formulation is recommended and used with the aim to reduce the overall budget impact. NIVO was administered 3 mg per kilogram of body weight with IPI being administered 1 mg per kilogram on the same day every 3 weeks followed by NIVO (240 mg) every 2 weeks or NIVO (480 mg) every 4 weeks. NIVO was administered for a maximum duration of 60 months in line with a previous cost-effectiveness studyCitation37 with IPI being stopped after four doses in line with the CheckMate 214 trial protocolCitation38. PEM was administered 200 mg every 3 weeks or 400 mg every 6 weeks with AXI being administered 5 mg orally twice daily. In line with the KEYNOTE-426 protocol, a stopping rule was implemented in the model whereby patients will not receive PEM beyond 24 months, patients can continue to remain on AXI until 60 months in line with a previous cost-effectiveness studyCitation37 or until disease progression or unacceptable toxicity, as per KEYNOTE-426 trial protocolCitation13.
Table 2. Drug acquisition costs for 1 L treatments (source: CMED 2022).
An administration cost of R$ 258.16 for intravenous treatments (NIVO, IPI and PEM) was included and obtained from the Classificação Brasileira Hierarquizada de Procedimentos Médicos (CBHPM)Citation39. No administration costs were applied for AXI as it is administered orally.
Disease management costs included costs for follow-up outpatient visits (medical visits and nurse/practitioner visits), monitoring tests, scans, hospitalization, and end-of-life care (). Based on clinical expert opinion, the time between follow-up visits varied throughout the disease management phase. Generally, these were more frequent during treatment initiation and became less frequent over time. For instance, clinical experts suggested that one medical visit would occur every three weeks for the first 12 weeks after treatment initiation followed by one medical visit every four weeks for the remainder of the time spent in the PF state. In the absence of robust clinical evidence and following expert opinion, the cost associated with the PD health state was assumed to be equal to the PF health state. The schedule of the follow-up visits and medical tests are detailed in the Supplementary Table S1.
Table 3. Follow-up visit and laboratory test unit costs.
The model accounted for the cost implications of treatment-related grade 3/4 AEs. No cutoff for AE incidence was used and the frequencies of occurrence of each event were obtained from the CheckMate 214 [12] and KEYNOTE-426Citation40 trials and reflect the proportion of patients experiencing the AE at least once. AE unit costs and incidence rates are presented in Supplementary Table S2.
Subsequent treatment costs were applied for patients who progressed after 1 L treatment based on data of subsequent treatment use from the CheckMate 214 and KEYNOTE-426 trials (Supplementary Table S3). Costs for each subsequent treatment option were calculated by multiplying the distribution of treatments received in subsequent lines by the weekly treatment cost and mean duration of treatment. The mean duration and distribution of subsequent treatment (16.9% NIVO, 48.4% SUN, 36.0% AXI, 36.0% PAZ) was based on a weighted average of all subsequent therapies following treatment with NIVO + IPI in CheckMate-214, and was assumed to be equal for both NIVO + IPI and PEM + AXI. Please note that the distribution of subsequent treatments exceeds 100% as some patients received multiple subsequent lines of treatments in the CheckMate 214 and KEYNOTE-426 trials.
2.2.11. Scenario and sensitivity analysis
To account for uncertainty around the results of the base case analysis, sensitivity analyses were conducted. A deterministic sensitivity analysis (DSA) was performed in order to understand the variables that most influenced the incremental cost and QALYs. Due to the correlation between survival parameters, survival parameters were not included in the DSA as independent parameters and were instead explored in the scenario analyses. The results from the DSA were presented in tornado diagrams, outlining the 10 most influential model inputs on costs and effects, respectively. Probabilistic sensitivity analyses (PSA) with 1,000 simulations were performed to explore the uncertainty around model inputs. The selection of the distribution for the probabilistic parameters was based on the most mathematically appropriate distribution. A gamma distribution was chosen for costs, a beta distribution was used for utilities and parameters related to the survival parametric distributions were based on the Cholesky decomposition method to account for the correlations. These simulations were plotted on a scatter plot presented on a cost-effectiveness plane (CEP) and the probability that each treatment is cost-effective at different levels of willingness-to-pay (WTP) per QALY was presented using a cost-effectiveness acceptability curve (CEAC). In the absence of a willingness to pay (WTP) threshold officially defined for the Brazilian private market, one time the gross domestic product (GDP) per capita was adopted as WTP similar to the CONITEC threshold recently instituted in Brazil. Given the GDP per capita for Brazil is R$40,133 as of 2021 (World Bank), this results in a WTP threshold of R$40,133.
To explore structural uncertainty related to assumptions and methodological choices, the following scenario analyses were conducted:
Adjusted survival curves based the 2nd best fitting distributions
Using the same parametric distributions for NIVO + IPI and PEM + AXI for OS (log-logistic), PFS (2-knots hazard spline), and TTD (1-knot odds spline), respectively
Adjusted survival curves based on MAIC using IMDC and baseline metastases as TEMs
Unadjusted (naïve) survival curves from CheckMate 214
Utility values for PEM + AXI are assumed to be equivalent to NIVO + IPI
No stopping rule for NIVO
Drug prices excluding value-added tax (VAT), to account for recent state exemptions applied to VAT (18%) for NIVO + IPICitation41
3. Results
3.1. Matching adjusted indirect comparison
3.1.1. Feasibility assessment
The similarity assessment highlighted the presence of heterogeneity for several potential treatment effect modifiers, including age, sarcomatoid features, lymph, lung bone and liver metastases, IMDC risk status and sex. Not all characteristics reported in CheckMate 214 could be assessed due to missing information on these characteristics in KEYNOTE-426 ().
3.1.2. Testing of TEMs and MAIC
The interaction analyses identified sarcomatoid features, age group, lymph metastases, IMDC group, and sex as variables with a meaningful association level with the treatment effect. Consequently, the CheckMate 214 population was reweighted to balance the baseline distribution of TEMs with the baseline distribution observed in KEYNOTE-426. The matching resulted in a sample with an estimated sample size (ESS) of N = 823 patients versus N = 847 in the unmatched population, constituting a minor reduction in sample size that would not hinder survival analysis. No patients with extreme weights were observed, and baseline characteristics of the matched population closely aligned with the KEYNOTE-426 baseline characteristics indicating a successful matching ().
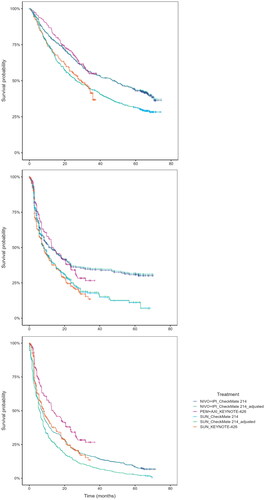
Comparison between the matched and the unmatched CheckMate 214 KM data showed minor differences for OS, PFS and TTD. Matched and unmatched OS curves showed no noteworthy difference, indicating that for a population comparable to that of KEYNOTE-426, the impact of treatment with NIVO + IPI and SUN is almost identical to that shown in the population included in the CheckMate 214 study itself, see . The matched PFS curves showed a slightly higher survival compared to the naïve unadjusted analysis, indicating for a population comparable to KEYNOTE-426, the PFS outcomes of treatment with NIVO + IPI and SUN would be slightly higher than in the CheckMate 214 population, see . The TTD curve was unaffected and showed little difference due to matching, see .
Figure 2. KM data for KEYNOTE-426 and matched and unmatched CheckMate 214; top: OS, middle: PFS, bottom: TTD.
3.1.3. Survival analysis
The assessment of the trial data indicated that the PH assumption may not hold in both clinical trials, as the results of the conducted assessments were conflicting. For the OS data, the log-cumulative hazards of CheckMate 214 and KEYNOTE-426 were not proportional and parallel, and Schoenfeld residual plots indicated a non-zero slope indicating the PH assumption was violated. The Grambsch Therneau test was significant for KEYNOTE-426. For the PFS data, the log-cumulative hazards and Schoenfeld residuals showed signs of non-proportionality as hazards crossed and residuals showed a non-zero trend. The Grambsch Therneau test was significant for CheckMate 214. The assessment concluded that a violation of PH for PFS and OS was likely. Independent extrapolation curves were fitted to the KM datasets and all parametric models converged (see Supplemental Figure S1). Based on statistical fit criteria (Akaike information criterion [AIC] and Bayesian information criterion [BIC], see Supplemental Table S4), visual model fit, validity of landmark survival, and considering the model selections and justification reported in a previous HTA submission in aRCCCitation31, the following models were selected for the extrapolation of observed time-to-event outcomes: log-logistic for OS with PEM + AXI, log-normal for OS with NIVO + IPI, 2-knots hazard spline for PFS and TTD with PEM + AXI, 2-knot hazard spline for PFS with NIVO + IPI, 2-knot hazard normal for TTD with NIVO + IPI (see ). Please note this figure demonstrates the model fit to the observed data; it does not take into account background mortality nor does it restrict PFS to OS.
Figure 3. Survival models used in the base case, fit the adjusted NIVO + IPI data and the PEM + AXI data from KEYNOTE-426; top: OS, middle: PFS, bottom: TTD.
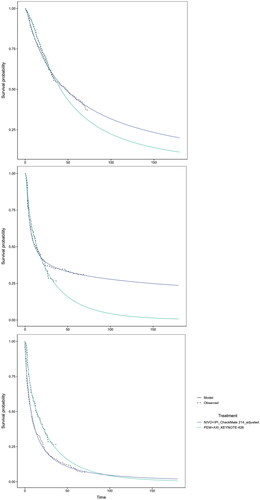
Table 4. Base case results.
3.1.4. Scenario analyses
Scenario analyses were conducted using (1) a different set of TEMs and (2) naïve comparison led to comparable results with only minor changes in survival estimates. TEMs matched in scenario 1 are described in , including their distributions in KEYNOTE-426 and CheckMate 214 trials matched and unmatched. The matched curves from scenario 1 and the unmatched curves from scenario 2 differed little from the base case (please find additional information in supplemental material Figure S2).
3.2. Economic model - base case
The economic model estimated 3- and 5-year PFS for NIVO + IPI at 35.8% and 31.7%, respectively. This is in line with the CheckMate 214 trial, where 3-year PFS was 34%, and 5-year PFS was 31%. Over a 40-year horizon, treatment with NIVO + IPI resulted in a (discounted) QALY gain of 0.98 and (discounted) cost savings of R$ 350,232 compared to PEM + AXI, resulting in NIVO + IPI dominating PEM + AXI (). The largest cost component for both treatments was drug acquisition costs (R$ 884,259 for NIVO + IPI and R$ 1,243,924 for PEM + AXI). It should be noted that drug acquisition costs for NIVO + IPI are highest during the initial phase of treatment due to the addition of IPI for a fixed treatment duration of 12 weeks. Although costs were higher for NIVO + IPI compared to PEM + AXI in the PF state (R$ 23,032 versus R$ 10,585, respectively), in part due to the increased time spent in the PF health state, this was offset by the higher treatment acquisition and PD health state cost associated with PEM + AXI. All other costs were similar across both treatments (supplementary Table S5). Patients treated with NIVO + IPI accumulated a higher proportion of QALYs in the PF health state than PEM + AXI and higher LYs, this is due to the plateau observed in the KM data for NIVO + IPI over longer follow-upCitation42, which to date has not been observed in published data for PEM + AXI.
3.3. Sensitivity and scenario analyses
3.3.1. One-way sensitivity analysis
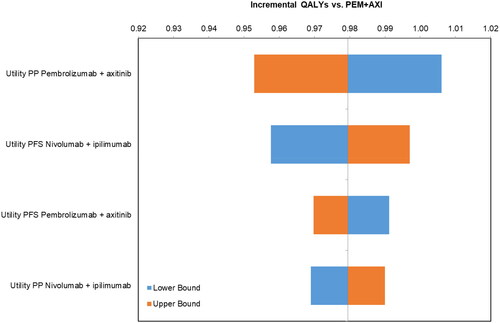
The DSA revealed that the most influential parameters for the incremental costs () were the maximum treatment duration for NIVO, PEM, and AXI. The most influential parameters for incremental QALYs were the utilities for both the PF and PD health states, with the post-progression utility for PEM + AXI being the most influential, followed by the PF utility for NIVO + IPI (). NIVO + IPI remained less costly and more effective than PEM + AXI for all parameters in the DSA.
Figure 4. Deterministic sensitivity analysis for NIVO + IPI vs PEM + AXI: incremental costs.
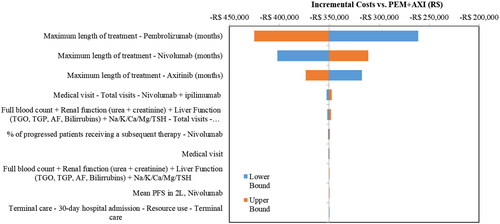
Figure 5. Deterministic sensitivity analysis for NIVO + IPI vs PEM + AXI: incremental QALYs.
3.3.2. Probabilistic sensitivity analysis
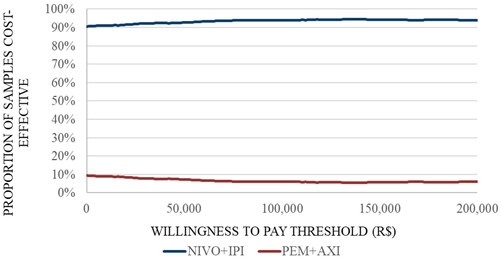
The results of the PSA showed that the majority of the simulations (76%) are in the south-east quadrant, indicating that NIVO + IPI is associated with lower costs and higher QALYs than PEM + AXI. However, there were also simulations (14.4%) in the south-west quadrant indicating that NIVO + IPI is cheaper but less effective and a small proportion of simulations in the north-east quadrant (7.5%) (). At the Brazilian WTP threshold of R$40,133, NIVO + IPI has a 93.6% probability of being cost-effective compared to PEM + AXI. ()
Figure 6. Scatter plot of incremental costs and QALYs of NIVO + IPI vs. PEM + AXI.
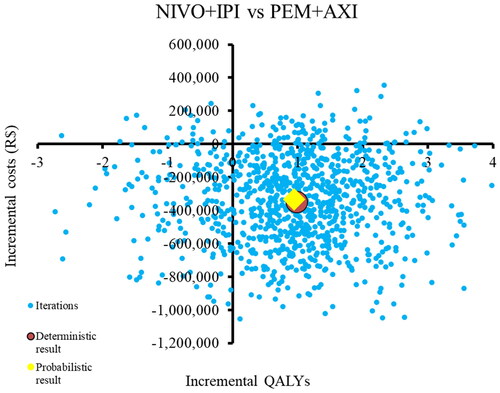
Figure 7. Cost-effectiveness acceptability curve.
3.3.3. Scenario analysis
The outcomes of all alternative scenarios confirmed the finding that NIVO + IPI was more effective and less costly compared to PEM + AXI. When the second best fitting set of parametric distributions was selected for extrapolating OS, PFS, and TTD, NIVO + IPI remained dominant. Implementing the same parametric distribution for NIVO + IPI and PEM + AXI for OS and PFS resulted in slightly lower incremental QALYs, however, NIVO + IPI remained dominant. Assuming no stopping rule for NIVO did result in higher total costs for NIVO + IPI compared to the base case results; however, these remained substantially lower than costs for PEM + AXI. When the same utility for PEM + AXI was applied compared to NIVO + IPI, incremental QALYs decreased slightly but remained positive. The results of the scenarios analyses are presented in supplementary Table S6.
4. Discussion
A PartSA model was developed to evaluate clinical and cost-effectiveness outcomes of NIVO + IPI and PEM + AXI for the treatment of intermediate/poor-risk patients with aRCC in Brazil. A MAIC was used to derive and extrapolate survival outcomes over a lifetime horizon using a comprehensive set of standard parametric and spline survival models, while accounting for differences in TEMs and violations of the PH assumptions in the trials. Previous studiesCitation30,Citation37,Citation43 have evaluated the cost-effectiveness of 1 L treatment options in aRCC in the intermediate/poor-risk population, but these analyses did not involve a novel approach to estimate survival parameters using an MAIC to account for differences in the patient characteristics between the CheckMate 214 and KEYNOTE-426 studies, nor did they use a perspective similar to that of Brazil.
In the deterministic base case analysis, NIVO + IPI was associated with lower total costs (R$ 1,030,547) compared to PEM + AXI (R$ 1,478,290). Treatment with NIVO + IPI also generated higher total LYs (5.54 vs 4.61) and QALYs (4.74 vs 3.76) than PEM + AXI. Therefore, NIVO + IPI dominated PEM + AXI, with cost savings of R$ 447,743 and 0.98 QALYs gained. The DSA showed that NIVO + IPI remained the dominant treatment option for all parameters included and identified treatment duration to be the most influential parameter for costs and treatment-specific utility to be the most influential parameter for QALYs. The results were shown to be robust in the PSA () and using a variety of scenario analyses.
There were some limitations to this study. Firstly, the model used expert opinion for some values which are not available from published sources, and assumptions were made where no published sources were available and expert opinion was limited. This included the assumption that patients in the PD health state would incur the same disease management costs as patients in the PF state. Given that patients treated with NIVO + IPI spend more time in the PF state and less time in the PD state than PEM + AXI, the total cost associated in the PF health state for PEM + AXI (R$ 14,315) are likely to be an underestimate, and the difference in incremental costs would be larger.
Secondly, KEYNOTE-426 survival data are relatively immature, leading to uncertain OS extrapolations for PEM + AXI. However, scenario analyses using different functional forms for the extrapolation did not change the overall conclusions of this study. Furthermore, PFS was used as a proxy for TTD to calculate drug costs for PEM + AXI, as no TTD KM curves had been published in an intermediate/poor-risk 1 L aRCC population for KEYNOTE-426. Assuming that treatment is immediately discontinued at disease progression may not be an accurate representation of clinical practice as patients may still be treated post-progression or discontinue treatment earlier than indicated by the PFS curve, for instance, due to AEs.
Lastly, the data-driven selection of TEMs for the MAIC may raise concerns regarding overfitting or exclusion of relevant parameters. However, the results of the MAIC were validated by two scenario analyses, an alternative MAIC and a naïve comparison, which lead to comparable results and indicate the robustness of the analyses. Limitations arise from the assumptions made surrounding the baseline characteristics of the intermediate/poor-risk population in KEYNOTE-426, for which no evidence was reported. Given the intermediate/poor-risk population makes up 69% of the ITT population from which the baseline characteristics were taken, large similarities in baseline characteristics may be reasonable. This was further strengthened by an analysis of CheckMate 214 baseline characteristics, which were shown to be similar across risk groups. Likewise, the matching of TEMs in CheckMate 214 to KEYNOTE-426 works with the underlying assumption that TEMs in CheckMate 214 play the same role as TEMs in KEYNOTE-426 and that all relevant TEMs have been identified and adjusted for. This assumption cannot be tested as IPD from KEYNOTE-426 was not available, and there may be a different set of TEMs that is of relevance in KEYNOTE-426. As for any MAIC, matching targets observed patient characteristics only, and cannot address potential differences in unobserved differences between trials or trial populations.
Although this analysis required input data from a MAIC of two separate RCTs, which is associated with inherent uncertainty, the findings of the MAIC are corroborated by a recently published study that evaluated real-world survival outcomes, adjusted using IPTW methods, in patients treated with first-line NIVO + IPI and PEM + AXI from the US FlatIron Database between 2018-22Citation44. Notably, the real-world PFS curves for the IMDC intermediate/poor-risk population showed an initial benefit in favour of PEM + AXI before the curves crossed in favour of NIVO + IPI thereafter at approximately 15 months. No apparent differences in the OS curves were shown in the study at 24 months, although the authors acknowledged that longer follow-up is necessary to discern emerging survival differences in their study, which had a median follow-up of 20.0 months (range: 0.2-47.6).
To our knowledge, there has been one previous study that has evaluated the cost-effectiveness of NIVO + IPI and PEM + AXI as 1 L treatment options for patients with intermediate/poor-risk aRCC in BrazilCitation45. Similar to the analysis presented in this paper, the authors also used a private healthcare system perspective and utilized a standard 3-state PSM model approach over a lifetime horizon. However, unlike this study, the authors followed several different approaches in methodology that might have led to an underestimation of the relative benefit for NIVO + IPI versus PEM + AXI and an overestimation of NIVO + IPI costs, impacting the ICUR. The analysis by Leonart-Garmetter et al. selected parametric survival curves for PFS and OS according to best statistical fit from the 2020 data cutoff from KN-426 and utilized HRs for NIVO + IPI versus PEM + AXI estimated from a previously published fixed-effect HR-based NMA of efficacy outcomes in first-line treatments for metastatic RCC that, as described in this paper, did not appropriately account for the time-varying hazards observed in the CM-214 studyCitation46. This NMA also refers to earlier datacuts of a different patient population (the ITT aRCC population) than the intermediate/poor-risk aRCC patient population from both the CM-214 (2018) and KN-426 (2019) studies and thus does not use the most relevant and up-to-date efficacy data to inform the relative efficacy of the two treatment regimens over a lifetime horizon. The use of PFS by the authors to estimate time-on-treatment for NIVO + IPI is inappropriate considering the treatment-free survival and treatment-free intervals previously demonstrated for NIVO + IPI, which might have led to an overestimation of treatment costsCitation47.
Three other previous studies have assessed the cost-effectiveness of these treatments within the same population from a US perspective. One study used a similar approach to estimate cost-effectiveness using a PartSA to directly capture the key clinical outcomes of PFS and OSCitation30, the other two studies leveraged a Markov modelCitation43 and a microsimulation to access the cost-effectiveness of NIVO + IPI and PEM + AXICitation37.
The study by Bensimon et al.Citation30 compared PEM + AXI with NIVO + IPI in the intermediate/poor-risk population in the US and found PEM + AXI to be more costly than NIVO + IPI and to generate more QALYs. There are some reasons why the findings from our study contrast those from Bensimon et al.Citation30 The main reason is the method used to estimate comparative efficacy. Treatment efficacy between NIVO + IPI and PEM + AXI was based on a HR derived from an NMA; however, the authors of the study did not assess the proportionality assumption, and the use of the HR-based NMA led to underpredicted published landmark OS and PFS data for NIVO + IPI. For example, their economic model estimated 3- and 5-year PFS for NIVO + IPI as 11% and 2.7%, respectively, while recent CheckMate 214 dataCitation48 show 3- and 5-year PFS for NIVO + IPI as approximately 34% (estimated based on KM data) and 31%, respectively, which is in line with the PFS estimated in this study. This demonstrates that the application of an HR-based NMA when the proportional hazards assumption is violated will result in unreliable lifetime survival and cost-effectiveness estimations.
Other cost-effectiveness studies in 1 L aRCC have followed different modeling approaches, and results for PEM + AXI, NIVO + IPI, and SUN have varied based on the approach taken. For example, Shay et al.Citation43 used a three-state Markov approach with a 10-year time horizon, and found NIVO + IPI to be the dominant treatment versus both PEM + AXI and AVE + AXI, which is consistent with the results of our study. Watson et al.Citation37 used a microsimulation model to compare the cost-effectiveness of PEM + AXI and NIVO + IPI in intermediate/poor-risk patients with aRCC using data from KEYNOTE-426 and CheckMate 214 and concluded that PEM + AXI is clinically more effective than NIVO + IPI. This is likely due to the underprediction of PFS for NIVO + IPI and overprediction of OS for PEM + AXI, as this study predicted PFS at 5 years for NIVO + IPI to be approximately 10% or lower, which is significantly lower than the 5-year PFS reported for CheckMate 214 (31%). The projected OS at 42 months was approximately 50% for NIVO + IPI and over 60% for PEM + AXI, in contrast to the 42-month reported OS in the respective trials (52% for NIVO + IPI and 51% for PEM + AXI).
In addition to the cost-effectiveness analysis comparing NIVO + IPI versus PEM + AXI that has been published for the Brazilian private marketCitation45, two separate analyses have been published that have compared the number needed to treat (NNT) and the cost of preventing an event (COPE) between these two treatments from a Brazilian private health care perspectiveCitation4,Citation5. Based on the latest available follow-up data from CheckMate 214 and KEYNOTE-426, treatment with NIVO + IPI resulted in lower COPE than PEM + AXI from month 18 onwards, driven by lower treatment costs and improved NNT over time with NIVO + IPICitation5. However, unlike the current study, both studies did not consider the longer term outcomes in terms of life-years and quality of life as captured by QALYs or the wider cost impact in terms of subsequent therapies, disease management or treatment-related AEs.
Conclusion
The findings from this study, which utilizes robust methods for adjusting for baseline differences between relevant clinical trials and extrapolating survival outcomes over a long-term horizon, indicate that NIVO + IPI offers cost saving and is more effective compared to PEM + AXI, and as such, is a promising 1 L treatment option for patients with intermediate/poor-risk aRCC in the private healthcare system in Brazil.
Transparency
Declaration of financial/other relationships
TCD, MD, JM, AS and APCO are employees of Bristol Myers Squibb. DM reports institutional and personal, paid and unpaid support for research, advisory boards, and consultancy Janssen, Bristol Myers Squibb, Bayer, Ferring, Pfizer.
Reviewer disclosures
A reviewer on this manuscript has disclosed they are an employee of a consulting firm that has received consultancy fees from a competing drug manufacturer. Peer reviewers on this manuscript have no other relevant financial relationships or otherwise to disclose.
Previous presentations
Poster at ISPOR 2023, available here: https://www.ispor.org/docs/default-source/intl2023/finalbmscolombiarccispor24042023oh125061-pdf.pdf?sfvrsn=12db1334_0
Supplemental Material
Download MS Word (675.7 KB)Correction Statement
This article has been corrected with minor changes. These changes do not impact the academic content of the article.
Additional information
Funding
References
- International Agency for Research on Cancer (IARC). Brazil fact sheets. GLOBOCAN 2020. Available from: https://gco.iarc.fr/today/data/factsheets/populations/76-brazil-fact-sheets.pdf.
- An estimate of premature deaths averted with immunotherapy in treating Brazilian patients with advanced clear cell renal cell carcinoma. Available from: https://ascopubs.org/doi/abs/10.1200/JCO.2019.37.15_suppl.e16114#:∼:text=Background%3A%20Clear%20cell%20renal%20cell,in%20metastatic%20RCC%20(mRCC).
- Aguiar P, Jr., Padua TC, Guimaraes DP. Brazilian data of renal cell carcinoma in a public university hospital. Int Braz J Urol. 2016;42(1):29–36. doi: 10.1590/S1677-5538.IBJU.2014.0452.
- Engel Ayer Botrel T, Datz Abadi M, Chabrol Haas L, et al. Pembrolizumab plus axitinib and nivolumab plus ipilimumab as first-line treatments of advanced intermediate- or poor-risk renal-cell carcinoma: a number needed to treat analysis from the Brazilian private perspective. J Med Econ. 2021;24(1):291–298. doi: 10.1080/13696998.2021.1883034.
- Oliveira AP, Roubik C, Dyer M, et al. Immunotherapy-based first-line treatment of intermediate-and poor-risk advanced renal cell carcinoma: number needed to treat and cost of preventing an event from the perspective of the Brazilian private healthcare system. JBES. 2021;13(3):258–267. doi: 10.21115/JBES.v13.n3.p258-67.
- Hartmann JT, Bokemeyer C. Chemotherapy for renal cell carcinoma. Anticancer Res. 1999;19(2C):1541–1543.
- Calvo E, Porta C, Grünwald V, et al. The current and evolving landscape of first-line treatments for advanced renal cell carcinoma. Oncologist. 2019;24(3):338–348. doi: 10.1634/theoncologist.2018-0267.
- Heng DYC, Xie W, Regan MM, et al. Prognostic factors for overall survival in patients with metastatic renal cell carcinoma treated with vascular endothelial growth factor-targeted agents: results from a large, multicenter study. J Clin Oncol. 2009;27(34):5794–5799. doi: 10.1200/JCO.2008.21.4809.
- Heng DYC, Xie W, Regan MM, et al. External validation and comparison with other models of the international metastatic renal-cell carcinoma database consortium prognostic model: a population-based study. Lancet Oncol. 2013;14(2):141–148. doi: 10.1016/S1470-2045(12)70559-4.
- Bergerot PG, Bergerot CD, Dizman N, et al. Assessment of treatment patterns for metastatic renal cell carcinoma in Brazil. J Glob Oncol. 2018;4:1–8. doi: 10.1200/JGO.17.00113.
- Smaletz O, Dias M, Mata J, et al. Diretrizes de tratamentos oncológicos recomendados pela Sociedade Brasileira de Oncologia Clínica – Rim. Diretrizes 2022 – Atualização. 2022.; Available from: https://www.sboc.org.br/images/16.-Diretrizes-SBOC-2022---Rim-v5-FINAL.pdf.
- Motzer RJ, Tannir NM, McDermott DF, et al. Nivolumab plus ipilimumab versus sunitinib in advanced Renal-Cell carcinoma. N Engl J Med. 2018;378(14):1277–1290. doi: 10.1056/NEJMoa1712126.
- Rini BI, Plimack ER, Stus V, et al. Pembrolizumab plus axitinib versus sunitinib for advanced Renal-Cell carcinoma. N Engl J Med. 2019;380(12):1116–1127. doi: 10.1056/NEJMoa1816714.
- Motzer RJ, McDermott DF, Escudier B, et al. Conditional survival and long-term efficacy with nivolumab plus ipilimumab versus sunitinib in patients with advanced renal cell carcinoma. Cancer. 2022;128(11):2085–2097. doi: 10.1002/cncr.34180.
- Rini BI. Pembrolizumab (pembro) plus axitinib (axi) versus sunitinib as first-line therapy for advanced clear cell renal cell carcinoma (ccRCC): Results from 42-month follow-up of KEYNOTE-426. 2021;4500–4500.
- Powles T, Plimack ER, Soulières D, et al. Pembrolizumab plus axitinib versus sunitinib monotherapy as first-line treatment of advanced renal cell carcinoma (KEYNOTE-426): extended follow-up from a randomised, open-label, phase 3 trial. Lancet Oncol. 2020;21(12):1563–1573. doi: 10.1016/S1470-2045(20)30436-8.
- Caro JJ, Briggs AH, Siebert U, et al. Modeling good research practices–overview: a report of the ISPOR-SMDM modeling good research practices task force-1. Med Decis Making. 2012;32(5):667–677. doi: 10.1177/0272989X12454577.
- Brasil Ministério da Saúde. Secretaria de Ciência, Tecnologia e Insumos Estratégicos. Departamento de Ciência e Tecnologia. Diretrizes metodológicas: diretriz de Avaliação Econômica/Ministério da Saúde, Secretaria de Ciência, Tecnologia e Insu mos Estratégicos, Departamento de Ciência e Tecnologia. – 2. ed. – Brasília: Ministério da Saúde, 2014. Available from: https://www.gov.br/conitec/pt-br/midias/artigos_publicacoes/diretrizes/diretrizes_metodologicas_diretriz_avaliacao_economica.pdf.
- Nardi AC, Zequi SdC, Clark OAC, et al. Epidemiologic characteristics of renal cell carcinoma in Brazil. Int Braz J Urol. 2010;36(2):151–157; discussion 158. discussion 158. doi: 10.1590/s1677-55382010000200004.
- Brazilian Institute of Geography and Statistics. Tábua completa de mortalidade para o Brasil. Rio de Janeiro, 2020. Disponível em Available from: https://biblioteca.ibge.gov.br/index.php/biblioteca-catalogo?view=detalhes&id=73097.
- National Institute for Health and Care Excellence (NICE). TA780: nivolumab with ipilimumab for untreated advanced renal cell carcinoma: final appraisal document. 2022. Available from: https://www.nice.org.uk/guidance/ta780/evidence.
- Cope S, Chan K, Campbell H, et al. A comparison of alternative network meta-analysis methods in the presence of nonproportional hazards: a case study in first-line advanced or metastatic renal cell carcinoma. Value Health. 2023;26(4):465–476. doi: 10.1016/j.jval.2022.11.017.
- Phillippo DM, Ades AE, Dias S, et al. Methods for Population-Adjusted indirect comparisons in health technology appraisal. Med Decis Making. 2018;38(2):200–211. doi: 10.1177/0272989X17725740.
- Rohatgi A. WebPlotDigitizer. 2017; Available from: http://arohatgi.info/WebPlotDigitizer/index.html.
- Guyot P, Ades AE, Ouwens MJNM, et al. Enhanced secondary analysis of survival data: reconstructing the data from published Kaplan-Meier survival curves. BMC Med Res Methodol. 2012;12(1):9. doi: 10.1186/1471-2288-12-9.
- Saluja R, Cheng S, Delos Santos KA, et al. Estimating hazard ratios from published Kaplan-Meier survival curves: a methods validation study. Res Synth Methods. 2019;10(3):465–475. doi: 10.1002/jrsm.1362.
- Applied survival analysis: regression modeling of time-to-Event data., 2nd edition by HOSMER, D. W., LEMESHOW, S., and MAY, S. Biometrics, 2009. 65(2): p. 671–672.
- R Core Team. R: a language and environment for statistical computing. R Foundation for Statistical Computing, Vienna, Austria. 2022. Available from: https://www.R-project.org/.
- Wang., et al. 2019. Matching-adjusted indirect comparison of pembrolizumab plus axitinib versus nivolumab plus ipilimumab for the first-line treatment of advanced/metastatic renal cell carcinoma.
- Bensimon AG, Zhong Y, Swami U, et al. Cost-effectiveness of pembrolizumab with axitinib as first-line treatment for advanced renal cell carcinoma. Curr Med Res Opin. 2020;36(9):1507–1517. doi: 10.1080/03007995.2020.1799771.
- NICE. Single Technology Appraisal Pembrolizumab with axitinib for untreated advanced renal cell carcinoma [ID1426] Committee papers. 2019.
- Viegas Andrade M, Noronha K, Kind P, et al. Societal preferences for EQ-5D health states from a Brazilian population survey. Value Health Reg Issues. 2013;2(3):405–412. doi: 10.1016/j.vhri.2013.01.009.
- EMA. Assessment report Keytruda, in Assessment report. 2015, European Medicines Agency
- Bedke J, Rini BI, Plimack ER. Health-related quality-of-life analysis from KEYNOTE-426: pembrolizumab + axitinib vs sunitinib for advanced renal cell carcinoma, in. Eau 2020 Qol. 2020;
- Bedke J, Rini BI, Plimack ER, et al. Health-related quality of life analysis from KEYNOTE-426: pembrolizumab plus axitinib versus sunitinib for advanced renal cell carcinoma. Eur Urol. 2022;82(4):427–439. doi: 10.1016/j.eururo.2022.06.009.
- Agência Nacional de Vigilância Sanitária - Anvisa. Listas de preços de medicamentos. 2022. Available from: https://www.gov.br/anvisa/pt-br/assuntos/medicamentos/cmed/precos.
- Watson TR, Gao X, Reynolds KL, et al. Cost-effectiveness of pembrolizumab plus axitinib Vs nivolumab plus ipilimumab as First-Line treatment of advanced renal cell carcinoma in the US. JAMA Netw Open. 2020;3(10):e2016144. doi: 10.1001/jamanetworkopen.2020.16144.
- Nivolumab Combined With Ipilimumab Versus Sunitinib in Previously Untreated Advanced or Metastatic Renal Cell Carcinoma (CheckMate 214). Available from: https://clinicaltrials.gov/ct2/show/NCT02231749.
- Classificação Brasileira Hierarquizada de Procedimentos Médicos (CBHPM). 2012. Disponível em. Available from: https://sbacvsp.com.br/Procedimentos/Tabela-CBHPM-Geral.pdf.
- Plimack ER, et al. Pembrolizumab plus axitinib versus sunitinib as first-line therapy for advanced renal cell carcinoma (RCC): updated analysis of KEYNOTE-426. 2020, American Society of Clinical Oncology.
- CONVÊNIO ICMS 162/94—Conselho Nacional de Política Fazendária CONFAZ. 2023; Available from: https://www.confaz.fazenda.gov.br/legislacao/convenios/1994/CV162_94.
- NICE. Single Technology Appraisal Cabozantinib for untreated advanced renal cell carcinoma [ID1208] Committee papers. 2018.
- Shay R, Nicklawsky A, Gao D, et al. A Cost-Effectiveness analysis of nivolumab plus ipilimumab versus pembrolizumab plus axitinib and versus avelumab plus axitinib in First-Line treatment of advanced renal cell carcinoma. Clin Genitourin Cancer. 2021;19(4):370–370 e7. doi: 10.1016/j.clgc.2021.01.009.
- Zarrabi KK, Handorf E, Miron B, et al. Comparative effectiveness of Front-Line ipilimumab and nivolumab or axitinib and pembrolizumab in metastatic clear cell renal cell carcinoma. Oncologist. 2023;28(2):157–164. doi: 10.1093/oncolo/oyac195.
- Leonart Garmatter L, Rego BF, Bastos DA, et al. Cost-Effectiveness of Pembrolizumab + Axitinib Versus Nivolumab + Ipilimumab As First-Line Treatment of Advanced Renal Cell Carcinoma in the Private Healthcare System in Brazil. 2023 [cited 2023; Available from: https://www.ispor.org/heor-resources/presentations-database/presentation/intl2023-3669/126054.
- Riaz IB, He H, Ryu AJ, et al. A living, interactive systematic review and network meta-analysis of first-line treatment of metastatic renal cell carcinoma. Eur Urol. 2021;80(6):712–723. doi: 10.1016/j.eururo.2021.03.016.
- Regan M. Treatment-free survival, with and without toxicity, after immuno-oncology versus targeted therapy for advanced renal cell carcinoma: 42-month results of CheckMate 214. Poster presentation at the European Society for Medical Oncology (ESMO) Congress; September 19- 21, 2020. Virtual Meeting. 2020
- Motzer RJ, Tannir NM, McDermott DF, et al. 661P conditional survival and 5-year follow-up in CheckMate 214: first-line nivolumab + ipilimumab (N + I) versus sunitinib (S) in advanced renal cell carcinoma (aRCC). Annals of Oncology. 2021;32: s 685–S687. doi: 10.1016/j.annonc.2021.08.057.