
Abstract
Objective
The ongoing Phase III randomized POLARIX study (GO39942; NCT03274492) demonstrated significantly improved progression-free survival (PFS) with polatuzumab vedotin plus rituximab, cyclophosphamide, doxorubicin and prednisone (Pola-R-CHP) versus rituximab plus cyclophosphamide, doxorubicin, vincristine, and prednisone (R-CHOP) in patients with previously untreated diffuse large B-cell lymphoma (DLBCL). We compared statistical methodologies to extrapolate long-term PFS data from POLARIX.
Materials and methods
This analysis explored four different approaches to extrapolate the POLARIX data: standard parametric survival, mixture-cure, landmark, and spline models. The resulting extrapolation curves were validated via comparison with the corresponding Kaplan–Meier (KM) curves from POLARIX and the POLARIX-like population of the Phase III GOYA study (NCT01287741; R-CHOP arm).
Results
The R-CHOP PFS KM curve from the GOYA validation set was well aligned with the POLARIX KM curve. As we anticipated that PFS in POLARIX would evolve similarly to that of GOYA, the data from GOYA were used to externally validate the extrapolated modelling results. While all four statistical methods were able to fit the data to the POLARIX KM curve, the mixture-cure model was the most accurate in predicting long-term PFS in the GOYA external validation set. In the mixture-cure model, generalized gamma distribution estimated 64% (95% confidence intervals [CI]: 56–71%) of patients to have long-term remission in the R-CHOP arm of POLARIX and GOYA, and 75% (95% CI: 70–79%) in the Pola-R-CHP arm of POLARIX. A limitation of this study was the comparison of the statistical models only in the PFS KM curves, since it was not possible to determine which statistical method was more appropriate to extrapolate the overall survival KM curves.
Conclusions
Within this analysis, the mixture-cure model provided the best prediction of long-term outcomes from the primary PFS analysis of the POLARIX study.
Introduction
Diffuse large B-cell lymphoma (DLBCL) is the most common histological subtype of non-Hodgkin’s lymphoma (NHL), representing around 30% of all NHL casesCitation1. In 2020, 544,352 new cases of NHL were estimated worldwide, with more than 163,000 patients diagnosed with DLBCLCitation2. The disease occurs more frequently in patients aged 55 years and above, with a median age of 66 years at diagnosisCitation3, but can also occur in the younger population, including children and young adults. DLBCL is an aggressive disease and patients usually present with rapidly increasing lymphadenopathy and constitutional symptoms leading to an immediate need to start treatmentCitation4.
The standard of care first-line treatment is multi-agent chemoimmunotherapy with rituximab, cyclophosphamide, doxorubicin, vincristine, and prednisone (R‐CHOP); however, up to 40% of patients are refractory to first-line treatment, or relapse following an initial responseCitation1. Until recently there had been no advance in the treatment of patients with previously untreated DLBCL in over 20 years, as previously conducted randomized studies had been unable to show a benefit over R-CHOP.
Polatuzumab vedotin is a first-in-class CD79b-targeted antibody–drug conjugate that contains monomethyl auristatin E, a potent microtubule inhibitorCitation5. The Phase III POLARIX study (GO39942; NCT03274492) demonstrated efficacy and safety of polatuzumab vedotin in combination with rituximab, cyclophosphamide, doxorubicin, and prednisone (Pola-R-CHP) versus R-CHOP in previously untreated patients with DLBCLCitation6. The results of this study demonstrated that, per investigator assessment, patients receiving Pola-R-CHP had a statistically significant and clinically meaningful 27% reduction in the risk of disease progression, relapse, or death, compared with R-CHOP (stratified hazard ratio [HR]: 0.73; 95% confidence interval [CI]: 0.57–0.95; p-value = 0.02)Citation6.
The final progression-free survival (PFS) analysis from the POLARIX study occurred in June 2021 and long-term PFS outcomes are not yet available, although it is anticipated that such information will be obtained from both POLARIX follow-up (up to 5 years from randomization) and from real-world registry data. This analysis aimed to compare four statistical modelling approaches (standard parametric survival model, mixture-cure model, landmark model and spline model) in order to extrapolate the current data.
Methods
Study design
The performance of a standard parametric survival model and flexible models (mixture-cure, landmark and spline models) was assessed in order to evaluate their ability to fit the survival functions to the KM curves from POLARIX, as well as their ability to predict long-term PFS from an external dataset. A systematic approach was taken to select the most suitable model to extrapolate both arms of the POLARIX study, as described in detail below.
Patient population
In the POLARIX study, 879 patients were randomized to be treated with Pola-R-CHP or R-CHOP. Eligible patients were adults (18–80 years) with previously untreated DLBCL, an Eastern Cooperative Oncology Group performance status of 0–2 and International Prognostic Index (IPI) score of 2–5. Using results from the final, protocol-specified PFS analysis (data cut-off date: 28 June 2021), four statistical models were developed to extrapolate the POLARIX data: (1) standard parametric survival model, (2) mixture-cure model, (3) landmark model, and (4) spline model.
Standard parametric survival model
Standard parametric survival modelling is considered the traditional method for extrapolating survival dataCitation7. PFS data were modeled separately from both treatment arms using the following distributions: exponential, Weibull, log-normal, log-logistic, gamma, Gompertz and generalized gamma. The curves were compared with the corresponding KM curves from the POLARIX study, and with their respective Akaike information criterion (AIC) and Bayesian information criterion (BIC). After internal validation, the best fit distribution was selected to be externally validated with the R-CHOP arm from the GOYA external validation set. The analysis was performed using the flexsurvPlus package in RCitation8,Citation9.
Mixture-cure models
Mixture-cure models are widely used for survival analyses with a cure fractionCitation10. This statistical approach was applied to appropriately model the survival data of the two underlying groups of patients: those with long-term remission (patients whose PFS would not be affected by disease-related events and who would have similar mortality to the general population), and patients who progress and die prematurely due to the disease. The background mortality derived for each patient, based on age, gender, calendar year, and geographic region, matched external life tablesCitation11. The mixture-cure function was fitted separately for each standard survival parametric function in both treatment arms. The cure rate was estimated simultaneously with the unknown parameters of the standard parametric survival functions using maximum likelihood methods. The fit of the mixture-cure rate model was assessed using AIC and BIC, and visually compared with KM curves and the best fitting distributions were then validated with the GOYA external validation set. The analysis was performed using R softwareCitation8; code, guidance and tutorial for this methodology were reported separatelyCitation12.
Landmark model
In this approach, patients were classified into a complete responder (CR) group or non-CR group. The CR group was identified according to a secondary endpoint of the POLARIX study: complete response rate at the end of treatment (EOT) by fluorodeoxyglucose-positron emission tomography, as determined by blinded independent central review at a landmark point, defined as 28 weeks, the median time of EOT response evaluation. Standard parametric functions were fitted separately to the PFS data of the CR in both treatment arms from the 28-week landmark point, and AIC and BIC were estimated for both groups. The PFS KM curve was used until the landmark point, and from the landmark point onwards, the weighted average of the extrapolated PFS curves, fitted to the CR group in each treatment arm, was used. Weighting was based on the proportion of patients in complete response at the landmark point. The analysis was performed using the flexsurvPlus package in RCitation8,Citation9.
Spline model
Royston-Parmar spline-based models are flexible parametric models that are fitted sequentially by piecewise (polynomial) functions to segmented portions of the dataCitation13. Between data segments, these functions are connected at points known as knotsCitation14–16, leading to a smooth survival functionCitation13. Knots were placed at quantiles of the log uncensored event times, reducing the uncertainties around finding the optimal knot placement. It also allows for reproducibility of the results and avoids the risk of overfitting. The inclusion of knots in spline model allows the model to fit more accurately the observed dataCitation17.
Three spline parameterizations were explored: proportional hazards, proportional odds, and normal. With proportional hazard and proportional odds, the log cumulative hazard and log cumulative odds were modelled, respectively, as a spline function. In contrast, for the normal parameterization, the spline function was modelled as − Φ −1 (S(t)), where Φ − 1 () is the inverse normal distribution function qnorm. Spline models were applied to each arm (Pola-R-CHP and R-CHOP) independently using the flexsurv package in RCitation8,Citation18. The flexible survival model by Royston and ParmarCitation19 was fitted using the flexsurvspline function in the flexsurv package in which the log cumulative hazard is modelled as a natural cubic spline function of log timeCitation18.
Goodness-of-fit analysis
Long-term PFS extrapolation curves generated with each method were assessed for their goodness-of-fit. The extrapolation curves produced using each statistical method detailed above were evaluated for their goodness-of-fit to the data using the AIC, BIC, and visual assessment of each parametric function. The visual inspection assessed the fit of each parametric function – internal validation with KM curves from the POLARIX study, and external validation with KM curves from a set of POLARIX-like patients from the GOYA studyCitation20. The GOYA study (NCT01287741; BO21005) was a randomized, open-label, multicenter, Phase III study that compared the efficacy and safety of obinutuzumab (G) plus CHOP (G-CHOP) with R-CHOP in patients with previously untreated DLBCLCitation20. The POLARIX-like external validation set from the GOYA study was selected for the four models due to the availability of long-term survival data for patients with previously untreated DLBCL who were treated with R-CHOP.
Results
GOYA external validation set
The external validation set comprised a subset of patients from the GOYA trial who were aligned with the POLARIX study population, and who were selected prior to initiation of the statistical extrapolations. The R-CHOP-treated patients in the GOYA trial (n = 710) included those with an IPI score of 0–1 (excluded from POLARIX), and up to eight planned CHOP treatment cycles (compared with six in POLARIX); in addition, a large number of patients in the GOYA trial were recruited from China, whereas the majority of Chinese patients in the POLARIX study were recruited in a separate Asia extension cohort. After matching the GOYA patient selection criteria to POLARIX, and excluding patients with an IPI score of 0 or 1 (n = 140), those who had eight planned CHOP cycles (n = 149), those who were recruited at Chinese centers (n = 70), and those with missing data (n = 4), 347 patients from GOYA were available for inclusion in the external validation set.
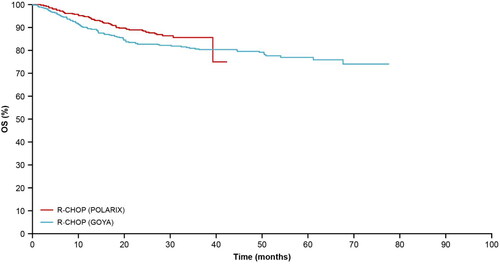
The PFS KM curve from the R-CHOP arm of the GOYA external validation set was well aligned to that from POLARIX (); therefore, KM curves from these two studies were used for internal and external validations of the long-term PFS extrapolation approaches. Close alignment could not be seen in the overall survival (OS) KM curves between GOYA and POLARIX (), this is likely due to the recent advances in later-line therapies.
Figure 1. PFS curves from the POLARIX and GOYA trials: R-CHOP. PFS, progression-free survival; R-CHOP, rituximab plus cyclophosphamide, doxorubicin, vincristine and prednisone.
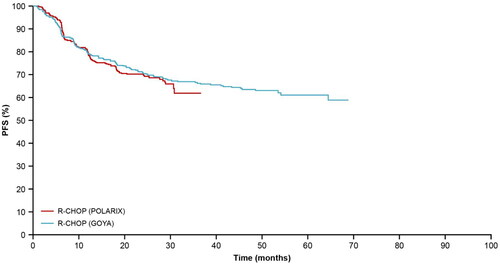
Figure 2. OS curves from the POLARIX and GOYA trials: R-CHOP. OS, overall survival; R-CHOP, rituximab plus cyclophosphamide, doxorubicin, vincristine and prednisone.
Standard parametric survival model
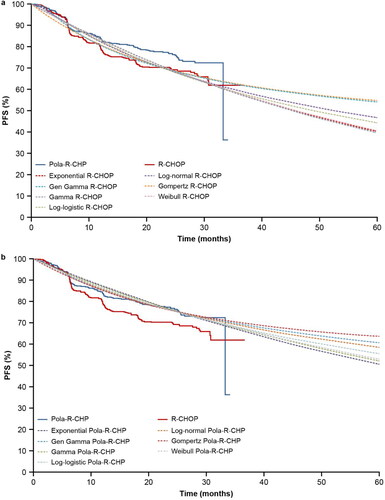
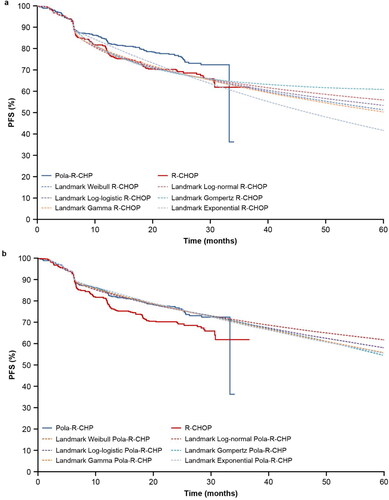
PFS standard parametric survival model extrapolations for the R-CHOP and Pola-R-CHP arms of POLARIX, are shown in , respectively; AIC and BIC goodness-of-fit results are reported in supplemental Tables S1 and S2. Generalized gamma had the lowest AIC and BIC for the R-CHOP arm, and although log-normal had the lowest AIC and BIC for the Pola-R-CHP arm, generalized gamma presented the best visual fit to the KM curve from the POLARIX study.
Figure 3. (a) PFS extrapolation with the standard parametric survival model: R-CHOP. (b) PFS extrapolation with the standard parametric survival model: Pola-R-CHP. Gen, generalized; PFS, progression-free survival; Pola-R-CHP, polatuzumab vedotin plus rituximab, cyclophosphamide, doxorubicin and prednisone; R-CHOP, rituximab plus cyclophosphamide, doxorubicin, vincristine and prednisone.
Mixture-cure model
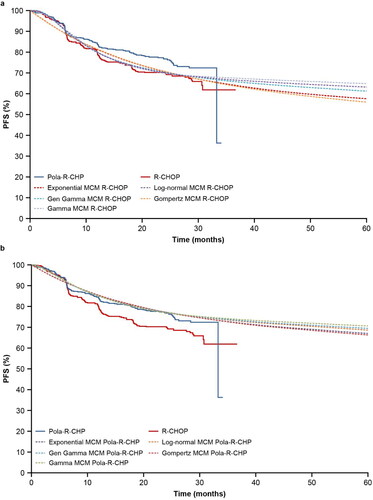
PFS mixture-cure model extrapolations for R-CHOP and Pola-R-CHP are shown in , respectively. Among all distributions, generalized gamma, log-normal and gamma presented the best fit to the PFS KM curve from POLARIX. For all the survival functions, parameterization with Weibull and log-logistic model did not converge. In the mixture-cure model, PFS KM curves of R-CHOP and Pola-R-CHP from the POLARIX study were used to estimate the long-term remission fraction. Estimated long-term remission fractions of R-CHOP and Pola-R-CHP, and AIC and BIC goodness-of-fit results are reported in supplemental Tables S3 and S4.
Figure 4. (a) PFS extrapolation with the mixture-cure model: R-CHOP. (b) PFS extrapolation with the mixture-cure model: Pola-R-CHP. Gen, generalized; MCM, mixture-cure model; PFS, progression-free survival; Pola-R-CHP, polatuzumab vedotin plus rituximab, cyclophosphamide, doxorubicin and prednisone; R-CHOP, rituximab plus cyclophosphamide, doxorubicin, vincristine and prednisone.
Landmark model
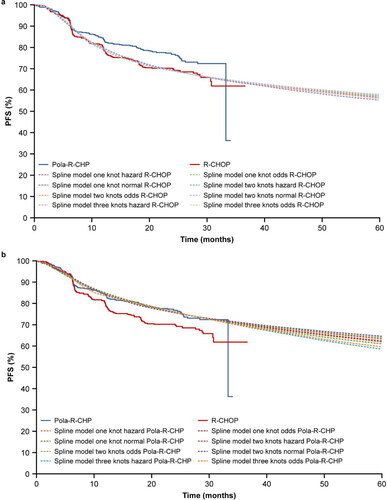
show the PFS extrapolated with the landmark model. At 28 weeks, 35% and 65% of patients in the R-CHOP arm were classified as CR and non-CR, respectively. In the Pola-R-CHP arm, 38% and 62% were classified as CR and non-CR, respectively. Since generalized gamma did not converge for Pola-R-CHP, it was not assessed for the R-CHOP arm. Among all distributions, exponential was the only distribution that did not provide a good fit to the R-CHOP PFS KM curve from the POLARIX study. Exponential distribution also presented the highest AIC and BIC for the non-CR group in the R-CHOP arm (supplemental Table S5). In the Pola-R-CHP arm, all extrapolation distributions presented a good fit to the curve and the AIC and BIC estimates are described in supplemental Table S6.
Figure 5. (a). PFS extrapolation with the landmark model: R-CHOP. (b) PFS extrapolation with the landmark model: Pola-R-CHP. PFS, progression-free survival; Pola-R-CHP, polatuzumab vedotin plus rituximab, cyclophosphamide, doxorubicin and prednisone; R-CHOP, rituximab plus cyclophosphamide, doxorubicin, vincristine and prednisone.
Spline model
show the PFS spline parameterization, with knots ranging from one to three. Since using three knots did not demonstrate improvement compared with two knots, no additional knots were assessed. The normal spline model with three knots was not assessed for the R-CHOP arm since it did not converge for Pola-R-CHP. There was no clear selection of best extrapolation distribution when comparing the AIC and BIC estimates (supplemental Tables S7 and S8) and the visual fit of the curves. All spline model extrapolations presented a good fit to their respective KM curves.
Figure 6. (a) PFS extrapolation with the spline model: R-CHOP. (b) PFS extrapolation with the spline model: Pola-R-CHP. PFS, progression-free survival; Pola-R-CHP, polatuzumab vedotin plus rituximab, cyclophosphamide, doxorubicin and prednisone; R-CHOP, rituximab plus cyclophosphamide, doxorubicin, vincristine and prednisone.
External validation
The PFS KM curve of R-CHOP from the GOYA external validation set was used to validate the extrapolations of the POLARIX study data with all four statistical approaches (standard parametric survival model, mixture-cure model, landmark model, and spline model). show the best distribution of each method selected and compared with R-CHOP from the GOYA external validation set.
Figure 7. (a) External validation of extrapolation methods with data from the GOYA external validation set: R-CHOP. (b) Comparison of extrapolation methods: Pola-R-CHP. Gen, generalized; PFS, progression-free survival; Pola-R-CHP, polatuzumab vedotin plus rituximab, cyclophosphamide, doxorubicin and prednisone; R-CHOP, rituximab plus cyclophosphamide, doxorubicin, vincristine and prednisone.
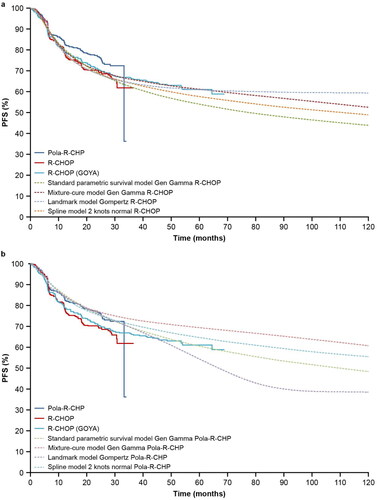
In the standard parametric survival model, generalized gamma presented the best fit to the KM curve of the R-CHOP and Pola-R-CHP arms. Supplemental Figures S1(a,b) present all standard parametric survival distributions compared with the GOYA external validation set; none of the distributions for the R-CHOP arm could predict the long-term PFS of R-CHOP from this external validation set.
In the mixture-cure model, generalized gamma, log-normal and gamma distributions presented a good fit to the PFS KM curve for both arms of POLARIX. The generalized gamma distribution presented the best fit to the PFS KM curve for the R-CHOP arm from the GOYA external validation set (Supplemental Figure S2(a,b)). The R-CHOP PFS KM curve from the GOYA external validation set was also used to estimate the long-term remission fraction for comparison with the long-term remission fraction in the R-CHOP arm from POLARIX.
shows the long-term remission fraction estimated with the mixture-cure model using the R-CHOP arm from the POLARIX study and GOYA external validation set. Generalized gamma distribution presented 64% of the long-term remission fraction in the R-CHOP arm in both studies. Supplemental Figure S3(a,b) present the frequency of long-term remission in the R-CHOP and Pola-R-CHP arms using generalized gamma distribution. The 95% CI of long-term remission was estimated by simulating its frequency: 64% (95% CI: 56–71%) for R-CHOP and 75% (95% CI: 70–79%) for Pola-R-CHP.
Table 1. External validation of the long-term remission fraction in the R-CHOP arm estimated with a mixture-cure model.
In the landmark model, visual inspection showed that all distributions, except for exponential, presented a good fit to the R-CHOP KM curve from the POLARIX study. When the PFS extrapolation curves were compared with the R-CHOP KM curve from the GOYA external validation set, Gompertz showed a better alignment (Supplemental Figure S4(a)). Gompertz distribution presented a plateau after POLARIX study follow-up, but it could not predict late events in the R-CHOP arm. On the other hand, all extrapolations in the Pola-R-CHP arm, including Gompertz, intercepted with the R-CHOP KM curve from the GOYA external validation set (Supplemental Figure S4(b)).
In the spline model, all extrapolations presented a good fit to the R-CHOP and Pola-R-CHP KM curves from the POLARIX study (Supplemental Figure S5(a,b)). However, none of the spline models evaluated could predict the long-term PFS from the GOYA external validation set. A comparison of all spline model extrapolations with PFS KM curves for R-CHOP from the GOYA external validation set showed that two knots normal presented the best option (Supplemental Figure S5(a)).
Using the R-CHOP data from the GOYA external validation set to assess the extrapolations of POLARIX study data, the mixture-cure model presented the best predictive model, since the PFS extrapolation curve using the generalized gamma approach was most closely aligned to the R-CHOP arm of the GOYA external validation set. Both the standard parametric survival model and spline model appeared to underestimate the long-term PFS of the R-CHOP arm, and although the landmark model could predict a plateau of the R-CHOP arm, it could not predict the late events in the R-CHOP arm and all distributions in the Pola-R-CHP arm intercepted with the R-CHOP KM curve from the GOYA external validation set.
Discussion
The POLARIX study demonstrated that patients receiving Pola-R-CHP had a statistically significant improvement in reducing the risk of disease progression, relapse, or death, by 27% compared with R-CHOP (stratified HR: 0.73 [95% CI: 0.57–0.95]; p-value = 0.02)Citation6. The POLARIX study is ongoing, and model simulations from the current analysis suggest median PFS for Pola-R-CHP is expected to be reached after 8 years of follow-up. The presented analysis aimed to compare four approaches in order to extrapolate POLARIX study data (data cut-off date: 28 June 2021): standard parametric survival model, mixture-cure model, landmark model and spline model. Identifying the most accurate approach to extrapolate survival curves is highly important for assessment of the long-term effectiveness of the treatments. Therefore, health technology assessment agencies can make better decisions based on the cost-effectiveness results by estimating the life expectancy of patients treated with Pola-R-CHP or R-CHOP.
The R-CHOP arm of the GOYA study was chosen as the external validation set for the four statistical models since this is the most recent study of first-line treatment for DLBCL in which complete follow-up data for individual patients are available. The GOYA study had a longer follow-up compared with the POLARIX study, and the R-CHOP PFS KM curve for the GOYA external validation set (matched with the POLARIX patient population) showed good alignment with the R-CHOP KM curve of POLARIX.
Although the standard parametric survival, landmark and spline models all had a good fit to the KM curve of the POLARIX study, they could not accurately predict the long-term PFS that is expected with R-CHOP and in some cases the extrapolations of the Pola-R-CHP arm intercepted the R-CHOP arm from the GOYA external validation set.
Standard parametric survival models are often used to extrapolate the long-term effects of oncology drugs for the entire time horizonCitation21–23, and for each distribution of the model, a particular shape for the hazard function is specified. The exponential survival distribution assumes a constant function; Gompertz and Weibull distributions can reflect monotonically increasing or decreasing hazard. Log-normal and log-logistic distributions are considered unimodal, and as for the generalized gamma distribution, different shapes can be assumedCitation24. However, flexible survival models can be more appropriate to capture the shapes of complex hazard functionCitation24.
Advanced cancer treatments can elicit deep and durable responses in a subgroup of patientsCitation24. If the trials evaluating these therapies have sufficient follow-up, the empirical estimate of the mortality hazard rate of these interventions is commonly seen to change over time. The cancer mortality risk is likely to increase at the beginning of the treatment and gradually decline over timeCitation24. Similarly in previously untreated DLBCL, most disease progression occurs within the first 2 years. For example, in the GOYA trial (POLARIX-like population), approximately 78% of disease progression occurred in the R-CHOP arm within 2 yearsCitation20. Evidence suggests that flexible survival models are likely to provide a better representation of this survival function compared with the standard parametric survival modelCitation17,Citation25,Citation26.
The landmark model was developed as a response-based model in which a landmark time was chosen to classify the patients with and without a CR. The landmark model presented a good fit to the KM curves for Pola-R-CHP and R-CHOP (except for exponential distribution for the R-CHOP arm). However, all extrapolations in the Pola-R-CHP arm intersected with the R-CHOP KM curve from the GOYA external validation set, and for the R-CHOP arm, a Gompertz distribution could not predict late events. Although the landmark model is recommended irrespective of the potential for a cureCitation24, it was not the most suitable for extrapolating the POLARIX data. Landmark models are suitable when a landmark time and a strong link between response and survival are well establishedCitation24. It is possible that with longer follow-up the landmark model would present better options of extrapolation, as response rate and survival could have a stronger link. The cubic spline model is also recommended irrespective of the potential for a cure. Among the flexible models, the spline model relies on the assumption of certain subgroups, as it was used in the mixture-cure model in which the patients were classified into those with and without long-term remission. Similarly, in the landmark model, patients were classified into groups according to whether they had a complete response or not, based on a landmark time.
In the spline model, the placement of the knots can be considered subjective; therefore, the knots were placed at equally spaced quantiles of the log uncensored survival timeCitation24. The inclusion of knots allows the spline model to fit the observed data more accuratelyCitation17. All extrapolation using the spline model presented a good fit to the KM curves for Pola-R-CHP and R-CHOP in the POLARIX study. Originally, spline models were developed with the aim to model observed data with complex hazards rather than for extrapolation purposeCitation19. However, a recent study has shown that spline models had better prediction of 10-year survival compared with the standard parametric survival model, when fitted to cancer registry data with artificially right-censored follow-up timesCitation17. It is important to note that in this study, historical registry data including old chemotherapy regimens were analyzed, which have different survival functions to the newer cancer therapies (e.g. immunotherapies) evaluated in more recent clinical trialsCitation17. When extrapolating the POLARIX data, spline models appear to produce better results compared with the standard parametric survival model, although they could not predict the long-term PFS of patients in the R-CHOP arm of the GOYA study.
The use of flexible models can be limited if the data are immature, if there are no external data for validation, and if the sample size of the study is small. Although the follow-up of the POLARIX study is relatively short, the use of flexible models was validated with external data. When assessing the mixture-cure model, one important aspect was estimation of the long-term remission fraction; it is important to have sufficient follow-up in the trial to estimate it accurately. Since the long-term remission fractions of R-CHOP using the POLARIX and GOYA studies were similar (64% of the long-term remission fraction using generalized gamma in both studies), we could confirm that the follow-up was long enough to use the mixture-cure model with the generalized gamma distribution.
The mixture-cure approach was found to provide the best estimates to extrapolate the current POLARIX data, as this model was also aligned to the R-CHOP arm from the GOYA external validation set. The mixture-cure model provides an intuitive way to extrapolate PFS data in a curative setting, such as first-line treatment of DLBCL, as it is assumed that there are two distinct subgroups of patients: those who are in long-term remission (cured) and who do not experience disease-related events, and those who progress and die prematurely due to the disease. Based on the extrapolations derived with the mixture-cure model, the generalized gamma distribution presented the best choice for modelling both treatment arms in the POLARIX study. Both the POLARIX R-CHOP mixture-cure model extrapolation curve and the long-term remission fraction had good alignment with the KM curve of R-CHOP and the long-term remission fraction from the GOYA external validation set. Therefore, we can assume that the mixture-cure model fitted on the POLARIX data provides the most plausible long-term extrapolation in this patient population.
Although the mixture-cure model was seen to be the best choice to model the POLARIX data, it may not always present better extrapolations compared with the other three models. For each disease area and intervention, different modelling approaches need to be assessed. It is important to note that there is no “one-size-fits-all” modeling approach, and multiple plausible models may need to be considered and examinedCitation24. When external evidence is available, it is highly important to evaluate how closely the survival observed in the study population is similar to the long-term external survival dataCitation24. Using an external validation set meant that we did not have to rely solely on AIC/BIC goodness-of-fit statistics and the visual inspection of the KM curves from the POLARIX study to inform model selection. The current study may provide a good example of how to select a suitable model in a systematic approach.
The value of the mixture-cure model in first-line DLBCL using data from the POLARIX study aligns with a recently published assessment by the National Institute for Health and Care Excellence (NICE)Citation27. The final appraisal document recommends Pola-R-CHP for the treatment of adult patients with previously untreated DLBCL and an IPI score of 2–5. The cost-effectiveness model used within the submission was based on the mixture-cure model, which was accepted by NICE to extrapolate data from the POLARIX study.
A limitation of this study was the comparison of the statistical models only in the PFS KM curve. As of 28 June 2021, OS data from the POLARIX study remained immature, with fewer than 13% of patients experiencing an OS event. Due to the small number of events, the long-term OS is uncertain. Additionally, the OS curve from the GOYA external validation set did not present a good alignment with the OS KM curve of R-CHOP from the POLARIX study, limiting the possibility to use OS from the GOYA study to validate the statistical methods. Since it was not possible to determine which statistical method was more appropriate to extrapolate OS, the study was limited to presenting the results for PFS only.
A further limitation of the study, from the perspective of extrapolation, is the follow-up duration of the POLARIX study, as patients in this study may not yet have reached a clinical plateau. To address this limitation, we used data from the Phase III GOYA study to validate all statistical models. It was only possible to validate the R-CHOP arm; therefore, it was assumed that if the R-CHOP extrapolated curves were aligned with the GOYA external validation set, the same distributions could be used to extrapolate the Pola-R-CHP arm. Using the GOYA study to validate the results potentially introduced bias due to the differences in time frames and clinical practices between the two studies. Recruitment for the GOYA study started in 2011, whereas for POLARIX, recruitment began in 2018. Despite the different time frames of the two studies, the likelihood that this would impact PFS following first-line treatment was considered to be low. Longer follow-up will provide a more accurate estimation of the long-term PFS for both treatment arms in the POLARIX study, and potentially present the possibility to compare the OS curves with these statistical models.
The results of this study might not reflect outcomes in the real world due to differences between clinical trial and real-world settings; however, identifying the right model to extrapolate the data can allow estimation of the potential survival benefit of a new intervention compared with the current standard of care.
Conclusion
Identifying the most appropriate statistical model to extrapolate clinical study data is essential for estimation of the potential long-term impact of an intervention. Previously untreated DLBCL is known to be a curative setting that challenges the traditional parametric methods to capture long-term outcomes with a short follow-up. Among all statistical methods evaluated in this study, the mixture-cure model presented the best choice to extrapolate PFS data from the final, protocol-specified PFS analysis of the POLARIX study (data cut-off: 28 June 2021).
Transparency
Author contributions
Conception and design: all authors; Model development: all authors; Data analysis and interpretation: all authors; Manuscript writing: all authors; Final approval of manuscript: all authors; Accountable for all aspects of the work: all authors.
Supplemental Material
Download MS Word (1.9 MB)Acknowledgements
This study was sponsored by F. Hoffmann-La Roche Ltd. Third-party editorial assistance, under the direction of the authors, was provided by Rebecca Griffin, BSc, and Alice Walter, BSc, of Ashfield MedComms, an Inizio company.
Declaration of financial/other relationships
All authors are employees of F. Hoffmann-La Roche Ltd.
Peer reviewers on this manuscript have no relevant financial or other relationships to disclose.
Data availability statement
For eligible studies, qualified researchers may request access to individual patient-level clinical data through the clinical study data request platform. At the time of writing this request, the platform is Vivli (https://vivli.org/ourmember/roche/). For up-to-date details on Roche’s Global Policy on the Sharing of Clinical Information and how to request access to related clinical study documents, see here: https://go.roche.com/data_sharing. Anonymized records for individual patients across more than one data source external to Roche cannot, and should not, be linked due to a potential increase in risk of patient re-identification.
Additional information
Funding
References
- Sehn LH, Salles G. Diffuse large B-cell lymphoma. N Engl J Med. 2021;384(9):842–858. doi:10.1056/NEJMra2027612.
- Ferlay J, Ervik M, Lam F, et al. Global cancer observatory: cancer today. 2020 [cited Dec 2022]. Available from: https://gco.iarc.fr/today/home.
- National Cancer Institute (NCI) Surveillance Epidemiology and End Results Program. Cancer stat facts: NHL – diffuse large B-cell lymphoma (DLBCL). 2019 [cited Dec 2022]. Available from: https://seer.cancer.gov/statfacts/html/dlbcl.html.
- Liu Y, Barta SK. Diffuse large B-cell lymphoma: 2019 update on diagnosis, risk stratification, and treatment. Am J Hematol. 2019;94(5):604–616. doi:10.1002/ajh.25460.
- Camus V, Tilly H. Polatuzumab vedotin, an anti-CD79b antibody-drug conjugate for the treatment of relapsed/refractory diffuse large B-cell lymphoma. Future Oncol. 2021;17(2):127–135. doi:10.2217/fon-2020-0675.
- Tilly H, Morschhauser F, Sehn LH, et al. Polatuzumab vedotin in previously untreated diffuse large B-cell lymphoma. N Engl J Med. 2022;386(4):351–363. doi:10.1056/NEJMoa2115304.
- Gallacher D, Kimani P, Stallard N. Extrapolating parametric survival models in health technology assessment: a simulation study. Med Decis Making. 2021;41(1):37–50. doi:10.1177/0272989X20973201.
- R Core Team. R: a language and environment for statistical computing. Vienna: R Foundation for Statistical Computing; 2021.
- Bennett I, Gregory J, Smith S, et al. flexsurvPlus: provides functions to perform survival analysis for economic models. R Package version 1.06. 2023. https://roche.github.io/flexsurvPlus/main/authors.html
- Yu B, Peng Y. Mixture cure models for multivariate survival data. J Comput Stat Data Anal. 2008;52(3):1524–1532. doi:10.1016/j.csda.2007.04.018.
- Human Mortality Database. 2022 [cited Dec 2022]. Available from: https://www.mortality.org/.
- Felizzi F, Paracha N, Pöhlmann J, et al. Mixture cure models in oncology: a tutorial and practical guidance. Pharmacoecon Open. 2021;5(2):143–155. doi:10.1007/s41669-021-00260-z.
- Gibson E, Koblbauer I, Begum N, et al. Modelling the survival outcomes of immuno-oncology drugs in economic evaluations: a systematic approach to data analysis and extrapolation. Pharmacoeconomics. 2017;35(12):1257–1270. doi:10.1007/s40273-017-0558-5.
- Davies A, Briggs AH, Schneider JE, et al. The ends justify the mean: outcome measures for estimating the value of new cancer therapies. Health Outcomes Res Med. 2012;3(1):e25–e26. doi:10.1016/j.ehrm.2012.01.001.
- Royston P, Lambert PC. Flexible parametric survival analysis using stata: beyond the Cox model. A Stata Press Publication. College Station (TX): StataCorp LP; 2011.
- Rutherford MJ, Crowther MJ, Lambert PC. The use of restricted cubic splines to approximate complex hazard functions in the analysis of time-to-event data: a simulation study. J Stat Comput Simul. 2015;85(4):777–793. doi:10.1080/00949655.2013.845890.
- Gray J, Sullivan T, Latimer NR, et al. Extrapolation of survival curves using standard parametric models and flexible parametric spline models: comparisons in large registry cohorts with advanced cancer. Med Decis Making. 2021;41(2):179–193. doi:10.1177/0272989X20978958.
- Jackson CH. flexsurv: a platform for parametric survival modeling in R. J Stat Softw. 2016;70:i08. doi:10.18637/jss.v070.i08.
- Royston P, Parmar M. Flexible parametric proportional‐hazards and proportional‐odds models for censored survival data, with application to prognostic modelling and estimation of treatment effects. Stat Med. 2002;21(15):2175–2197. doi:10.1002/sim.1203.
- Sehn LH, Martelli M, Trněný M, et al. A randomized, open-label, phase III study of obinutuzumab or rituximab plus CHOP in patients with previously untreated diffuse large B-cell lymphoma: final analysis of GOYA. J Hematol Oncol. 2020;13(1):71. doi:10.1186/s13045-020-00900-7.
- Haute Autorité de Santé. Choices in methods for economic evaluation—HAS. 2020 [cited Aug 2023]. Available from: https://www.has-sante.fr/upload/docs/application/pdf/2020-11/methodological_guidance_2020_-choices_in_methods_for_economic_evaluation.pdf
- Canadian Agency for Drugs and Technologies in Health. Guidelines for the economic evaluation of health technologies: Canada. 2006 [cited Aug 2023]. Available from: https://www.cadth.ca/guidelines-economic-evaluation-health-technologies-canada-4th-edition.
- Australian Government Department of Health. Guidelines for preparing a submission to the Pharmaceutical Benefits Advisory Committee. Version 5.0. 2016 [cited Aug 2023]. Available from: https://pbac.pbs.gov.au/content/information/files/pbac-guidelines-version-5.pdf.
- Palmer S, Borget I, Friede T, et al. A guide to selecting flexible survival models to inform economic evaluations of cancer immunotherapies. Value Health. 2023;26(2):185–192. doi:10.1016/j.jval.2022.07.009.
- Bullement A, Willis A, Amin A, et al. Evaluation of survival extrapolation in immuno-oncology using multiple pre-planned data cuts: learnings to aid in model selection. BMC Med Res Methodol. 2020;20:103.
- Klijn SL, Fenwick E, Kroep S, et al. What did time tell us? A comparison and retrospective validation of different survival extrapolation methods for immuno-oncologic therapy in advanced or metastatic renal cell carcinoma. Pharmacoeconomics. 2021;39(3):345–356. doi:10.1007/s40273-020-00989-1.
- National Institute for Health and Care Excellence. Final appraisal document, Polatuzumab vedotin in combination for untreated diffuse large B-cell lymphoma. 2023. [cited Aug 2023]. Available from: https://www.nice.org.uk/guidance/gid-ta10785/documents/final-appraisal-determination-document.