
Abstract
Aims
To compare healthcare costs in patients with non-inhibitor hemophilia A treated with Rurioctocog Alfa Pegol (FVIII-PEG) versus Antihemophilic Factor (Recombinant), FC Fusion Protein (rFVIIIFc).
Materials and methods
Administrative claims data from the Merative MarketScan Commercial (Commerical) and Medicaid (Medicaid) databases were used for these analyses. Males with non-inhibitor hemophilia A treated with FVIII-PEG or rFVIIIFc from 1 January 2016 to 31 March 2021 were identified (earliest treatment = index). Patients were required to have continuous database enrollment for six months before and after the index date. Follow-up was variable in length until disenrollment or study end. All-cause and hemophilia-related healthcare costs were reported per-patient per month [PPPM] and the average weekly dose during follow-up was compared between treatment groups. Generalized linear regressions were used to estimate multivariable-adjusted differences in total costs and weekly dosage in the two treatment groups.
Results
A total of 131 FVIII-PEG (66 Commercial; 65 Medicaid) and 204 rFVIIIFc (111 Commercial; 93 Medicaid) patients were eligible. Mean age was 20.5 and 24.4 for FVIII-PEG and rFVIIIFc in Commercial and 14.9 and 17.5 for FVIII-PEG and rFVIIIFc in Medicaid. PPPM mean (standard deviations [SD]) total healthcare costs in Commercially insured patients were $35,868 [$21,717] for FVIII-PEG vs $40,424 [$25,882] for rFVIIIFc. Costs in Medicaid were $27,495 [$23,243] for FVIII-PEG vs $30,237 [$28,430] for rFVIIIFc. After adjusting for baseline characteristics, the costs for rFVIIIFc (vs FVIII-PEG) were higher by $5,215 in Commercial and $3,895 in Medicaid, but the differences were not statistically significant (p > 0.05). Similar findings were observed for hemophilia-specific healthcare costs. The adjusted mean weekly dose was 6,047 vs 4,892 IU, p = 0.21 for FVIII-PEG vs rFVIIIFc in Commercial and 5,549 vs 7,228 IU, p = 0.07 for FVIII-PEG vs rFVIIIFc in Medicaid.
Conclusions
Healthcare costs and treatment dosing were similar (p > 0.05) for non-inhibitor hemophilia A patients treated with FVIII-PEG and rFVIIIFc.
Introduction
Hemophilia A is a rare, congenital X-linked bleeding disorder characterized by a deficiency in coagulation factor VIII (FVIII)Citation1. Patients with hemophilia A experience spontaneous bleeding into joints and muscles as well as bleeding following injuries or surgery, and are at a high risk of joint and organ damage and other long-term complicationsCitation1–3. Hemophilia A affects an estimated 1 in 5,000 live male births, with approximately 33,000 males living with the disease in the USCitation4,Citation5. Despite the low prevalence, hemophilia A is associated with considerable healthcare resource utilization (HCRU) and costs, with treatment accounting for majority of the costs of hemophilia careCitation6,Citation7. The standard of care as indicated in the World Federation of Hemophilia therapeutic guidelines for patients with severe hemophilia A is regular replacement therapy (prophylaxis) with clotting factor concentrates (CFC) or other hemostatic agents administered starting at an early ageCitation6,Citation8. Episodic (on-demand) replacement therapy is used to treat specific bleeding episodes but is not a long-term treatment option, as it does not prevent the long-term complications of bleedingCitation6. Prophylactic treatment options include plasma-derived or recombinant FVIII concentrate as either standard half-life (SHL) concentrates that generally require three to four injections per week or extended half-life (EHL) concentrates that provide longer-lasting therapy than SHL and promote more convenient and individualized dosing schedulesCitation8–10.
A variety of SHL or EHL FVIII concentrates, as well as a non-factor therapy (emicizumab), are available for treating severe hemophilia A. Rurioctocog alfa pegol (ADYNOVATE, Antihemophilic Factor [Recombinant] PEGylated) (FVIII-PEG)Citation11,Footnotei and Efmoroctocog alfa (ELOCTATE, Antihemophilic Factor [Recombinant] Fc Fusion Protein) (rFVIIIFc)Citation12,Footnoteii are two common EHL recombinant FVIII concentrate replacement therapies approved for treating hemophilia A. Emicizumab (HEMLIBRA), a humanized bi-specific antibody, is a newer treatment that is increasingly being used to treat severe hemophilia in the US since its approval in 2018 for prophylaxis in patients without inhibitors (i.e. inhibitory antibodies that neutralize therapy function)Citation10.
Real-world evidence (RWE) studies evaluating the economic burden associated with hemophilia A prophylactic treatment have estimated highly variable healthcare costs, ranging from ∼$287,000 to over $900,000 annuallyCitation13–17. Although these studies have demonstrated the substantial economic burden imposed by undergoing hemophilia A prophylactic treatment, a comparison of costs for patients treated with specific types of EHL FVIII therapy has not been evaluated. In previous studies of patients in Canada who switched from rFVIIIFc to FVIII-PEG, FVIII-PEG and rFVIIIFc were found to have similar pharmacokinetic parameters (e.g. half-life, clearance), necessitating minimal change in treatment regimens for most patientsCitation18,Citation19. However, a comparative evaluation of direct costs and utilization associated with these two treatments using RWE are lacking and needed to inform both payers and clinicians when making treatment and coverage decisions The aim of this retrospective study was to use current real-world data to compare all-cause and hemophilia-related HCRU and costs and treatment dosing among patients with hemophilia A treated with FVIII-PEG versus rFVIIIFc.
Methods
Study design and data source
This retrospective administrative claims analysis was conducted using data from the Merative MarketScanFootnoteiii Commercial Claims and Encounters (Commercial) Database and the Merative MarketScan Medicaid (Medicaid) administrative claims database from 1 January 2016 through 31 March 2021. The Commercial database captures the inpatient medical, outpatient medical, and outpatient prescription drug data for over 155 million employees and their dependents covered under a variety of fee-for-service and managed care health plans. The data contributors in the Commercial database are large employers (and health plans submit the data directly to the database) and therefore patients contributing data to this database have employer-sponsored healthcare. The Medicaid database contains the pooled healthcare experience of Medicaid enrollees from multiple, geographically dispersed states. Medicaid is a joint federal and state program covering low-income families in the US. The Medicaid files include records of inpatient services, inpatient admission, outpatient services, and outpatient prescription drug claims.
Study data were obtained using codes from the International Classification of Diseases, Tenth Revision, Clinical Modification (ICD-10-CM); the Current Procedural Terminology fourth edition (CPT-4); the Healthcare Common Procedure Coding System (HCPCS); and the National Drug Codes (NDC). All database records are statistically de-identified and certified to be fully compliant with US patient confidentiality requirements in the Health Insurance Portability and Accountability Act of 1996. The study was exempted from Institutional Review Board approval because it used only de-identified patient records and did not involve the collection, use, or transmittal of individually identifiable data.
Patient selection
Eligible patients were males with at least one claim for the prescription or administration of FVIII-PEG or rFVIIIFc from 1 January 2016 through 31 March 2021 for Commercial and 31 December 2020 for Medicaid. The index date was set as the earliest date of a claim for either FVIII-PEG or rFVIIIFc, with the index medication determining the cohort assignment. Eligible patients were also required to have at least six months of continuous eligibility for medical and pharmacy benefits before the index date (pre-index period) and following the index date (post-index period). Follow-up was then variable in length until disenrollment or study end. With the minimum six-month follow-up requirement, the latest eligible index date was six months before the study end date. Patients also had at least one non-rule out claim with a diagnosis of hemophilia A (ICD-9-CM 286.0; ICD-10-CM D66) any time prior to index. Rule-out claims are claims for services (such as laboratory or radiology) often used in ruling out conditions and are not reliable for identifying individuals with a specific condition. These types of claims alone (e.g. without an additional medical services claim) are often not enough to ensure the patient has the disease of interest and therefore they are not used for patient identification to reduce misclassification in the analysis.
Patients were excluded from the study if they had evidence of acquired hemophilia (ICD-9-CM 286.52, 286.7; ICD-10-CM D68.311, D68.4), hemophilia B (ICD-9-CM 286.1; ICD-10-CM D67), or Von Willebrand’s disease (ICD-9-CM 286.4; ICD-10-CM D68.0) in the pre-or post-index periods. Patients using emicizumab in the pre-index period or on index date were also excluded. To ensure that only non-inhibitor patients were included, patients on bypassing agents, i.e. Coagulation factor VIIa (recombinant)-jncw [SEVENFACTFootnoteiv], Anti-inhibitor coagulant complex [FEIBAFootnotev], Coagulation factor VIIa (recombinant) [NovoSevenFootnotevi], or rituximab (any time during the study period) were excluded. Additionally, those with any immune tolerance induction (ITI) therapy (separately in the pre-index period and in the first six months of post-index period, defined as at least one claim with a procedure code (CPT 85335, 85240, 85730, 85732) for Bethesda/Nijmegen assay) and with median costs for FVIII therapies in the top 5% were excluded. Patients who incur these exceptionally high costs for FVIII and have a claim for Bethesda/Nijmegen assay are on more frequent and/or high dose infusions of FVIII and do not represent the typical hemophilia populationCitation14. Finally, to limit patients receiving on demand treatment following initial diagnosis, patients <2 years on index were excluded.
Outcomes
Demographic characteristics were measured on the index date and included age, index year, insurance plan type and race (Medicaid only). Clinical characteristics were evaluated in the pre-index period. They included the Deyo-Charlson comorbidity (DCI) score as a measure of overall health statusCitation20 and hemophilia-related comorbid conditions (hepatitis C/B, joint health, musculoskeletal pain, soft tissue disorder, obesity/overweight, hypertension, diabetes, hyperlipidemia) and prior use of FVIII therapy.
All-cause and hemophilia-related HCRU and costs outcomes were evaluated during the full variable length post-index period and were reported per patient per month (PPPM). Hemophilia-related costs were defined from claims with a hemophilia diagnosis, i.e. inpatient admissions with a primary diagnosis for hemophilia, outpatient medical claims with a hemophilia diagnosis code in any position, and medical and pharmacy claims for all hemophilia treatment (inclusive of all FVIII therapies and emicizumab). Costs were reported in the following individual services categories: inpatient admissions (IP), emergency room (ER), outpatient office visits (OP), other outpatient services, and pharmacy treatments. Healthcare costs were based on paid amounts of adjudicated claims, including insurer and health plan payments, as well as patient cost-sharing in the form of copayment, deductible, and coinsurance. All dollar estimates were inflated to 2020 dollars using the Medical Care Component of the Consumer Price Index (CPI)Citation21. The costs for services provided under capitated arrangements were estimated using payment proxies based on paid claims at the procedure level.
Average weekly dosing (in international units [IU]) of the index drugs was evaluated during the post-index period prior to medication discontinuation or switch to a new FVIII or emicizumab. Discontinuation was defined as a gap of at least 60 days’ supply for pharmacy prescriptions or at least 90 days between office administrations of the index drug. A subset of patients with valid prescription fields needed to calculate dose (strength and quantity) were included in the dosing analyses. Average weekly dose was calculated as (strength * quantity)/days for supply for pharmacy claims or number of days between claims for office administered treatments, multiplied by seven. The average weekly dose in IU as well as the number of prescriptions or administrations was reported.
Statistical analyses
Descriptive statistics were summarized using means, and standard deviations (SD) continuous variables, and frequencies and percentages for categorical variables. Statistical significance was tested using t-tests and chi-square tests. The alpha level for all statistical tests was 0.05 (a threshold of p < 0.001 was considered but given that statistical significance is reviewed conjunction with actual numbers and put in a clinically meaningful context it was determined that using p < 0.05 was appropriate for interpretation of results). General linear regression models were used to compare differences in healthcare costs and average weekly dosing. Models adjusted for age, insurance plan, urbanicity, index year, DCI score, geographic region (Commercial only) and race (Medicaid only). Data analyses were conducted using WPS version 4.2 (World Programming, United Kingdom). Analytic techniques used in this analysis are consistent with health economic research methodology. It is an economic analysis but with real-world clinical implications.
Results
Patient characteristics
A total of 131 FVIII-PEG (66 Commercial; 65 Medicaid) and 204 rFVIIIFc (111 Commercial; 93 Medicaid) patients were eligible for the study (). Mean age (SD) in Commercially insured patients was 20.5 (13.6) for FVIII-PEG vs 24.4 (15.3) years for rFVIIIFc users (p = 0.088). Medicaid-insured patients were on average younger (vs Commercial), with mean (SD) age of 14.9 (7.8) for FVIII-PEG vs 17.5 (12.3) years for rFVIIIFc (p = 0.14) (). Though race data were not available for Commercially insured patients, approximately half of the patients in Medicaid were white (49.2% of FVIII-PEG and 51.6% of rFVIIIFc). A larger proportion of patients on rFVIIIFc (vs FVIII-PEG) indexed earlier in the study period (62.2% vs 28.8% in Commercial and 55.9% vs 24.6% in Medicaid indexed in 2016 p < 0.001). This was expected given the approval of FVIII-PEG in late 2015, immediately before the study’s patient selection window. A larger proportion of Commercial patients on rFVIIIFc (vs FVIII-PEG) also had FVIII therapy in the pre-index period (83.8% vs 60.6%, p < 0.001). Similar, but less pronounced results were seen among Medicaid-insured patients. DCI scores were similar across treatment groups in the two cohorts. Mean (SD) score was 0.5 (1.8) for FVIII-PEG vs 0.8 (2.1) for rFVIIIFc (p = 0.36) in Commercially insured and 0.2 (0.5) for FVIII-PEG vs 0.3 (0.8) for rFVIIIFc (p = 0.74) in Medicaid. There were no significant differences in hemophilia-related comorbid conditions between treatment groups in the Commercial and Medicaid cohorts.
Figure 1. Patient selection.
CCAE, MarketScan Commercial Claims and Encounters; MDCD, MarketScan Medicaid.
1The pre-index period was the 6-month period prior to study index. The post-index period ended at the earlier of maximum of 12 months, disenrollment in MarketScan or study end (3/31/2021).
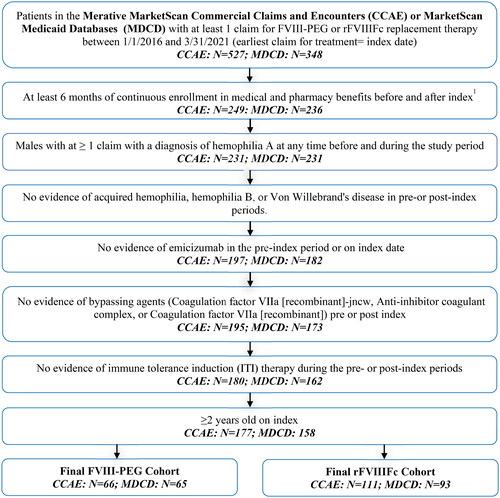
Table 1. Patient demographic and clinical characteristics.
HCRU and costs
HCRU was similar for patients treated with FVIII-PEG compared with rFVIIIFc (). Among Commercially insured patients, 10.6% (FVIII-PEG) vs 7.2% (rFVIIIFc) users had at least one inpatient admission, and 31.8% (FVIII-PEG) vs 25.2% (rFVIIIFc) had at least one emergency room (ER) visit during follow-up. Medicaid-insured patients had similar proportions of inpatient admissions (7.7% FVIII-PEG; 7.5% rFVIIIFc), and greater proportions of ER visits (35.4% FVIII-PEG; 45.2% rFVIIIFc). Outpatient office visits and pharmacy prescriptions were common (>85%) among all patient groups.
Table 2. Healthcare resource utilization by service category during the follow-up period.
Consistent with HCRU patterns, the healthcare PPPM costs were similar overall and by individual service categories but trended higher for rFVIIIFc vs FVIII-PEG patients in both Commercial and Medicaid (). Unadjusted mean PPPM (SD) total all-cause healthcare costs were $35,868 ($21,717) for FVIII-PEG vs $40,424 ($25,882) for rFVIIIFc (difference=$4,556 PPPM) in Commercial and $27,495 ($23,243) for FVIII-PEG vs $30,237 ($28,430) for rFVIIIFc (difference=$2,742 PPPM) in Medicaid. In multivariable-adjusted models (covariates = age, prior FVIII therapy, insurance, population density, index year, mean DCI, geographic location [Commercial only] and race [Medicaid only]), differences in costs by treatment type increased but were not statistically significant. Adjusted costs for rFVIIIFc (vs FVIII-PEG) were $5,215 PPPM higher in Commercial (p = 0.93) and $3,895 PPPM higher (p = 0.81) in Medicaid.
Figure 2. All-cause healthcare costs PPPM for FVIII-PEG vs rFVIIIFc users with Commercial and Medicaid insurance.
*Differences in costs between treatment groups were not significant, with p > 0.05.
ER: Emergency Room, PPPM: per patient per month.
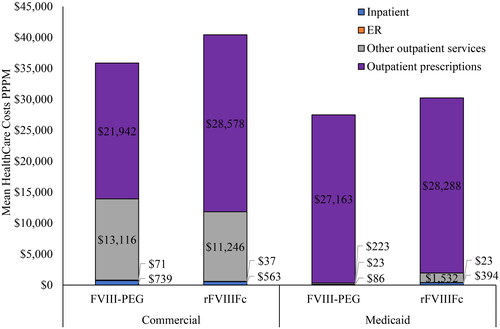
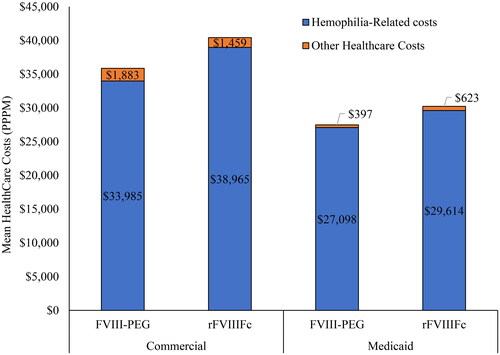
Outpatient pharmacy prescription costs were the primary driver of total costs, accounting for 61.2% and 70.7% of the total costs among Commercially insured patients and 98.8% and 93.6% of the total costs among Medicaid-insured patients. Across the two cohorts, hemophilia-related healthcare costs accounted for almost all of the all-cause total costs in both treatment groups (94.8% FVIII-PEG and 96.4% rFVIIIFc in Commercial and 98.6% FVIII-PEG vs 97.9% rFVIIIFc in Medicaid) ().
Figure 3. Hemophilia-related and other healthcare costs PPPM for FVIII-PEG vs rFVIIIFc users with Commercial and Medicaid insurance.
PPPM: Per patient per month.
Dosing
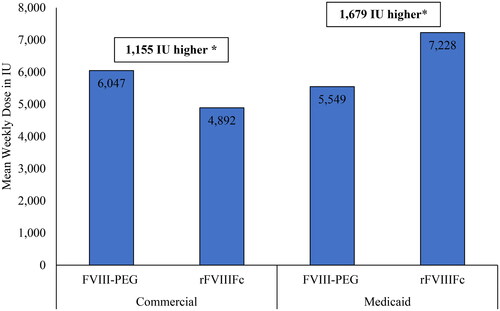
Among all patients, 79%–83% of Commercial (52 FVIII-PEG and 92 rFVIIIFc) and 94–95% of Medicaid (62 FVIII-PEG and 87 rFVIIIFc) were eligible for the dosing analyses. The PPPM mean (SD) number of index drug claims during follow-up was 0.8 (SD 0.3 or 0.4) across the treatment groups for both Commercial and Medicaid-insured patients (). Mean weekly dose for FVIII-PEG was numerically higher than rFVIIIFc in Commercial (6,047 IU vs 4,892 IU) but lower than rFVIIIFc in Medicaid (5,549 IU vs 7,228 IU). Mean weekly dose and differences in dose between treatments remained unchanged after adjusting for baseline patient characteristics (1,555 IU higher for FVIII-PEG in Commercial, p = 0.21: 1,679 IU higher for rFVIIIFc in Medicaid, p = 0.07).
Figure 4. Mean weekly dose in International units (IU) of FVIII-PEG and rFVIIIFc among users with Commercial and Medicaid insurance.
*Differences in doses between treatment groups were not significant (p > 0.05).
Discussion
This retrospective RWE study included 335 (177 Commercially insured and 158 Medicaid-insured) hemophilia A patients who were treated with EHL FVIII concentrate FVIII-PEG or rFVIIIFc. The mean unadjusted total all-cause healthcare costs PPPM were $35,868 in Commercial and $27,495 in Medicaid for FVIII-PEG users and $40,424 in Commercial and $30,237 in Medicaid for rFVIIIFc users. After adjusting for differences in baseline characteristics, healthcare costs remained higher for those treated with rFVIIIFc ($5,215 higher in Commercial and $3,895 higher PPPM in Medicaid for rFVIIIFc vs FVIII-PEG) than those treated with FVIII-PEG, but this difference was not statistically significant (p = 0.93 and p = 0.81, respectively). Differences in dose measured in IU between treatment cohorts were not significant before or after adjusting for baseline characteristics.
Healthcare costs estimated in previous studies of hemophilia-related HCRU and costs have varied substantially but remained highCitation13–17. Studies analyzing medical data from hemophilia treatment centers have reported annual per person costs for FVIII prophylaxis ranging from $292,525 (data from 2005 to 2007) to $934,301 (data from 2013 to 2019)Citation14,Citation17, with treatment accounting for majority of the costs. A previous MarketScan Commercial claims-based analysis (January 2013 to September 2019, N = 411) estimated total annual healthcare costs among patients on EHL FVIII only prophylaxis as $708,928 per person, with FVIII CFC costs accounting for 96% of total costsCitation17. Another retrospective claims-based analysis (study period: January 1999 to March 2017, N = 189) examined costs associated with managing adults with hemophilia A on FVIII prophylaxis and reported mean annual healthcare costs ranging from $407,752 to $551,645 per patient, with over 90% of the cost attributed to FVIII prophylaxisCitation14.
Consistent with the previous studies, pharmacy prescription costs were the primary component of total costs in our study. Outpatient pharmacy prescriptions accounted for 61% and 71% of the total costs among Commercially insured and 99% and 94% of the total costs among Medicaid-insured patients. This difference in proportion of prescription cost by insurance is likely due to a higher percentage of FVIII therapies being billed using pharmacy claims in Medicaid-insured compared with Commercially insured patients. The precise reason for the discrepancy in proportion of pharmacy vs medical claims by insurance coverage is unclear; however, the current findings may allude to a higher proportion of Medicaid patients receiving treatment from a specialty pharmacy and administering drug at home than those with Commercial coverage. The national proportion of hemophilia patients receiving care at a hemophilia treatment center (HTC) vary from as low as 30%Citation22 to 67–80%Citation4. Patients not treated at an HTC may receive treatment from a specialty pharmacy to be administered at home or be treated at a hospital or other non-HTC institution. The higher proportion of pharmacy claims in the Medicaid cohort may indicate a relatively higher proportion of Medicaid patients (vs Commercial) receiving treatment from a specialty pharmacy rather than an HTC. HTCs are also recognized as 340B entities, which enable the centers to purchase drug at a discounted priceCitation22. This may help reduce prescription costs for patients receiving treatment from an HTC instead of going to a non-HTC institution.
Though previous claims-based studies provide insights on the economic burden of the disease, the findings covered an earlier study period and did not report healthcare costs by specific types of FVIII therapy or insurance type. This study reported estimates from both the Commercial and Medicaid databases during a more recent study period (Jan 2016–March 2021) and evaluated the costs and dose of two common EHL FVIII treatments. Given the evolving treatment landscape for hemophilia A, these updated analyses examining the economic burden associated with specific EHL FVIII therapies in both Commercial and Medicaid represent a wider patient population compared with previous work.
Mean weekly dose for rFVIIIFc vs FVIII-PEG was 6,047 IU vs 4,892 IU in Commercial and 5,549 IU vs 7,228 IU in Medicaid, with no significant difference in dose between treatment cohorts. An analysis of medical data from hemophilia treatment centers by Recht et al. reported a mean dose of 48.4 IU/kg every 3.8 days (or 7534.1 IU per week with mean weight of 84.6 kg) for EHL formulations among hemophilia A patients without inhibitorsCitation16. The current study included pediatrics and adults (aged 2 years or older) while the previous study included only adults (aged 18 years or older). Thus, as dosing is generally weight-based, it is expected that the older patient population in the previous study received higher doses due to having higher weight. However, since the patient population, data type (electronic medical record in the previous study vs insurance claim in this study), and types of EHL treatments in each study were different, direct comparison of doses across these studies is limited. Also, a higher proportion of Medicaid-insured (95% of FVIII-PEG and 94% of rFVIIIFc) vs Commercially insured (79% of FVIII-PEG and 83% of rFVIIIFc) in each treatment cohort had data eligible for dosing, likely due to higher proportion of pharmacy (vs medical) claims in Medicaid than Commercial, and more complete information (e.g. strength, quantity) provided in pharmacy prescription vs medical claims.
This study had some limitations, including those inherent to administrative claims analyses. First, these data were not collected for research purposes and may be subject to missed or incorrect coding. Additionally, claims data lack clinical details that would provide useful information, such as the prescribed FVIII therapy regimen for each patient, patient weight, and whether FVIII therapy was intended for prophylaxis or on-demand therapy. There was also no clear designation of whether hemophilia A patients were non-inhibitor and/or receiving ITI. As such, several proxy measures were taken as an attempt to ensure that the study selected non-inhibitor hemophilia A patients on prophylactic EHL FVIII. These included the exclusion of patients using emicizumab in the pre-index period or at index date, using bypassing agents or rituximab at any time during the study period, or having any indicators for using ITI therapy. This study was also limited to individuals with Commercial or Medicaid health coverage. Consequently, these results may not be generalizable to hemophilia A patients with other insurance or without health insurance coverage. Finally, while differences between cohorts were controlled for by multivariate regressions, the adjustment was limited to characteristics that could be measured from administrative claims data. Unmeasured systematic differences between the cohorts, such as the potential differences in coverage of the two FVIII products by health plan, could have impacted the estimated outcomes. Our cohorts were well balanced on plan type, so we would not expect these differences to impact our analysis, but this impact could not be measured in the data.
Conclusions
This study uses RWD to expand findings from previous studies and is the first to provide information on HCRU, costs, and dosing of patients with hemophilia A on two specific EHL FVIII concentrate therapies, FVIII-PEG and rFVIIIFc. The mean all-cause total costs and treatment dosing were not significantly different (p > 0.05) in patients treated with FVIII-PEG and rFVIIIFc. Prior research has compared pharmacokinetic parameters for EHL productsCitation18,Citation19 or costs for EHL versus SHL treatments, but this is one of the first to compare costs for two similar EHL therapies. Results from this analysis may be used to inform product coverage and treatment decisions valuable for both payers and clinicians. Further research is needed to quantify the indirect cost burden (of both patients and caregivers) to access the full economic burden of disease among patients treated with FVIII-PEG and rFVIIIFc.
Transparency
Declaration of funding
This study was funded by Takeda Pharmaceuticals U.S.A., Inc., Lexington, MA, USA.
Declaration of financial/other interests
NP and JP are employees of Merative, Ann Arbor, MI, USA, which received funding from Takeda Pharmaceuticals USA., Inc. to conduct this research. SF, QF, BGS, and MB are employees of Takeda Pharmaceuticals USA., Inc. and hold stock and/or stock options in Takeda Pharmaceutical Company, Ltd., Osaka, Japan.
Author contributions
All authors were involved in the study design, analysis, and interpretation of the data, drafting, and revising the paper and approving the final version of the manuscript. All authors agree to be accountable for all aspects of the work.
Reviewer disclosures
Peer reviewers on this manuscript have no relevant financial or other relationships to disclose.
Previous presentations
Part of this research was presented as a poster at the Academy of Managed Care Pharmacy Nexus Congress 2022, National Harbor, MD, USA, October 11–14, 2022.
Acknowledgements
Medical Writing services were provided by Claire Bosire, of Merative, Ann Arbor, MI, USA. Programming services were provided by Caroline Henriques of Merative. Analytical services were provided by Erin Bullock of Merative. All of these services were funded by Takeda Pharmaceuticals U.S.A., Inc., Lexington, MA, USA.
Data availability statement
The data that support the findings of this study are available from Merative, Ann Arbor, MI, USA. However, restrictions apply to the availability of these data, which were used under license for this study and are not publicly available.
Notes
i ADYNOVATE is a registered trademark of Baxalta Incorporated, a Takeda company, Lexington, MA USA.
ii ELOCTATE is a registered trademark of Bioverativ, a Sanofi company, Waltham, MA USA.
iii MarketScan is a registered trademark of Merative, Cambridge, MA 02142.
iv SEVENFACT is a registered trademark of Laboratoire Francais du Fractionnement et des Biotechnologies, Les Ulis, France.
v FEIBA is a registered trademark of Baxalta Incorporated, a Takeda company, Lexington, MA USA.
vi NOVOSEVEN is a registered trademark of Novo Nordisk Health Care AG, Zurich, Switzerland.
References
- Centers for Disease Control and Prevention. Data and Statistics on Hemophilia; 2022. Available from: https://www.cdc.gov/ncbddd/hemophilia/data.html
- National Organization for Rare Disorders. Hemophilia A. Rare Disease Database; Updated 2021. Available from https://rarediseases.org/rare-diseases/hemophilia-a/
- Salen P, Babiker HM, Hemophilia A. StatPearls. Treasure Island (FL): StatPearls Publishing LLC; 2022.
- Soucie JM, Evatt B, Jackson D. Occurrence of hemophilia in the United States. The hemophilia surveillance system project investigators. Am J Hematol. 1998;59(4):288–294. doi: 10.1002/(SICI)1096-8652(199812)59:4<288::AID-AJH4>3.0.CO;2-I.
- Soucie JM, Miller CH, Dupervil B, et al. Occurrence rates of haemophilia among males in the United States based on surveillance conducted in specialized haemophilia treatment centres. Haemophilia. 2020;26(3):487–493. doi: 10.1111/hae.13998.
- Srivastava A, Santagostino E, Dougall A, et al. WFH guidelines for the management of hemophilia, 3rd edition. Haemophilia. 2020;26(Suppl 6):1–158. doi: 10.1111/hae.14046.
- Chen SL. Economic costs of hemophilia and the impact of prophylactic treatment on patient management. Am J Manage Care. 2016;22(5):S126–S133.
- Aledort L, Mannucci PM, Schramm W, et al. Factor VIII replacement is still the standard of care in haemophilia A. Blood Transfus. 2019;17(6):479–486.
- Croteau SE, Cheng D, Cohen AJ, et al. Regional variation and cost implications of prescribed extended half-life factor concentrates among U.S. Haemophilia Treatment Centres for patients with moderate and severe haemophilia. Haemophilia. 2019;25(4):668–675. doi: 10.1111/hae.13758.
- Malec LM, Cheng D, Witmer CM, et al. The impact of extended half-life factor concentrates on prophylaxis for severe hemophilia in the United States. Am J Hematol. 2020;95(8):960–965. doi: 10.1002/ajh.25844.
- U.S. Food and Drug Administration. Antihemophilic factor (recombinant), PEGylated (Adynovate) prescibing infomation. 2022. Available from: https://www.fda.gov/media/102389/download
- U.S. Food and Drug Administration. Antihemophilic factor (recombinant), Fc fusion protein (Eloctate) prescibing information. 2022. Available from: https://www.fda.gov/media/88746/download
- Zhou ZY, Koerper MA, Johnson KA, et al. Burden of illness: direct and indirect costs among persons with hemophilia a in the United States. J Med Econ. 2015;18(6):457–465. doi: 10.3111/13696998.2015.1016228.
- Croteau SE, Cook K, Sheikh L, et al. Health care resource utilization and costs among adult patients with hemophilia A on factor VIII prophylaxis: an administrative claims analysis. J Manag Care Spec Pharm. 2021;27(3):316–326. doi: 10.18553/jmcp.2021.27.3.316.
- Shrestha A, Eldar-Lissai A, Hou N, et al. Real-world resource use and costs of haemophilia A-related bleeding. Haemophilia. 2017;23(4):e267–e275. doi: 10.1111/hae.13220.
- Recht M, He C, Chen E, et al. Resource utilization and treatment costs of patients with severe hemophilia A: real-world data from the ATHNdataset. eJHaem. 2022;3(2):341–352. doi: 10.1002/jha2.412.
- Thornburg CD, Adamski K, Cook K, et al. Health care costs and resource utilization among commercially insured adult patients with hemophilia A managed with FVIII prophylaxis in the United States. J Manag Care Spec Pharm. 2022;28(4):449–460. doi: 10.18553/jmcp.2021.21368.
- Carcao MD, Chelle P, Clarke E, et al. Comparative pharmacokinetics of two extended half-life FVIII concentrates (Eloctate and Adynovate) in adolescents with hemophilia A: is there a difference? J Thromb Haemost. 2019;17(7):1085–1096. doi: 10.1111/jth.14469.
- Teitel J, Sholzberg M, Iorio A. Extended half-life factor VIII concentrates in adults with hemophilia A: comparative pharmacokinetics of two products. Res Pract Thromb Haemost. 2021;5(2):349–355. doi: 10.1002/rth2.12476.
- Deyo RA, Cherkin DC, Ciol MA. Adapting a clinical comorbidity index for use with ICD-9-CM administrative databases. J Clin Epidemiol. 1992;45(6):613–619. doi: 10.1016/0895-4356(92)90133-8.
- U.S. Bureau of Labor Statistics. Consumer price index—all urban consumers, US medical care 2020. 2020. Available from: https://www.bls.gov/cpi/data.htm
- AMCP. Summit on hemophilia: findings from the AMCP Market Insights Program. 2018. Available from: https://www.amcp.org/Resource-Center/meeting-proceedings-findings/amcp-market-insights-summit-hemophilia