
Abstract
Aim
The aim of the study is to assess the accuracy of overall survival (OS) extrapolations in cost-effectiveness analysis made by the Dental and Pharmaceutical Benefits Agency (TLV) to decide on the reimbursement and use of oncology drugs in Sweden.
Material and methods
TLV appraisals for oncology drugs were identified during a 5-year period (2013-2017). To be included each appraisal and health economic model must include a TLV base case extrapolation of OS. Further, Kaplan-Meier (KM) estimates on OS from the original and follow-up clinical trials must be available. Potential follow-up trials on OS were identified in ClinicalTrials.gov and the Lund University Libraries databases, and in the Swedish Medical Products Agency (MPA) and the European Medicines Agency (EMA) databases. In cases where the KM estimates were not available, data points from figures published in TLV’s appraisals were extracted using the semi-automated tools Digitizelt and WebPlotDigitizer. The accuracy of survival extrapolations was assessed by comparing extrapolated and observed life-years (LYs), using three different measures: 1) difference in LYs between the treatment and control group; 2) LYs in the treatment group, 3) LYs in the control group.
Results
We study TLV’s preferred OS extrapolations and show that on average they overestimate the observed mean gain in LYs by 24%, and underestimate observed LYs by 3% and 11% in the treatment and control group, respectively.
Conclusions
We conclude that it is feasible to validate OS extrapolations by comparing extrapolated and observed life-years. Even if survival extrapolations are reasonably accurate for the treatment group, this may still imply that extrapolations of LYs gained deviates to a larger extent. Follow-up studies on OS should be carried out to an increased extent to be able to validate, update and improve OS extrapolations in cost-effectiveness analysis of oncology drugs.
Introduction
HTA-agencies, like the Dental and Pharmaceutical Benefits Agency (TLV) in Sweden, and the National Institute for Health and Care Excellence (NICE) in England and Wales, use cost-effectiveness analysis (CEA) to inform decisions on the reimbursement and use of pharmaceuticals and other health care interventions. A specific challenge when assessing the cost-effectiveness of interventions that extend survival is to accurately predict the gain in survival from a life-time perspective. The gain in survival of a treatment as reflected in a clinical trial is usually only a small part of the total expected gain in survival from a life-time perspective. At the time when the HTA-agency makes the decision, survival data is only available for a limited time-period defined by the follow-up time in the clinical trial and thus, to be able to reflect changes in survival from a life-time perspective, survival needs to be extrapolated outside the range of data in the clinical trial.
Extrapolation of survival can be based only on data from the clinical trial or on data within and external to the clinical trial. Using a combination of clinical trial and external data is sometimes used for the prediction of survival in the comparator (control) treatment group. To extrapolate survival based on clinical trial data, different prediction models can be estimated, which can be characterized as parametric, semiparametric, and non-parametric. Examples of parametric survival models are the exponential, Weibull, lognormal, and generalized gamma modelsCitation1. These models are characterized by hazard functions displaying different kinds of behavior; the hazard function for the exponential distribution is constant, the hazard function for the Weibull distribution is monotonically increasing or decreasing, and the hazard function of the lognormal and generalized gamma model is flexible. Note that the exponential, Weibull, and lognormal models can be viewed as special cases of the generalized gamma model.
In Sweden, TLV summarizes the information on cost-effectiveness for a specific drug in a (publicly available) decision recommendation document (TLV appraisal), which includes a recommendation on which medicines to subsidize and include in the high-cost threshold. This recommendation is used by the Pharmaceutical Benefits Board (PBB) at TLV as an input for the reimbursement decision. TLV also produces appraisals for the regions in Sweden (which provide healthcare and are responsible for all publicly financed healthcare) as an input for whether to purchase a medicine to be used for inpatient care. Most TLV appraisals for drugs that improve survival include a prediction of survival used by TLV, which means that survival is extrapolated outside the range of data in the clinical trial. At the time for the decision (made by PBB or the regions) there is a high degree of uncertainty related to how well the model predictions will reflect “true” survival and “true” survival gains as reflected by long-term follow-up data on survival. The uncertainty in prediction models is usually handled by extensive sensitivity analysis, where different models are explored in scenario analyses. Given the high degree of uncertainty in the survival predictions there is an urgent need to validate model predictions. If validation studies demonstrate that predictions of survival and gain in survival to a large extent deviate from observed survival in follow-up studies, there is a need to further investigate how to improve model predictions at the time for the decision. Furthermore, this motivates reassessing the cost-effectiveness based on updated survival predictions from follow-up data on survival.
A previous study byCitation2 validated overall survival (OS) extrapolations for immune-checkpoint inhibitors made by the National Institute for Health and Care Excellence (NICE). The accuracy of the extrapolations was assessed in terms of how well the model predicted the observed proportion of patients being alive in the treatment (active) group as reflected by Kaplan-Meier (KM) follow-up data. The study showed that survival extrapolations on average underestimated survival between 0.4 and 2.7%. The authors concluded that further research is required to confirm these findings.
Even though there is an underestimation of OS in the treatment group it is not obvious whether this will also imply an underestimation of the difference in OS between the treatment and control group. This depends on whether the OS in control group is over- or underestimated. E.g., if the underestimation is the same in the control and treatment group the difference in OS between the groups may still be accurate. Furthermore, even if there was a small underestimation of the difference in OS between the treatment and control group this may still have a sizeable impact on the cost-effectiveness results and the incremental cost-effectiveness ratio. Only small differences in the gain in life-years (LS) may have a significant impact on the cost-effectiveness results.
Another option to validate survival extrapolations, instead of using the proportion of patients being alive, is to compare the extrapolated gain in life-years (between the treatment and control group) with the gain in life-years as reflected by clinical trial follow-up data. Ideally, we would like to validate the survival predictions from a lifetime perspective. However, in most cases follow-up clinical trial data on survival are only available for limited time-periods where the original clinical trial is only slightly extended. When clinical trial follow-up survival data are available in the treatment and control group, it is possible to validate the extrapolated gain in life-years for the time-period of the extension of the initial clinical trial.
The purpose of this pilot study is to assess the accuracy of extrapolations of life-years (LYs) made in TLV appraisals of cancer drugs in the period 2013-2017, and to assess whether extrapolations of LYs overestimate or underestimate LYs as reflected by follow-up data on survival. This is achieved by comparing extrapolated LYs with observed LYs from clinical trial follow-up data. The following research questions are investigated:
What is the difference between extrapolated and observed differences in LYs between the treatment and control group?
What is the difference between extrapolated and observed LYs in the treatment group?
What is the difference between extrapolated and observed LYs in the control group?
Methods
Data collection and identification of TLV appraisals
TLV appraisals for oncology drugs were identified during a 5-year period (2013-2017). Searches were all performed between the 7th of June and 17th of July 2020, and during fall 2020. To be eligible for inclusion, each appraisal must include a TLV base case extrapolation of long-term OS, i.e. estimated model parameter values and a graph showing OS over a lifetime perspective, for the treatment and control group, respectively. Further, for each appraisal, Kaplan-Meier estimates on OS from the original and follow-up clinical trials had to be available for the active and control group, respectively.
By using each original clinical trial’s National Clinical Trial (NCT) identification number in ClinicalTrials.gov, we could identify potential published follow-up survival studies in ClinicalTrials.gov and the Lund University Libraries database. In addition, we were able to obtain not yet published follow-up survival data, from the Swedish Medical Products Agency (MPA) and the European Medicines Agency (EMA) database. Whenever no published follow-up data could be found via the NCT identification number, we searched for the original clinical trial in the EMA database. If information regarding follow-up survival data were available in EMA, we then contacted the Swedish Medical Products Agency (MPA) and received in some cases additional Kaplan-Meier estimates from follow-up clinical studies not yet published.
Extrapolated long-term survival curves as well as Kaplan-Meier estimates from the original clinical trial were extracted from the health economic models submitted to TLV by the pharmaceutical companies. In cases where the Kaplan-Meier estimates were not available in the health economic models, data points from figures published in TLV’s appraisals were extracted using the semi-automated tools Digitizelt and WebPlotDigitizerCitation3. The included variables are presented below.
The main variable of interest was (observed) OS for the treatment- and control groups in the original and follow-up clinical trials, extracted from the original and updated Kaplan-Meier curves, as well as the extrapolated survival curves estimated from the original clinical trial and used in the health economic model. OS refers to the survival probability or the percentage of people who are still alive at a given time from the start of treatments in the original clinical trial. These variables were all accompanied by one time variable (month). A variable specifying the number of patients at risk in the Kaplan Meier-estimates at different time points was also included.
Statistical analysis
The Guyot methodCitation4 was used to transform the data to pseudo individualized data, thereby enabling the construction of confidence interval for the survival curves in the treatment and control group. We present the results graphically using survival curves (with 95% confidence intervals) for the study’s treatment and control group.
Model accuracy and measures of deviation
Let t0 denote the start of the original KM (RCT 1), t1 the maximum follow-up time point of RCT 1 (defined as the maximum follow-up time of the treatment and control group), and t2 the maximum follow-up time point of the updated KM (defined as the minimum follow-up time of the treatment and control group). To measure model accuracy, the degree of deviation between model extrapolations and observed OS was used by using the following measures:
The difference between the extrapolated and observed restricted mean difference in life-years (LYs) between the treatment and control group between t1 and t2.
The difference between the extrapolated and observed mean restricted life-years (LYs) in the treatment group between t1 and t2.
The difference between the extrapolated and observed mean restricted life-years (LYs) in the control group between t1 and t2.
The deviations above are expressed both in LYs (and months) and percentages (%) when comparing the extrapolations with the observed data.
Results
An overview of the selection of TLV appraisals is presented in . The final dataset consisted of nine TLV appraisals as presented in . The mean follow-up time (t0 – t1) in the original clinical trial was 30 months, and 51 months (t0 – t2) in the follow-up clinical trial. The additional average follow-up time (t1 – t2) provided by the follow-up survival data was 22 months. The extrapolation method was based on parametric survival models, which was the same for the treatment and control group in five cases (56%). In three cases (33%) different parametric models were used for the treatment and control group, respectively. In seven cases (78%) only data from the original clinical trial were used for the extrapolation of OS. In two cases (22%), external data complemented the clinical trial data for the extrapolation of OS. As shown in , clinical trials report cross-over to be present in three cases in the original clinical trial (33%), four cases in the follow-up clinical trial (44%), and in six cases in the original and/or follow-up trial (67%). In two cases (22%) the information about cross-over is not reported and unknown, and in one case (11%) no cross-over is reported to be present. In none of the TLV appraisals cross-over were adjusted for in the health economic model.
Figure 1. PRISMA diagram for the inclusion of relevant TLV appraisals.
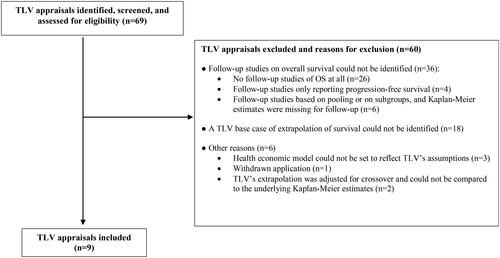
Table 1. Characteristics of identified TLV appraisals.
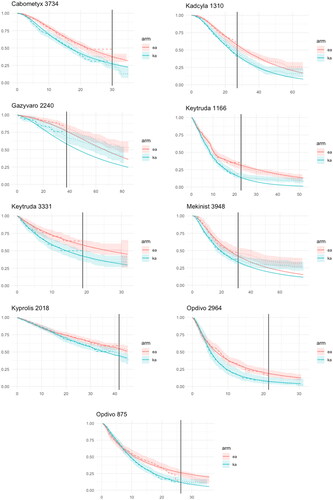
Observed and model-based OS curves for the treatment and control group are presented in . Note that the model-based OS curves are close to the KM-curves in the period (t0 – t1). Only for Gazyvaro, where external data complemented clinical trial data for the model estimation of OS, the model interpolations deviate from the KM-curves in the period (t0 – t1).
Figure 2. Observed, modelled, and extrapolated overall survival (OS).
Extrapolated and observed mean survival times (in months) in the follow-up period (between t1 and t2) are presented in . On average the extrapolation overestimates the observed gain in LYs by 24% (0.51 months) and varies between an underestimation of 48% to an overestimation of 143% (standard error of the mean (SEM) = 0.21). On average the extrapolation underestimates the mean survival between t1 and t2 by 3% (0.88 months) in the treatment group and by 11% (1.39 months) in the control group.
Table 2. Months (area under the curve) in the follow-up period for the treatment-, and control group, and for the difference between the treatment groups, for identified drugs (TLV-appraisals), comparing model extrapolation with observed data. Model over/under estimation is expressed in %.
Discussion
In this pilot study we show that TLV’s preferred survival extrapolations on average overestimates the observed gain in LYs by 24%. The study also shows that TLVs extrapolations on average underestimates observed LYs by 3% and 11% in the treatment and control group, respectively. Because the average size of the underestimation in life-years is somewhat higher in the control group compared with the treatment group this implies an overestimation of the gain in LYs.
The methods used for extrapolation of OS were in seven TLV-appraisals (78%) based only on data from the original clinical trial. In two out of nine appraisals (22%) clinical trial data were combined with external information outside the clinical trial to extrapolate survival. The reason for using external information was reported to be due to limited follow-up and immature data at the time of TLV’s decision, and therefore, additional clinical trial and registry data was used to estimate long-term OS. For Kyprolis the study byCitation5 was used to estimate OS in the control group, and for Gazyvaro the study byCitation6 was used to estimate post-progression survival. The extrapolation of survival was in all appraisals based on parametric models, and often the same model was used for the treatment and control group, respectively. It should be emphasized that TLV accepted the manufacturer’s suggested base case survival model for the extrapolation of survival in five appraisals (56%). The reason for using different base case survival models was due to selecting a different parametric model and comparator.
TLV on average underestimates LYs in the treatment group by 3%, which is close to the findings inCitation2 showing that extrapolations on average underestimated survival between 0.4–2.7% in the treatment group. Bullement et al. measured the model accuracy as the vertical distance (in percentages) between the predicted and observed proportion of patients being alive in the treatment group (as reflected by KM follow-up data). The deviation was measured at two time points: 1) at the end of the original KM curve 2) at the mid-point between the maximum follow-up of the original KM curve and maximum follow-up of the follow-up KM curve. Bullement et al. validated OS extrapolations for 10 appraisals of immune-checkpoint inhibitors made by the National Institute for Health and Care Excellence (NICE). The mid-point survival extrapolations on average underestimated survival between 1.9%, if based on manufacturer, and 2.7%, if based on the NICE independent Evidence Review Group. Because the underestimation was considered small, the authors concluded that the extrapolations were still suitable for HTA-decisionsCitation2.
Because we used, as our measure of model accuracy, the area under the curve (LYs) for the follow-up-period, a strength of our validation method, compared to Bullement et al. is that we account for all additional information on survival in the follow-up period provided by the data in the follow-up study, and not only a specific time point in the follow-up period. We believe our measure of model accuracy to be more relevant because it reflects, for the follow-up period, what TLV wants to measure, i.e. the gain in LYs implied by the treatment.
Using the terminology described inCitation7 we use prospective validation to assess the model accuracy of OS. Kim & Thompson describe three validation methods: internal, prospective, and external validation. Internal validation uses the same data to estimate the model, as for to evaluate the model. Prospective validation uses only new data obtained through an extended follow-up of the same study, used to first estimate the model, to evaluate the model. Prospective validation means that the model output is compared only with extended follow-up data. Finally, external validation means that the model output is compared only with data from a new studyCitation7.
Some limitations of our study should be noted. First, about 87% (n = 60) of identified TLV appraisals were excluded. The main reason for exclusion was the lack of follow-up studies on OS, and more than half of TLV-assessments (n = 36) had to be excluded for this reason. Either follow-up survival data were not at all available (n = 26), or only available for progression free survival or subgroups of patients (n = 10). Another reason for exclusion was that a TLV base case of extrapolation of survival could not be identified, i.e. no base case analysis was presented in the appraisal (n = 18). Finally, two appraisals were excluded since TLV’s extrapolation was adjusted for crossover and could not be compared to the underlying Kaplan-Meier estimates (n = 2). Due to the limited number of TLV-appraisals included, our results should be interpreted with caution and not be generalized to all TLV-appraisals for oncology drugs.
Second, the average extended follow-up time was approximately two years. We would like to have had a longer follow-up time to be able to make improved and more reliable validations of OS in the longer run. In most TLV-assessments, survival is extrapolated over a lifetime perspective, and longer follow-up studies is therefore needed.
Another limitation is the lack of information about the presence and size of cross-over in the clinical trials (original and follow-up clinical trials). Cross-over implies that patients in the control group to some extent switch over to the treatment group, typically if the patient’s disease worsens. E.g., in five of the original clinical studies (56%), which form the basis of the extrapolation of OS, information was missing about cross-over. In two appraisals no information about the presence of cross-over was available in the original and follow-up clinical trial. In five appraisals information about cross-over was missing either in the original or follow-up clinical trial. Only one appraisal reported cross-over to be present both in the original and follow-up trial, and in one appraisal cross-over was reported not to be present at all in the original and follow-up clinical trial. In the four clinical studies where cross-over was reported and stated, the mean cross-over was 23%.
Note that cross-over was not adjusted for in any of the included appraisals, and neither TLV nor the company adjusted for cross-over. A motivation was given in the appraisal for Keytruda (3331/2016), where adjustment for crossover was not considered appropriate since immunotherapy (like Keytruda) is recommended as subsequent treatment for patients who have previously been treated with platinum-based chemotherapy. The reason for not adjusting for cross-over can be explained by the missing information about cross-over, but also because it is not obvious how to proceed to adjust for cross-over. It is not clear how cross-over may impact real improvements in OS (without cross-over). As pointed out byCitation8 crossover may distort the outcomes of clinical studies, and may either mask real survival benefits or real null or negative OS effects. Crossover may thus imply real survival improvements being either over- or understated.
The potential effect of cross-over, and how this may impact our validation results, is difficult to assess due to the missing information about cross-over in the clinical trials. The potential effect depends on whether the health economic model corrects for cross-over or not, and if cross-over is present in the original and follow-up clinical trial. E.g., if cross-over is prevalent in the original clinical trial and TLV and the pharmaceutical company agree on not to adjust for cross-over in the health economic model, this indicates that TLV and the pharmaceutical company also consider it reasonable not to adjust for cross-over when modeling the OS in the control group, and the gain in survival. The extrapolations of OS should then be compared to follow-up clinical trial data also allowing for cross-over. In this situation we do not expect cross-over to imply that the model overestimates/underestimates observed gain in survival. For the three appraisals where cross-over was reported to be present in the original trial, cross-over was not adjusted for in the health economic model, and in two of these cases life-years gained in TLV base case was the same as in company base case. In the third case the company base case model used an exponential model (but did not adjust for cross-over) instead of a log-logistic model used by TLV. Note that for two appraisals, it was unclear whether cross-over was also present in the follow-up clinical trial.
For the situation where there is only cross-over in the follow-up clinical trial, and the model does not adjust for cross-over, because it was not present in the original trial, it is expected that cross-over may contribute to an overestimation of the observed gain in survival, given that the observed OS in the control group improves with cross-over (although the opposite effect cannot be ruled out). In our study there were four cases (Kadcyla/Keytruda/Mekinist/Opdivo) where cross-over was reported to be present in the follow-up trial and for these cases the extrapolated gain in LYs overestimated the observed gain in LYs by 41%. However, in three of these trials (Kadcyla/Mekinist/Opdivo) information about cross-over was lacking in the original trial, which makes it difficult to draw any firm conclusions about the potential impact of cross-over on the validation results.
To facilitate the HTA-process to validate and update OS extrapolations, it is important that the process is characterized by transparency and a focus on estimating the value of the oncology drug in terms of life-years gainedCitation9. To facilitate the conduct of future validation studies of OS extrapolations in cost-effectiveness analysis of oncology drugs made by TLV and other HTA-agencies, the following is suggested:
HTA-appraisals should always report and be transparent about model assumptions, and data used for survival extrapolations
HTA scenarios from cost-effectiveness analyses should always be saved and made available for future use
Clinical trials should improve the reporting about whether cross-over is prevalent or not, and if so, to what extent. This will facilitate the question of how cross-over should be handled in health economic models
It is important to conduct and publish follow-up clinical trials on overall survival
Conclusions
In this pilot study we show that it is feasible to validate extrapolations of OS by comparing extrapolated LYs with observed LYs as reflected by clinical trial follow-up data. We show that even if survival extrapolations on average are reasonably accurate for the treatment group, and just deviate to a small extent, extrapolations of the gain in survival may deviate to a larger extent. It is important to routinely collect and report long-term OS in follow-up clinical trials to be able to validate and update OS extrapolations in health economic models. This will reduce the uncertainty and improve decisions on the reimbursement and use of oncology drugs, with the aim to enhance the efficiency in the allocation of health care resources to improve health.
Transparency
Declaration of funding
Nothing to declare. None of the authors have received a specific grant for this research from any funding agency in the public, commercial or not-for-profit sectors.
Declaration of financial/other relationships
JB was employed and financed by TLV in the period 2022-2023. Nothing else to declare.
Author contributions
JB, HA, DL, and NZ equally contributed to the planning and designing of the study, and to the interpretation of study findings, writing and reading of the manuscript. JB performed the analyses of the data with the assistance of HA. Before submission all authors have approved the final manuscript.
Reviewer disclosures
Peer reviewers on this manuscript have no relevant financial or other relationships to disclose.
Acknowledgements
The authors would like to thank Anna Gustafsson for contributing to the data collection, and Anders Viberg for valuable comments and contributions on previous versions of the manuscript.
References
- Gerdtham U-G, Zethraeus N. Predicting survival in cost-effectiveness analyses based on clinical trials. Int J Technol Assess Health Care. 2003;19(3):507–512. doi: 10.1017/s0266462303000436.
- Bullement A, Meng Y, Cooper M, et al. A review and validation of overall survival extrapolation in health technology assessments of cancer immunotherapy by the National Institute for Health and Care Excellence: how did the initial best estimate compare to trial data subsequently made available? J Med Econ. 2019;22(3):205–214. doi: 10.1080/13696998.2018.1547303.
- Rohatgi A. WebPlotDigitizer; 2022. (version 4.6). Available at: https://automeris.io/WebPlotDigitizer. [Last accessed September, 2023]
- Guyot P, Ades A, Ouwens MJ, et al. Enhanced secondary analysis of survival data: reconstructing the data from published Kaplan-Meier survival curves. BMC Med Res Methodol. 2012;12(1):9. doi: 10.1186/1471-2288-12-9.
- Orlowski RZ, Nagler A, Sonneveld P, et al. Final overall survival results of a randomized trial comparing bortezomib plus pegylated liposomal doxorubicin with bortezomib alone in patients with relapsed or refractory multiple myeloma. Cancer. 2016;122(13):2050–2056. doi: 10.1002/cncr.30026.
- Eichhorst BF, Busch R, Stilgenbauer S, et al. First-line therapy with fludarabine compared with chlorambucil does not result in a major benefit for elderly patients with advanced chronic lymphocytic leukemia. (CLL11). Blood. 2009;114(16):3382–3391. doi: 10.1182/blood-2009-02-206185.
- Kim LG, Thompson SG. Uncertainty and validation of health economic decision models. Health Econ. 2010;19(1):43–55. doi: 10.1002/hec.1444.
- Prasad V. Double-crossed: why crossover in clinical trials may be distorting medical science JNCCN. J Natl Compr Canc Netw. 2013;11(5):625–627. doi: 10.6004/jnccn.2013.0077.
- Bonetti A, Giuliani J. Implications of drugs with rebate in Europe. Lancet Reg Health Eur. 2021;3:100060. doi: 10.1016/j.lanepe.2021.100060.
- Borghaei H, Paz-Ares L, Horn L, et al. Nivolumab versus docetaxel in advanced non-squamous non-small cell lung cancer. (checkmate-057). N Engl J Med. 2015;373(17):1627–1639. doi: 10.1056/NEJMoa1507643.
- Choueiri TK, Escudier B, Powles T, et al. Cabozantinib versus everolimus in advanced renal cell carcinoma (METEOR): final results from a randomised, open-label, phase 3 trial. Lancet Oncol. 2016;17(7):917–927. doi: 10.1016/S1470-2045(16)30107-3.
- Diéras V, Miles D, Verma S, et al. Trastuzumab emtansine versus capecitabine plus lapatinib in patients with previously treated HER2-positive advanced breast cancer (EMILIA): a descriptive analysis of final overall survival results from a randomised, open-label, phase 3 trial. Lancet Oncol. 2017;18(6):732–742. doi: 10.1016/S1470-2045(17)30312-1.
- Dimopoulos MA, Goldschmidt H, Niesvizky R, et al. Carfilzomib or bortezomib in relapsed or refractory multiple myeloma (ENDEAVOR): an interim overall survival analysis of an open-label, randomised, phase 3 trial. Lancet Oncol. 2017;18(10):1327–1337. doi: 10.1016/S1470-2045(17)30578-8.
- Ferris RL, Blumenschein G, Fayette J, et al. Nivolumab for recurrent squamous-cell carcinoma of the head and neck. (checkmate-141). N Engl J Med. 2016;375(19):1856–1867. doi: 10.1056/NEJMoa1602252.
- Yen C-J, Kiyota N, Hanai N, et al. Nivolumab vs investigator’s choice in recurrent or metastatic squamous cell carcinoma of the head and neck: 2-year long-term survival update of CheckMate 141 with analyses by tumor PD-L1 expression. Head Neck. 2018;42(10):2852–2862. doi: 10.1016/j.oraloncology.2018.04.008.
- Goede V, Fischer K, Busch R, et al. Obinutuzumab plus chlorambucil in patients with CLL and coexisting conditions. (CLL11). N Engl J Med. 2014;370(12):1101–1110. doi: 10.1056/NEJMoa1313984.
- Herbst RS, Baas P, Kim D-W, et al. Pembrolizumab versus docetaxel for previously treated, PD-L1-positive, advanced non-small-cell lungcancer (KEYNOTE-010): a randomised controlled trial. Lancet. 2016;387(10027):1540–1550. doi: 10.1016/S0140-6736(15)01281-7.
- Ludwig H, Dimopoulos MA, Moreau P, et al. Carfilzomib and dexamethasone vs bortezomib and dexamethasone in patients with relapsed multiple myeloma: results of the phase 3 study ENDEAVOR (NCT01568866) according to age subgroup. Leuk Lymphoma. 2017;58(10):2501–2504. doi: 10.1080/10428194.2017.1298755.
- Motzer RJ, Escudier B, Powles T, et al. Long-term follow-up of overall survival for cabozantinib versus everolimus in advanced renal cell carcinoma. (METEOR). Br J Cancer. 2018;118(9):1176–1178. doi: 10.1038/s41416-018-0061-6.
- Reck M, Rodríguez-Abreu D, Robinson AG, et al. Pembrolizumab versus chemotherapy for PD-L1–positive non–small-Cell lung cancer. (keynote-024). N Engl J Med. 2016;375(19):1823–1833. doi: 10.1056/NEJMoa1606774.
- Verma S, Miles D, Gianni L, et al. Trastuzumab emtansine for HER2-positive advanced breast cancer. (EMILIA). N Engl J Med. 2012;367(19):1783–1791. doi: 10.1056/NEJMoa1209124.